arXiv:hep-ex/0603049v1 23 Mar 2006
EUROPEAN LABORATORY FOR PARTICLE PHYSICS
CERN–PH–EP / 2006–005 March 9, 2006
Bottomonium and Drell-Yan production
in p-A collisions at 450 GeV
NA50 Collaboration
B. Alessandro10, C. Alexa3, R. Arnaldi10, M. Atayan12, S. Beol`e10, V. Boldea3,
P. Bordalo6,a, G. Borges6, J. Castor2, B. Chaurand9, B. Cheynis11, E. Chiavassa10,
C. Cical`o4, M.P. Comets8, S. Constantinescu3, P. Cortese1, A. De Falco4,
N. De Marco10, G. Dellacasa1, A. Devaux2, S. Dita3, J. Fargeix2, P. Force2,
M. Gallio10, C. Gerschel8, P. Giubellino10, M.B. Golubeva7, A. Grigoryan12,
J.Y. Grossiord11, F.F. Guber7, A. Guichard11, H. Gulkanyan12, M. Idzik10,b,
D. Jouan8, T.L. Karavicheva7, L. Kluberg9, A.B. Kurepin7, Y. Le Bornec8,
C. Louren¸co5, M. Mac Cormick8, A. Marzari-Chiesa10, M. Masera10, A. Masoni4,
M. Monteno10, A. Musso10, P. Petiau9, A. Piccotti10, J.R. Pizzi11, F. Prino10,
G. Puddu4, C. Quintans6, L. Ramello1, S. Ramos6,a, L. Riccati10, H. Santos6,
P. Saturnini2, E. Scomparin10, S. Serci4, R. Shahoyan6,c, M. Sitta1,
P. Sonderegger5,a, X. Tarrago8, N.S. Topilskaya7, G.L. Usai4, E. Vercellin10,
N. Willis8.
Abstract
The NA50 Collaboration has measured heavy-quarkonium production in p-A collisions at 450 GeV incident energy (√s = 29.1 GeV). We report here results on the production of the Υ states and of high-mass Drell-Yan muon pairs (mµµ > 6 GeV/c2). The cross-section at midrapidity and the A-dependence of the measured yields are determined and compared with the results of other fixed-target experiments and with the available theoret-ical estimates. Finally, we also address some issues concerning the transverse momentum distributions of the measured dimuons.
1 Universit`a del Piemonte Orientale, Alessandria and INFN-Torino, Italy 2 LPC, Univ. Blaise Pascal and CNRS-IN2P3, Aubi`ere, France
3 IFA, Bucharest, Romania
4 Universit`a di Cagliari/INFN, Cagliari, Italy 5 CERN, Geneva, Switzerland
6 LIP, Lisbon, Portugal 7 INR, Moscow, Russia
8 IPN, Univ. de Paris-Sud and CNRS-IN2P3, Orsay, France 9 LLR, Ecole Polytechnique and CNRS-IN2P3, Palaiseau, France 10 Universit`a di Torino/INFN, Torino, Italy
11 IPN, Univ. Claude Bernard Lyon-I and CNRS-IN2P3, Villeurbanne, France 12 YerPhI, Yerevan, Armenia
a) also at IST, Universidade T´ecnica de Lisboa, Lisbon, Portugal
b) also at Faculty of Physics and Nuclear Techniques, AGH University of Science and Technology, Cracow, Poland
1
Introduction
The study of heavy quarkonium states is very important for our understanding of the physics of strong interactions and represents today one of the most challenging fields of application of QCD [1]. By studying quarkonium production in p-A col-lisions at fixed-target energies, various aspects of the theory of strong interactions can be addressed. In particular, such data can be used to constrain theoretical ap-proaches used for the calculation of the production cross-section in nucleon-nucleon interactions, such as the color-evaporation model (CEM) [2] or the nonrelativistic QCD formulation (NRQCD) [3]. Furthermore, by comparing the production data on various nuclear targets, the details of the color neutralization process of the qq pair can be investigated [4–6]. Finally, p-A data are an essential reference for the study of the anomalous suppression of quarkonia production predicted to occur in ultrarelativistic heavy-ion collisions [7–9].
To investigate these topics, the NA50 Collaboration performed a systematic study of quarkonium production on several nuclear targets with proton beams at 450 GeV/c incident momentum. Results on the charmonium states J/ψ and ψ′, detected through
their decay into two muons, have already been published [10, 11]. Thanks to the large integrated luminosity (∼10 pb−1 for each target), the dimuon mass spectrum
also shows a signal corresponding to the sum of the Υ(1S), Υ(2S) and Υ(3S) states (simply denoted as Υ in the following).
Various results on Υ production in proton-induced collisions exist at fixed target and at ISR energies [12–25], but they are usually less precise than the corresponding charmonium results. Up to now, no data are available at 450 GeV (√s = 29.1 GeV), and the A-dependence of the production cross-section has only been studied by the E772 experiment [22], at a higher incident energy.
In this Letter we show results on the production of the Υ in proton-induced collisions on five nuclear targets (Be, Al, Cu, Ag, W). After applying the appropriate cuts, the total number of Υ meson events is of the order of 300. We compute, for the various targets, the cross-sections around midrapidity for the Υ, as well as for Drell-Yan muon pairs with invariant mass larger than 6 GeV/c2. We parametrize these
cross-sections with the usual relation σA = σNAα, and determine the values αΥ and
αDY. We also determine the A-dependence of the ratio BµµσΥ/σDY, a quantity less
affected by systematical effects. Then, by combining the results for the different target nuclei, we obtain Bµµdσ/dycm|ycm=0, a quantity that can be compared with the results
of other experiments and with theoretical calculations. Finally, the dependences of hpTi and hp2Ti on A and√s are discussed.
2
Experimental setup and data analysis
The setup of the NA50 experiment has been described in detail in various publica-tions [26]. It is based on a muon spectrometer composed of a 5 meter long hadron absorber, an air-core toroidal magnet and various sets of MWPCs and scintillator
hodoscopes. The luminosity measurement is achieved by means of three argon ioni-sation chambers placed along the beam path. They have been calibrated at low beam intensity and their linearity has been checked up to 1010 p/s [27]. The intensity of
the 450 GeV proton beam delivered by the SPS was about 3·109 p/burst, with a 2.3 s
spill. The thickness of the targets ranged from 30 to 50% of an interaction length. In these conditions, the dimuon trigger rate was ∼103/burst, with a dead time smaller
than 5%. The efficiency ǫtrig of the dimuon trigger system has been measured during
data taking, using dedicated hardware, and ranges from 87 to 89% (see Table 1). About 50% of the triggered events contain a dimuon, which is reconstructed with the improved version of the reconstruction algorithm described in Refs. [11, 28]. The dimuon reconstruction efficiency, ǫµµ, is dominated by the efficiency of the MWPCs
and is determined by the reconstruction program. Its precise value, used as input to obtain the cross-sections, depends on the data taking conditions and ranges from 84 to 87% (see Table 1). Various quality cuts are applied, to remove parasitic off-target events. Furthermore, in order to discard dimuons produced at the edge of the acceptance of the spectrometer, the kinematical domain of the analysis is restricted to −0.5 < ycm < 0.5 in rapidity and to −0.5 < cos θCS < 0.5 in the Collins-Soper
polar angle of the muons [29]. We are finally left with about 1000 high mass events (mµµ > 6 GeV/c2) for each target.
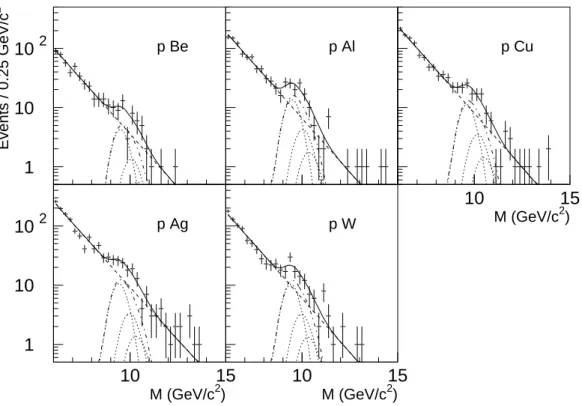
Figure 1 shows the five invariant mass spectra, in the region mµµ > 6 GeV/c2.
The Υ signal can be clearly seen on top of a continuum due to the Drell-Yan process. In this mass region the combinatorial background due to π and K decays, usually calculated through the measured like-sign dimuon sample, turns out to be negligible. Muon pairs originating from Drell-Yan and from the Υ resonances are estimated by means of a fit to the invariant mass spectrum. The mass shapes for the various processes have been calculated through a Monte-Carlo simulation. The Drell-Yan events have been generated using a LO QCD calculation, with the GRV94LO set of parton distribution functions [30]; the pT distributions have been tuned directly
on the data (see Section 3 for details) and, in the considered mass range, they do not significantly depend on the dimuon mass. The bottomonium states have been generated at their nominal PDG mass [31]. Due to the invariant mass resolution of the spectrometer, of the order of 0.4 GeV/c2 for dimuons with m
µµ ∼ 10 GeV/c2,
the various Υ states cannot be resolved. We have, therefore, relied on previous measurements to fix the relative contributions of the three states visible in the dimuon channel. We have used the values Υ(2S)/Υ(1S) = 0.32 and Υ(3S)/Υ(1S) = 0.13, as measured in p-A collisions at 400 GeV [14], i.e. close to our energy. The results of Ref. [14] are anyway compatible with a high statistics measurement performed at higher energy [21]. For the bottomonium pT distribution, we have adopted the
functional form dσ/dpT ∝ pT/ h 1 + (pT/p0)2 i6 , (1)
used in Ref. [21]. The p0 parameter has been fitted on the measured pT distributions
(see Section 3).
small statistics, our data do not allow a precise determination of the Υ y-distribution. As a first guess, we have used in the acceptance calculation a gaussian distribution, centered at ycm=0, with σy = 0.37 ± 0.01. This value comes from a fit to the xF
distribution for Υ production at 400 GeV (σy = 0.35 ± 0.01) [14, 19]. The obtained
value has then been logarithmically scaled to our incident energy. In Section 3 we will investigate in more detail the influence of the rapidity shape on our Υ results. Finally, the cos θCSdistributions for the Υ states have been generated according to the
recent results of the E866 Collaboration [24], which found a negligible polarization for the Υ(1S) around midrapidity and a large transverse polarization for the Υ(2S) and Υ(3S) states. The generated Drell-Yan and Υ events have then been tracked through the apparatus and the accepted events have been reconstructed using the procedure applied to the experimental data. With the choice of the generation parameters described above, the acceptances for the various dimuon sources turn out to be ADY =
21% (mµµ > 6 GeV/c2), AΥ(1S) = 25%, AΥ(2S) = 25%, AΥ(3S) = 26%. These
acceptances refer to the phase space domain D defined by the cuts −0.5 < ycm < 0.5
and −0.5 < cos θCS < 0.5. The error on the acceptances due to the uncertainty on
the rapidity distribution is less than 1 %.
Having calculated the shapes of the expected contributions, we fit each of the five invariant mass spectra with the function
dN+− dM = N DYdNDY dM +N Υ dNΥ(1S) dM + 0.32 · AΥ(2S) AΥ(1S) dNΥ(2S) dM + 0.13 · AΥ(3S) AΥ(1S) dNΥ(3S) dM ! (2) where NDY and NΥ are free parameters in the fit. To compensate for possible
approximations in the description of the setup and in the mapping of the magnetic field we leave the position of the Υ(1S) peak as a further free parameter in the fit. The mass differences mΥ(2S)− mΥ(1S) and mΥ(3S)− mΥ(1S) are anyway kept fixed to their
PDG values [31]. We find that the shift from the nominal mass of the bottomonium states does not exceed 1% and has negligible consequences (< 1%) on the estimated Υ yield.
The choice of the the fit region is dictated by the request of having a negligible contribution of the charmonia states. To satisfy this request, one could start the fit at mass values around 4.5 GeV/c2. However, due to the steep slope of the Drell-Yan
mass distributions, the use of a large fit window results in a loss of weight of the low-statistics Υ region. In this way, small inaccuracies in the Monte-Carlo description of the Drell-Yan might influence the estimate of the Υ yield. Pushing down to 4.5 GeV/c2 the starting point of the fit, the change in the calculated number of Drell-Yan
and Υ events is only 10% on average, but the χ2 of the fits are worsened by about 50%. Therefore, we have started our fits at mµµ = 6 GeV/c2. In this way, as can be
seen in Fig. 1, the measured invariant mass spectra are well reproduced, with values of χ2/ndf ranging from 0.9 to 1.5. The number of Υ mesons and the number of high
mass Drell-Yan pairs are reported in Table 1.
above, have been calculated through the formula σDi = Ni Ai · 1 L · ǫµµ· ǫtrig , (3)
where Ni is the number of detected events for each process i, L is the luminosity,
corrected for dead time, Ai is the acceptance, ǫµµ is the dimuon reconstruction
effi-ciency and ǫtrig is the efficiency of the dimuon trigger. For the Υ, we calculate the
cross-section integrated over the Υ(1S), Υ(2S) and Υ(3S) states. The values of the various quantities relevant for the determination of the cross-section are summarized in Table 1.
3
Results
In Fig. 2 we show, as a function of the mass number A, the Drell-Yan cross-sections divided by A. The points refer to the kinematical domain D, and to the mass range mµµ > 6 GeV/c2. The error bars shown in Fig. 2 represent the quadratic combination
of statistical and systematical errors. The systematical errors on the cross-section measurements are due to the errors on the determination of the incident proton flux and on the evaluation of ǫtrig and ǫµµ [11]. They range from 3.4 to 3.7% and are
comparable to the statistical errors. The quantity σDY/A corresponds to the
cross-section per nucleon-nucleon collision. In absence of final state interactions, and if nuclear effects on the PDFs are negligible, a flat behaviour is expected. By fitting the points with the function
σDYpA = σDYpp · AαDY
(4) we get αDY=0.98±0.02 (χ2/ndf = 3.1), a value compatible with 1. Alternatively,
imposing α=1 results in the line shown in Fig. 2, with χ2/ndf = 2.5. This result is
in fair agreement with previous observations by NA50 in a lower mass range [10, 11], showing that the Drell-Yan cross-section scales with the number of nucleon-nucleon collisions.
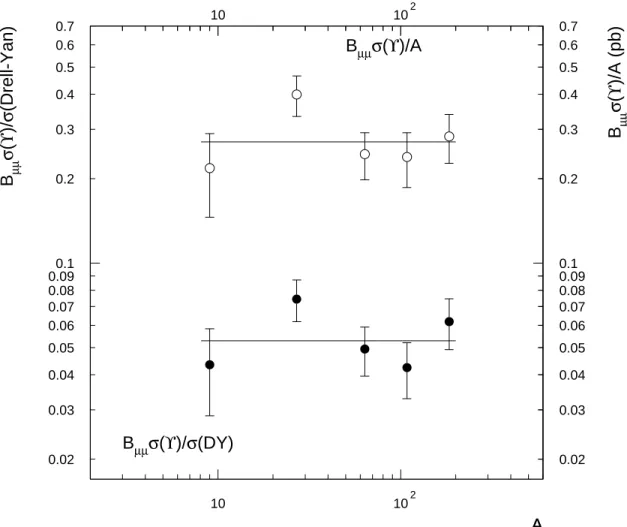
Figure 3 shows the A-dependence of bottomonium production, through the ratio BµµσΥ/σDY, where BµµσΥ refers to the sum of the 1S, 2S and 3S states, weighted
by their branching ratio into two muons. The quantity BµµσΥ/σDY is proportional
to the bottomonium cross-section per nucleon-nucleon collision. Being the ratio of two measured cross-sections it is less affected by systematical errors. In the same figure we show the quantity BµµσΥ/A as a function of A. Again, the plotted errors
represent a quadratic combination of statistical and systematical errors. The values of the various cross-sections and of their ratios is shown in Table 2.
The fits of the two sets of points to the usual Aα parameterization give α
Υ/DY =
0.98 ± 0.10 (χ2/ndf =1.7) and α
Υ = 0.98 ± 0.10 (χ2/ndf =1.7). Within the rather
large statistical errors, our result indicates that the Υ is not strongly absorbed in the nuclear medium. In particular, by imposing α = 1 (solid lines in Fig. 3), we
can describe the data with χ2/ndf = 1.3 for Υ/DY and for σ
Υ. We find that our
result is compatible with the only other direct determination of the A-dependence of Υ production, carried out by E772 [22] at 800 GeV incident energy.
Assuming αΥ = 1, as suggested by our data, we averaged the results on the
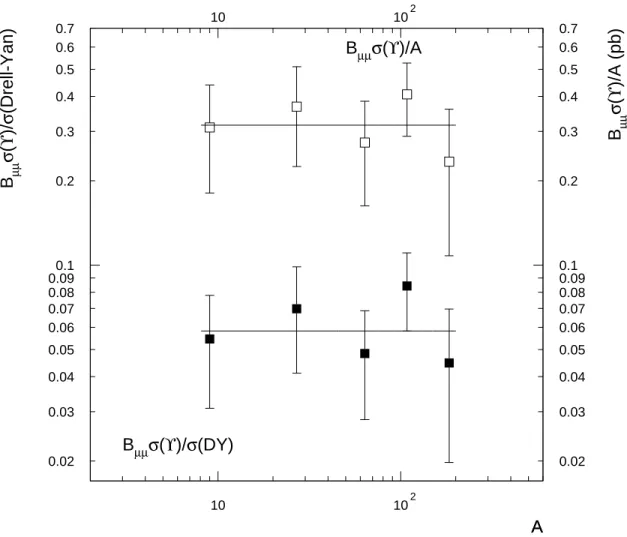
various targets and obtained for the Υ cross-section per nucleon-nucleon collision the value BµµσΥ = 0.27 ± 0.03 pb/nucleon. As a further check of possible systematic
effects, we also obtained the same quantity through the analysis of a different data sample, taken by NA50 [10] at a beam intensity about one order of magnitude lower and containing 72±12 Υ events. We get BµµσΥ = 0.32 ± 0.06 pb/nucleon. The two
values of σΥ agree within errors, indicating that the high-luminosity data analyzed
in this paper have been properly corrected for the various efficiency factors, whose evaluation is more delicate at high beam intensities. For completeness, we show in Fig. 4, as a function of A, BµµσΥ/σDY and BµµσΥ for the low beam intensity
sample. Performing a simultaneous fit of the data sets of Fig. 3 and 4, we get αΥ/DY = 0.98 ± 0.09 (χ2/ndf =0.9) and αΥ = 0.98 ± 0.08 (χ2/ndf =0.8).
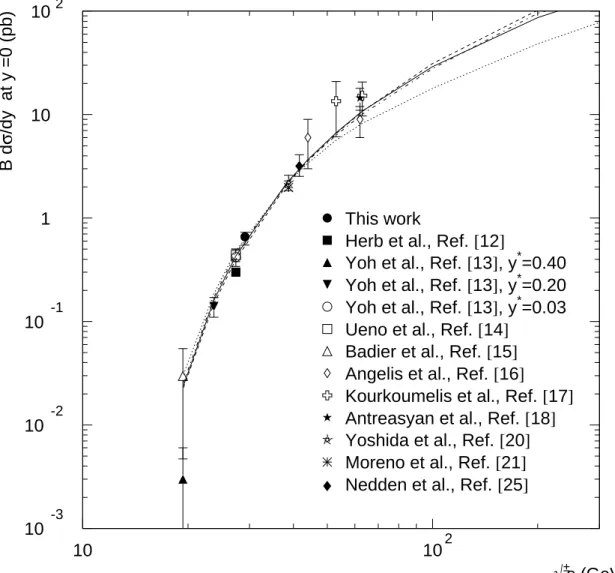
The Υ cross-section per nucleon-nucleon collision can be compared with previous measurements performed by various fixed-target experiments. However, past experi-ments usually quote the quantity Bµµdσ/dycm|ycm=0, and assumptions different from
ours have sometimes been adopted in the cross-section calculations. In particular, past experiments evaluated their acceptances assuming an unpolarized production of the Υ states. Furthermore, in some cases they applied a correction to take into account the Fermi-motion of the target nucleons. In order to properly compare our results with the ones available in the literature, we have first re-calculated our accep-tances assuming no polarization for all the three bottomonium states. With respect to the results shown in Fig. 3 and 4 we get a 1.5% decrease in the value of the cross-section. The influence of Fermi motion has been taken into account by applying to our results (and to the ones available in the literature not yet corrected) the correc-tion proposed in Ref. [13]. At our center of mass energy, √s = 29.1 GeV, the factor to apply to the results is 0.897.
Concerning the A-dependence, all the other experiments also assumed α=1. A further element in the calculation of the midrapidity cross-section is the rapidity shape assumed for the Υ production. In fact, due to the limited y-coverage of the NA50 setup, our result may be sensitive to the chosen rapidity shape. We find that the rapidity distribution of the Υ mesons in our sample is compatible with a gaussian having σΥ
y > 0.30 (95% c.l.). Indeed, it is even compatible with a flat
y-distribution. The value for Bµµdσ/dycm|ycm=0 varies by
+7%
−15% in these two extreme
cases, and we consider this uncertainty as a contribution to the systematical error in the determination of the mid-rapidity cross-section.
The obtained value is Bµµdσ/dy|ycm=0 = 0.65 ± 0.05
+0.04
−0.10 pb/nucleon, where the
quoted asymmetric error is due to the uncertainty on the Υ rapidity distribution as derived from our data. In Fig. 5 we present the√s-dependence of the Υ cross-section per nucleon-nucleon collision. The NA50 point follows the general trend defined by previously available results. We also plot in Fig. 5 the results of a NLO calculation
based on the Color Evaporation Model (CEM) [33]. The curves are obtained by fit-ting the data with various combinations of the CEM parameters, namely the mass of the b-quark, the renormalization/factorization scale and the choice of the PDF set. It can be seen that the√s dependence of the Υ cross-section is well reproduced. For the other model commonly used in the study of heavy quarkonia cross-sections, NRQCD, no up-to-date calculation exists in the literature. The only available prediction [34] gives a value of the order of 50 pb/nucleon for the total Υ cross-section at√s = 29.1 GeV. By integrating our differential cross-section over y and cos θCS, and correcting
for the branching ratios, we get σΥ
tot = 29±2+31−4 pb/nucleon. The asymmetric
system-atic error is dominated by the uncertainty in the rapidity distribution derived from our data. If we rely on the data from previous experiments for the determination of σΥ
y the systematic error is reduced to ±2 pb/nucleon.
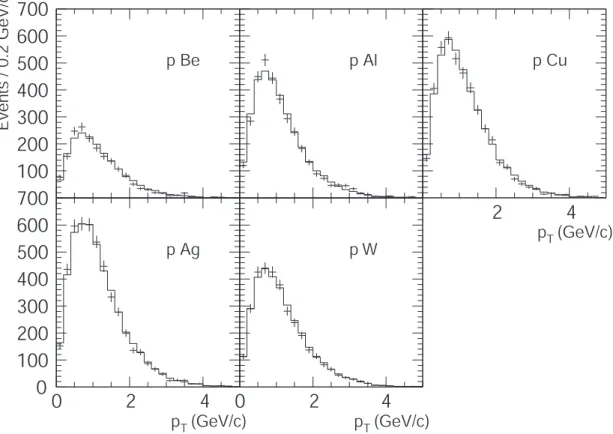
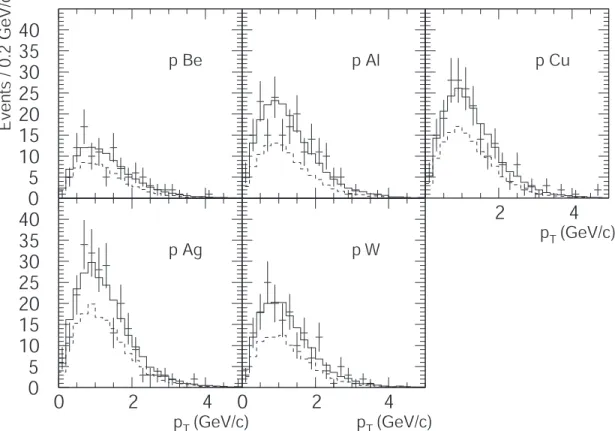
Finally, we have investigated the A-dependence of the dimuon transverse momen-tum distributions. In Figs. 6 and 7 we show, for the various systems, the pT spectra
observed in the mass intervals 4.5 < mµµ < 8 GeV/c2 and 8.6 < mµµ < 11.6
GeV/c2, respectively. In Fig. 6, the Drell-Yan p
T distributions, generated according
to Eq. 1 and filtered through the Monte-Carlo simulation of the detector, have been fitted to the data with p0 as a free parameter. In Fig. 7 the spectra have been fitted
with a superposition of Drell-Yan and Υ dimuons. For Drell-Yan (dashed lines) the normalizations have been obtained from the fit to the mass distributions of Fig. 1, while the shapes have been extrapolated from the pT spectra measured in the lower
mass range. The Υ events have been generated following Eq. 1, and p0 has been used
as a free parameter in the fits. As a result, we find that for the two mass intervals under study our fits nicely reproduce the observed pT distributions. In Table 3 we
summarize the p0 values obtained for the various systems, for both Drell-Yan and Υ.
The calculated hpTi and hp2Ti are also shown. To test the stability of our results on
the choice of the assumed Drell-Yan pT distributions, we have performed a similar
study, fitting our data to a PYTHIA calculation, performed with the GRV94LO set of parton distribution functions. The value of the intrinsic hk⊥i of partons inside
hadrons, used in PYTHIA, has a strong influence on the Drell-Yan pT distribution.
It has been tuned directly on the data, obtaining values ranging from 0.88 to 0.90 GeV/c. We find that the shape of the PYTHIA pT distribution still reproduces our
data, with a slightly worse χ2/ndf . The calculated hp
Ti differ by less than 3% (7%
for hp2
Ti) from the result obtained using Eq. 1.
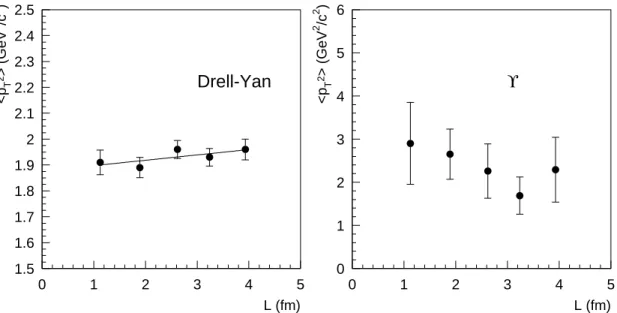
According to [35, 36], for heavy quarkonia and Drell-Yan production, initial state parton scattering is responsible for the increase of hp2
Ti observed in p-A collisions
with respect to pp. Such an increase is approximately linear as a function of L, the mean length of nuclear matter crossed by the incoming parton, and its size is smaller (by a factor 4/9) if the scattering process is initiated by a quark rather than by a gluon. In Ref. [32] it was shown that the transverse momentum distribution of the J/ψ mesons produced in p-A and A-A collisions can be fitted with the function hp2Ti = hp2Tipp+ agN · L, with agN = 0.077±0.002 (GeV/c)2fm−1. In Fig. 8 we show
the L-dependence of hp2
GeV/c2, where the initial hard parton is a quark rather than a gluon. A linear increase
of hp2
Ti with L is visible. By using the same kind of fit, we get aqN=0.021±0.019
(GeV/c)2fm−1, a value significantly lower than a
gN and, within the rather large errors,
in agreement with the expected 4/9 factor. For Υ production, where both qq and gg initial states contribute [34], we would expect for the hp2
Ti increase vs. L an
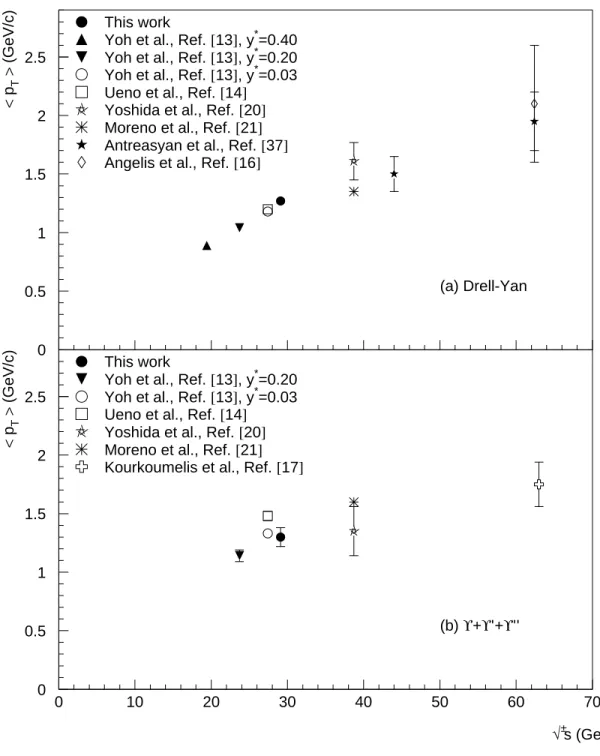
intermediate slope between the ones observed for Drell-Yan and J/ψ. Unfortunately, the available statistics (see Fig. 8) does not allow to draw quantitative conclusions. Finally, in Fig. 9 we compare, as a function of√s, the measured hpTi (averaged over
the various target nuclei) with the results of other experiments. For Drell-Yan, a clear increase of hpTi with √s is observed, while the effect is less important for the
Υ.
4
Conclusions
The NA50 experiment measured high-mass (mµµ > 6 GeV/c2) Drell-Yan dimuons
and, for the first time, Υ production in p-A collisions at√s = 29.1 GeV. By fitting the cross-section results with the usual Aα parameterization, we get α
DY = 0.98 ± 0.02
and αΥ = 0.98 ± 0.08. Within the rather large experimental errors, this result
indi-cates the absence of strong absorption effects for the bottomonium states in nuclear matter. The measured cross-section at mid-rapidity is in good agreement with the results of other experiments in the fixed target energy range and with the available theoretical calculations. The A-dependence of hp2
Ti indicates, for Drell-Yan
produc-tion, an effect compatible with quark scattering in the initial state.
References
[1] N. Brambilla et al., Quarkonium Working Group Yellow Report, hep-ph/0412158.
[2] V. Barger, W.Y. Keung and R.N. Philips, Z. Phys. C6 (1980) 169; Phys. Lett. B91(1980) 253.
[3] G.T. Bodwin, E. Braaten and G.P. Lepage, Phys. Rev. D51 (1995) 1125. [4] V.B. Kopeliovich, A.V. Tarasov and J. H¨ufner, Nucl. Phys. A696 (2001) 669. [5] F. Arleo, P.B. Gossiaux, T. Gousset and J. Aichelin, Phys. Rev. C61 (2000)
054906.
[6] R. Vogt, Phys. Rev. C61 (2000) 035203.
[7] T. Matsui and H. Satz, Phys. Lett. B178 (1986) 416.
[8] M.C. Abreu et al., NA50 Collaboration, Phys. Lett. B477 (2000) 28. [9] B. Alessandro et al., NA50 Collaboration Eur. Phys. J. C39 (2005) 335.
[10] B. Alessandro et al., NA50 Collaboration, Phys. Lett. B553 (2003) 167. [11] B. Alessandro et al., NA50 Collaboration, Eur. Phys. J. C33 (2004) 31. [12] S.W. Herb et al., Phys. Rev. Lett. 39 (1977) 252.
[13] J.K. Yoh et al., Phys. Rev. Lett. 41 (1978) 684. [14] K. Ueno et al., Phys. Rev. Lett. 42 (1979) 486. [15] J. Badier et al., Phys. Lett. B86 (1979) 98. [16] A.L.S. Angelis et al., Phys. Lett. B87 (1979) 398. [17] C. Kourkoumelis et al., Phys. Lett. B91 (1980) 481. [18] D. Antreasyan et al., Phys. Rev. Lett. 45 (1980) 863. [19] S. Childress et al., Phys. Rev. Lett. 55 (1985) 1962. [20] T. Yoshida et al., Phys. Rev. D39 (1989) 3516. [21] G. Moreno et al., Phys. Rev. D43 (1991) 2815. [22] D.M. Alde et al., Phys. Rev. Lett. 66 (1991) 2285. [23] T. Alexopoulos et al., Phys. Lett. B374 (1996) 271.
[24] C.N. Brown et al., E866 Collaboration, Phys. Rev. Lett. 86 (2001) 2529. [25] M. Nedden et al., HERA-B Collaboration, hep-ex/0406042.
[26] M.C. Abreu et al., NA50 Collaboration, Phys. Lett. B410 (1997) 327. [27] M.C. Abreu et al., NA38 Collaboration, Phys. Lett. B444 (1998) 516. [28] R. Shahoyan, PhD Thesis, Universidade T´ecnica de Lisboa, 2001. [29] J.C. Collins and D.E. Soper, Phys. Rev. D16 (1977) 2219.
[30] M. Gl¨uck, E. Reya and A. Vogt, Z. Phys. C67 (1995) 433.
[31] S. Eidelman et al., Particle Data Group, Phys. Lett. B592 (2004) 1.
[32] N.S. Topilskaya et al., NA50 Collaboration, Nucl. Phys. A715 (2003) 675c. [33] R. Vogt, Phys. Rep. 310 (1999) 197; Heavy Ion Phys. 18 (2003) 11.
[34] M. Beneke and I.Z. Rothstein, Phys. Rev. D54 (1996) 2005.
[35] J. H¨ufner, Y. Kurihara and H.J. Pirner, Phys. Lett. B215 (1988) 218. [36] J.P. Blaizot and J.Y. Ollitrault, Phys. Lett. B217 (1989) 392.
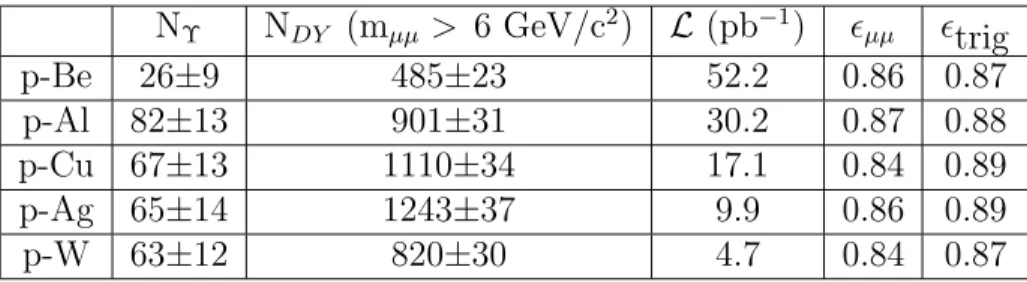
NΥ NDY (mµµ > 6 GeV/c2) L (pb−1) ǫµµ ǫtrig p-Be 26±9 485±23 52.2 0.86 0.87 p-Al 82±13 901±31 30.2 0.87 0.88 p-Cu 67±13 1110±34 17.1 0.84 0.89 p-Ag 65±14 1243±37 9.9 0.86 0.89 p-W 63±12 820±30 4.7 0.84 0.87
Table 1: Quantities used in the cross-section calculation.
σDY/A (pb) BµµσΥ/A (pb) BµµσΥ/σDY p-Be 5.01±0.24±0.18 0.218±0.072±0.008 0.044±0.015 p-Al 5.36±0.19±0.25 0.399±0.063±0.019 0.075±0.012 p-Cu 4.95±0.15±0.19 0.245±0.046±0.009 0.049±0.010 p-Ag 5.61±0.17±0.19 0.239±0.052±0.008 0.043±0.009 p-W 4.57±0.17±0.17 0.283±0.055±0.010 0.062±0.013
Table 2: Drell-Yan (for the mass region mµµ > 6 GeV/c2) and bottomonium
cross-sections, and their ratio. The first error is statistical, the second systematical. The quoted systematical errors cancel out in the ratio BµµσΥ/σDY.
p0 (DY) p0 (Υ) hpTi (DY) hpTi (Υ) hp2Ti (DY) hp2Ti (Υ)
(GeV/c) (GeV/c) (GeV/c) (GeV/c) (GeV/c)2 (GeV/c)2
p-Be 2.77±0.04 3.4±0.6 1.19±0.03 1.5±0.2 1.91±0.05 2.9±1.0 p-Al 2.75±0.03 3.3±0.4 1.18±0.01 1.4±0.2 1.89±0.04 2.7±0.6 p-Cu 2.80±0.02 3.0±0.4 1.20±0.01 1.3±0.2 1.96±0.04 2.3±0.7 p-Ag 2.78±0.02 2.6±0.3 1.19±0.01 1.1±0.1 1.93±0.03 1.7±0.4 p-W 2.80±0.03 3.0±0.4 1.20±0.01 1.3±0.2 1.96±0.04 2.3±0.7 Table 3: p0 (see Eq. 1), hpTi and hp2Ti for Drell-Yan (4.5 < mµµ < 8.0 GeV/c2) and
Υ. The quoted errors for Drell-Yan are purely statistical, while the values for the Υ include a systematical error due to the uncertainty in the extrapolation of the Drell-Yan yield into the Υ region. The total error is anyway dominated by the statistical contribution, due to the low Υ statistics.
1 10 102 10 15 1 10 102 10 15 p Be Events / 0.25 GeV/c 2 p Al p Cu M (GeV/c2) p Ag M (GeV/c2) p W M (GeV/c2) 10 15
Figure 1: The five p-A opposite-sign muon pair mass spectra, in the mass range mµµ > 6 GeV/c2. The solid line is the result of the fit with the function described
in Eq. 2. The dashed line represents the Drell-Yan process, the dotted lines the contributions of the various bottomonium states, the dot-dashed line the sum of the three Υ states.
A
σ
(Drell-Yan)/A (pb)
0
1
2
3
4
5
6
7
10
10
2Figure 2: The Drell-Yan cross-section, relative to the mass region mµµ > 6 GeV/c2,
divided by the mass number A. The line represents the result of a fit to the points, according to the function σDYpA = σDYpp · A.
0.02 0.03 0.04 0.05 0.06 0.07 0.08 0.09 0.1 0.2 0.3 0.4 0.5 0.6 0.7 10 102 A B µµ σ ( ϒ )/ σ (Drell-Yan) A B µµ σ ( ϒ )/A (pb) Bµµσ(ϒ)/σ(DY) Bµµσ(ϒ)/A 0.02 0.03 0.04 0.05 0.06 0.07 0.08 0.09 0.1 0.2 0.3 0.4 0.5 0.6 0.7 10 102
Figure 3: The ratio BµµσΥ/σDY (closed circles) and the cross-section per
0.02 0.03 0.04 0.05 0.06 0.07 0.08 0.09 0.1 0.2 0.3 0.4 0.5 0.6 0.7 10 102 A B µµ σ ( ϒ )/ σ (Drell-Yan) A B µµ σ ( ϒ )/A (pb) Bµµσ(ϒ)/σ(DY) Bµµσ(ϒ)/A 0.02 0.03 0.04 0.05 0.06 0.07 0.08 0.09 0.1 0.2 0.3 0.4 0.5 0.6 0.7 10 102
Figure 4: The ratio BµµσΥ/σDY (closed squares) and the cross-section per nucleon
√– s (GeV) B d σ /dy * at y * =0 (pb) This work
Herb et al., Ref. [12]
Yoh et al., Ref. [13], y*=0.40 Yoh et al., Ref. [13], y*=0.20 Yoh et al., Ref. [13], y*=0.03 Ueno et al., Ref. [14]
Badier et al., Ref. [15] Angelis et al., Ref. [16] Kourkoumelis et al., Ref. [17] Antreasyan et al., Ref. [18] Yoshida et al., Ref. [20] Moreno et al., Ref. [21] ♦
Nedden et al., Ref. [25] ♦ 10 -3 10 -2 10 -1 1 10 102 10 102
Figure 5: Υ cross-section at midrapidity as a function of√s. The lines represent the results of NLO CEM calculations [33]. The solid, dashed and dot-dashed lines are obtained with the MRST HO PDF set with, respectively, mb = µ = 4.75 GeV/c2,
mb = µ/2 = 4.5 GeV/c2, and mb = 2µ = 5 GeV/c2. The dotted line is obtained
with the GRV HO PDF set with mb = µ = 4.75 GeV/c2. It is assumed that
100
200
300
400
500
600
700
2
4
0
100
200
300
400
500
600
700
0
2
4
p Be Events / 0.2 GeV/c p Al p Cu pT (GeV/c) p Ag pT (GeV/c) p W pT (GeV/c)0
2
4
Figure 6: The measured p-A opposite-sign dimuon pT spectra in the invariant mass
region 4.5 < mµµ < 8.0 GeV/c2. The lines represent the best fit to the data obtained
0
5
10
15
20
25
30
35
40
2
4
0
5
10
15
20
25
30
35
40
0
2
4
p Be Events / 0.2 GeV/c p Al p Cu pT (GeV/c) p Ag pT (GeV/c) p W pT (GeV/c)0
2
4
Figure 7: The measured p-A opposite-sign dimuon pT spectra in the invariant mass
region 8.6 < mµµ < 11.6 GeV/c2. The dashed lines represent the contribution of the
Drell-Yan process, the solid lines the sum of the Υ and Drell-Yan yields (see text for details).
1.5 1.6 1.7 1.8 1.9 2 2.1 2.2 2.3 2.4 2.5 0 1 2 3 4 5 L (fm) <p T 2> (GeV 2 /c 2 ) Drell-Yan L (fm) <p T 2> (GeV 2 /c 2 ) ϒ 0 1 2 3 4 5 6 0 1 2 3 4 5
Figure 8: The L-dependence of the average transverse momentum squared for Drell-Yan dimuons in the mass range 4.5 < mµµ < 8 GeV/c2 (left plot) and for Υ (right
0 0.5 1 1.5 2 2.5 < pT > (GeV/c) (a) Drell-Yan This work
Yoh et al., Ref. [13], y*=0.40
Yoh et al., Ref. [13], y*=0.20
Yoh et al., Ref. [13], y*=0.03
Ueno et al., Ref. [14]
Yoshida et al., Ref. [20]
Moreno et al., Ref. [21]
Antreasyan et al., Ref. [37]
Angelis et al., Ref. [16]
This work
Yoh et al., Ref. [13], y*=0.20
Yoh et al., Ref. [13], y*=0.03
Ueno et al., Ref. [14]
Yoshida et al., Ref. [20]
Moreno et al., Ref. [21]
Kourkoumelis et al., Ref. [17]
√– s (GeV) < pT > (GeV/c) (b) ϒ+ϒ’+ϒ’’ 0 0.5 1 1.5 2 2.5 0 10 20 30 40 50 60 70
Figure 9: The average transverse momentum for Drell-Yan (a) and Υ (b) produc-tion as a funcproduc-tion of √s. For Drell-Yan, the points correspond to m ∼ 0.22 ·√s (corresponding to √τ = m/√s ∼ 0.22).