HAL Id: halsde-00192997
https://hal.archives-ouvertes.fr/halsde-00192997
Submitted on 30 Nov 2007
HAL is a multi-disciplinary open access
archive for the deposit and dissemination of sci-entific research documents, whether they are pub-lished or not. The documents may come from
L’archive ouverte pluridisciplinaire HAL, est destinée au dépôt et à la diffusion de documents scientifiques de niveau recherche, publiés ou non, émanant des établissements d’enseignement et de
Comparison of Bayesian and maximum likelihood
bootstrap measures of phylogenetic reliability.
Christophe J Douady, Frédéric Delsuc, Yan Boucher, W Ford Doolittle,
Emmanuel Douzery
To cite this version:
Christophe J Douady, Frédéric Delsuc, Yan Boucher, W Ford Doolittle, Emmanuel Douzery. Compar-ison of Bayesian and maximum likelihood bootstrap measures of phylogenetic reliability.. Molecular Biology and Evolution, Oxford University Press (OUP), 2003, 20 (2), pp.248-54. �halsde-00192997�
Letter to the Editor, intended for Molecular Biology and Evolution Manuscript number: 2925
Comparison of Bayesian and Maximum Likelihood Bootstrap
Measures of Phylogenetic Reliability
Christophe J. Douady,* Frédéric Delsuc,† Yan Boucher,* W. Ford Doolittle,* and Emmanuel J. P. Douzery†
* Department of Biochemistry and Molecular Biology, Dalhousie University, Halifax, Nova Scotia, B3H 4H7, Canada
† Laboratoire de Paléontologie, Paléobiologie et Phylogénie, Institut des Sciences de l’Evolution, Université Montpellier II, Montpellier, France
Author for correspondence and reprints: Christophe J. Douady: E-mail: [email protected]
Testing evolutionary hypotheses in a phylogenetic context becomes more reliable as reconstruction methods based on more realistic models of molecular evolution are available. However, computing time burden limits the application of model-based methods such as Maximum Likelihood (ML)when many taxa and/or assessment of reliability via standard—non parametric—bootstrap methods are involved (Felsenstein 1985). Time savings thus account in part for the increasing popularity of Bayesian inference methods (e.g., Karol et al. 2001; Lutzoni, Pagel and Reeb 2001; Murphy et al. 2001), as implemented in programs like MrBayes (Huelsenbeck and Ronquist 2001). These methods promise computational tractability with large data sets and complex evolutionary models (Larget and Simon 1999; Huelsenbeck et al. 2001).
Bayesian inference of phylogeny combines the prior probability of a phylogeny with the tree likelihood to produce a posterior probability distribution on trees
(Huelsenbeck et al. 2001). The best estimate of the phylogeny can be selected as the tree with the highest posterior probability, i.e. the MAximum Posterior probability (MAP) tree (Rannala and Yang 1996). Topologies and branch lengths are not treated as parameters—as in ML methods (Felsenstein 1981)—but as random variables. Because posterior probabilities cannot be obtained analytically, they are approximated by numerical methods known as Markov chain Monte Carlo (MCMC) or Metropolis coupled MCMC (MCMCMC). These chains are designed to explore the posterior
probability surface by integration over the space of model parameters. Trees are sampled at fixed intervals and the posterior probability of a given tree is approximated by the proportion of time that the chains visited it (Yang and Rannala 1997). A consensus tree can be obtained from these sampled trees, and Bayesian posterior probabilities of
individual clades (PP), as expressed by the consensus indices, may be viewed as clade credibility values. Thus, Bayesian analysis of the initial matrix of taxa and characters produces both a MAP tree and estimates of uncertainty of its nodes, directly assessing substitution model, branch length and topological variables, as well as clade reliability values, all in a reasonable computation time.
Reliability of nodes in phylogenetic trees is classically evaluated in two ways. First, from the initial matrix of characters, a strength of grouping value is measured, i.e. the least decrease in log-likelihood associated with the breaking of the clade defined by that node (e.g. Meireles et al. 1999). The statistical significance of this decrease can be estimated with non-parametric or parametric tests (Goldman, Anderson and Rodrigo 2000). With Bayesian methods, reliability of MAP tree nodes derives directly from corresponding posterior probabilities. In the second way, the initial character matrix is redrawn with replacement, and bootstrap percentages (BP) are calculated, for example under the ML criterion (BPML), and interpreted as a measure of experiment repeatability
(Felsenstein 1985) or phylogenetic accuracy (Felsenstein and Kishino 1993). The Bayesian approach is presumed to perform roughly as bootstrapped ML (Huelsenbeck et al. 2001) but runs much faster (Larget and Simon 1999; Huelsenbeck et al. 2001). Recent analyses have aimed at comparing Bayesian and ML supports by studying the correlation between posterior probabilities (PP) and bootstrap percentages (BPML) (Leaché and Reeder 2002; Whittingham et al. 2002). A compilation of literature
values (Karol et al. 2001; Murphy et al. 2001; Buckley et al. 2002; Leaché and Reeder 2002; Whittingham et al. 2002; Wilcox et al. in press) reveals that plotting PP as a function of BPML can show significant correlation (P-values < 0.02), but that the strength
of this correlation is highly variable and sometime very low (correlation coefficient r2 between 0.29 and 0.99, median at 0.71). Moreover, the slope (S) of the regression line (S between 0.29 and 1.08, median at 0.79) indicates that BPML are generally lower than PP.
This trend has already been noticed by Rannala and Yang (1996) in their pioneering work where PP appeared systematically higher than resampling estimated log-likelihood (RELL) bootstrap support values.
As more phylogenetic results relying strictly on Bayesian analyses are published (Arkhipova and Morrison 2001; Henze et al. 2001; Lutzoni, Pagel and Reeb 2001), a better understanding of the relation between PP and BPML becomes essential. In a work to
be published, Wilcox et al. explored this relation by performing simulations on their original data set. They conclude that, under the condition of their study, PP and BP are both overconservative measures of phylogenetic accuracy, but that Bayesian support values provide closer estimates of the true probabilities of recovering clades. Thus they advocate the preferential use of PP rather than BP (Wilcox et al. in press). However, cases where conflicting hypotheses are supported by high posterior probabilities have been reported (Buckley et al. 2002; Douady et al., in press). This suggests that at least in certain cases PP put overconfidence on a given phylogenetic hypothesis and drawing conclusions from this sole measure of support might be misleading.
To better understand the relationship between PP and BP, we applied standard bootstrap resampling procedures to the Bayesian approach, studying the correlation between PP, BPML, and BPBay—i.e. posterior probabilities estimated after bootstrapping
of the data—for eight empirical data sets spanning different kind of characters, types of sequences, genomic compartments, and taxonomic groups. Even when the correlation
between PP and BPML was weak (r2< 0.52), it became very strong (r2> 0.96) when
Bayesian posterior probabilities are computed on bootstrapped data matrices. Moreover, albeit less clearly, simulation seems to confirm this trend. These simulations also tend to predict that PP overcome BP support for both true and false nodes. We discuss the effect of the bootstrapped approach in the case of apparent conflicts between data sets, and consider its practical implications for measuring phylogenetic reliability.
Eight highly diverse empirical data sets were chosen (see details in
Supplementary Material at MBE web site: http://www.molbiolevol.org), including two pairs showing conflict (i.e., PP strongly supporting mutually exclusive nodes):
mitochondrial versus nuclear markers for 14 cicadas (Buckley et al. 2002), and mitochondrial rRNA markers for either 21 or 23 sharks (Douady et al. in press). The model of sequence evolution that best fits each DNA data set and the corresponding GTR substitution rate parameters, shape of the four-categories gamma distribution (Γ4) and
fraction of invariable sites (INV) were estimated by Modeltest 3.06 (Posada and Crandall 1998), and then used in PAUP* 4b10 (Swofford 2002) to compute ML bootstrap
percentages (BPML) after 100 pseudo-replications with NJ starting trees and TBR branch
swapping. For the HMGR amino acid data set, BPML were obtained using PROML version
3.6a2.1 of the PHYLIP package (Felsenstein 2001) with a JTT substitution matrix provided
by E. Tillier (pers. comm.) combined to a Γ4 + INV model, and parameters optimized by
PUZZLE 4.0.2 (Strimmer and von Haeseler 1996). Bayesian posterior probabilities (PP)
were computed under the same ML models with MrBayes 2.01 (Huelsenbeck and Ronquist 2001) by running four chains for 100,000 MCMCMC generations using the program default priors on model parameters. For bootstrapped Bayesian analyses we
generated 100 bootstrap pseudo-replicates for each data set using the program SEQBOOT
3.6a2.1 (Felsenstein 2001), and estimated Bayesian posterior probabilities as previously described for each pseudo-replicate. For all analyses, 1,000 trees were sampled from the posterior probability distribution (one every 100 generations) and a conservative 50% of the trees (500) was systematically discarded as “burn-in” to ensure that the chains have reached stationarity. Bayesian bootstrap percentages (BPBay) were computed for each
node into three ways: i) the consensus of the 500 x 100 = 50,000 trees generated from the 100 bootstrapped pseudo-replicates, ii) the average of each nodes PP for the 100 MAP trees, and iii) the consensus of the 100 MAP trees (“consensus of consensus”). Given the tedious aspect of preparing files for bootstrapped Bayesian analyses, a Perl script was custom-made and is available upon request.
We also explored the relation between PP and BP using a simulation design. Monte Carlo simulation of 100 data sets of 1,000 characters for seven taxa each was performed using SEQ-GEN 1.2.5 (Rambaut and Grassly 1997), under a model topology
and associated branch lengths taken from the armadillo subset of VWF xenarthran data (Supplementary Material). The K2P model of nucleotide substitution (Kimura, 1980) was chosen with a transition : transversion ratio of 2.00 and a Γ8 distribution with α = 1.00.
BPML and PP supports were obtained for these 100 simulated data sets following the same
procedure as described above. For computing time reasons, i.e. running 2,500 times MrBayes, BPBay were only computed for the 25 data sets showing the greatest contrast
between BPML and PP.
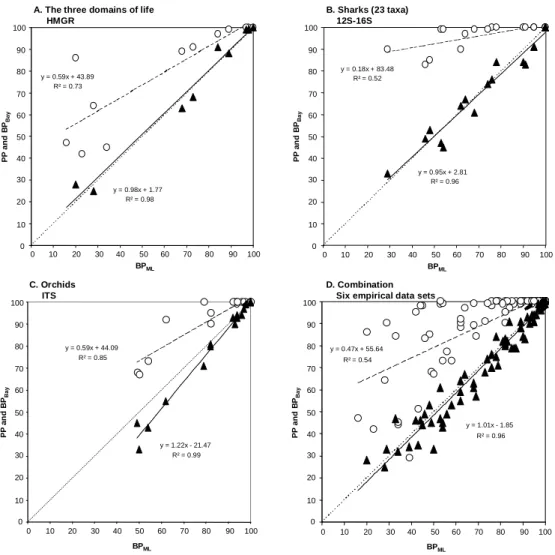
For all eight data sets the scatter plots of PP and BPBay versus BPML were very
flattened slope (S column in Supplementary Material: 0.18-0.93) while BPBay vs. BPML
have very little unexplained variation, slopes of correlation lines appearing much steeper and being always very close to 1 (0.93-1.22). Figure 1 illustrates this trend for three individual data sets showing that the results are independent of the nature of the data analyzed: nucleotide versus amino acid characters, nuclear versus mitochondrial
compartments, protein coding versus non-coding markers and different taxonomic groups and levels (Fig. 1A-C). Because empirical observations suffer from the difficulty of drawing general conclusions from a limited number of observations, we combined the six strictly independent data sets and confirmed our observations (Fig. 1D; Supplementary Material). Therefore, we are confident that, in empirical data sets, PP and BPML will
prove only moderately correlated (r2= 0.27-0.93; S = 0.18-0.93; P-values < 0.02), whereas the BPBay and BPML are strongly correlated (r2= 0.95-0.99; S = 0.93-1.22;
P-values < 10-6).
Such a correlation between BPML and BPBay seems expectable since the use of
uniform priors in the Bayesian analyses involves that the posterior probability density is strongly dependent upon the likelihood function. However, this correlation is not trivial either because the ML and the MAP trees obtained from each bootstrap pseudo-replicate are not always identical. For example, in the case of the 21-shark and xenarthran data sets, ML and MAP trees are different in 38% and 27% of the replicates, respectively. Therefore, the very high quality correlation between BPBay and BPML (r2>0.95) cannot be
expected a priori.We also tested several of the assumptions leading to the strong correlation between BPBay and BPML. First, the possibility that the quality of the
runs seems to be discarded by the minimal PP variance observed on MCMCMC repeatability plots (Huelsenbeck et al. 2001). It is thus unlikely that the low correlation between PP and BPML reflects a problem of repeatability between independent runs.
Second, we a priori removed 50% of the sampled trees as MCMCMC “burn-in”. This was done to ensure that all trees sampled before stationarity were discarded, without actually checking Bayesian results of each individual bootstrap pseudo-replicate. To check for potential biases at this stage, we recomputed BPBay, keeping 90% of all
sampled trees (i.e., removing 100 instead of 500 trees for each pseudo-replicate). Results indicate that bias is quite unlikely as the level of BPBay variation is very low (e.g., 1% for
the ITS data set). Therefore, “burn-in” threshold seems to be of modest importance as long as it is kept realistic, probably because of the rapid convergence towards stationarity of our data. Third, we looked at the effect of making an overall consensus (i.e., consensus of all 50,000 trees sampled over all 100 pseudo-replicates and after a 50% burn-in) versus making the consensus of the 100 MAP trees or the average of the PP. Compilation of node supports—for example for both ITS and Buckley et al. (2002) nuclear data sets— yields high correlations (r2> 0.95) between BPML and BPBay, "PP average" or "MAP trees
consensus". However, it seems that BPBay and "PP average" are closer to Bayesian
philosophy whereas "MAP tree consensus" values are closer to the ML bootstrap approach. Indeed, in the two first cases, the complete collection of trees is considered while in the last case a single optimal tree is kept to represent each pseudo-replicate. Given the likely loss of information during the consensus iteration, it seems that using an overall consensus was a better option.
Non-parametric bootstrapping may be an over-conservative estimator of node reliability (Hillis and Bull 1993; Wilcox et al. in press; but see Felsenstein and Kishino 1993; Efron, Halloran and Holmes 1996). However, it remains the most commonly used way to characterize it. From the statistical point of view, posterior probabilities have the advantage of straightforwardness but, as we just showed, they are not tightly correlated with ML bootstrap percentages. These estimators seem rather different, as PP needs to be calculated on bootstrapped data to behave like BPML supports. Recently, Wilcox et al. (in
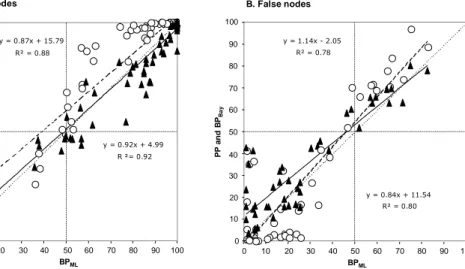
press), based on a simulation study, conclude that PP and BP are both over-conservative measures of node support, but that PP provided closer estimates of the true probabilities of recovering clades. Results from our simulations seem to confirm the fact that PP is less conservative than BP. Indeed, when considering true nodes—those that were present in the model topology—PP are generally higher than BPML and BPBay (Fig. 2A: upper right
quarter). However, PP is also higher when looking at strong support for false nodes— those that were absent of the model tree (Fig. 2B: upper right quarter). Below 50% of PP and BP (Fig. 2B: lower left quarter), i.e. for values that are usually not interpreted for phylogenetic inference, there is a large dispersion of points with a trend of low BP to overestimate accuracy as noted by Hillis and Bull (1993). As a whole these simulation results imply that, at least in certain cases, high PP falsely interpret signal and may end up strongly supporting incorrect phylogenetic relationships. Thus, the more conservative BPML and BPBay seem less subject to the behavior of strongly supporting a node when it
is actually false.
Furthermore, the existence of strong conflicts in empirical data using Bayesian inference seems to argue that this approach may be sensitive to small model
misspecifications as theoretically anticipated by Waddell, Kishino and Ota (2001) and subsequently shown by Buckley et al. (2002) and Buckley (2002). Bayesian analyses on bootstrapped data were able to eliminate apparent conflicts. Two nodes opposed by PP = 0.93/0.94 (Rhodopsalta sister to either Maoricicada or Kikihia depending on the choice of mitochondrial or nuclear markers: Buckley et al. 2002) and 0.98/0.99 (relative position of Hexanchiformes in sharks’ inter-ordinal tree depending on the choice of the outgroup: Douady et al. in press) respectively, then received BPBay = 59/65 and 57/47 after
bootstrap resampling. Evidently, certain conflicts diagnosed by PP could be biologically explained by differences between gene trees and species trees introduced by horizontal transfer, lineage sorting, and gene duplication and extinction (review in Maddison 1997). In particular, hybridization between taxa might alternatively account for the conflict observed between mitochondrial and nuclear genes in Cicadas. However, in the case of sharks, the conflict arose when taxa are added to the outgroup (for the same gene). It appears more than likely that this spurious conflict was the result of the overestimation of node support based on PP and that conclusions based solely on this estimator would have been positively misleading.
Drawing general conclusions from empirical studies could be problematic because we do not know how representative our example data sets are of phylogenetic problems. However, using “real” data sets does have the advantage of avoiding the simplifying assumptions inherent in simulating DNA data under a given model (Buckley 2002; Buckley and Cunningham 2002). Furthermore, in our case analyses based on both empirical and simulated data seem to corroborate each other in suggesting that, being more conservative, BPML and BPBay might be less prone to strongly supporting a false
phylogenetic hypothesis, thus reinforcing concerns regarding PP sensitivity to model misspecifications.
Nevertheless, Bayesian inference (with or without bootstrap) remains a very efficient way to simultaneously estimate substitution model parameters, branch lengths and topology under complex models of evolutionary change (Huelsenbeck 2002). If we take our shark 12S-16S data set with 23 taxa as an example, a regular PP (or one BPBay
replicate) requires roughly 1.5 hour of computing time on a Pentium 4 running at 1.80 GHz, against 120 hours for a single replicate of BPML with simultaneous estimation of all
parameters. Bayesian search on bootstrap data is much faster than ML if the user wants parameters to be estimated as the search goes, and gives very similar results. However, in the wide majority of cases, a ML (or BPML) search with simultaneous estimation of the
parameters is not necessary and a priori approximations allow the identification of the optimal trees and bootstrap supports. The Bayesian approach also provides a unique way to analyze amino acid data with simultaneous parameters estimation (in popular
phylogenetic packages such as PAUP or PHYLIP this option is only available for DNA). Both PP and Bootstrap supports are of great interest to phylogeny as potential upper and lower bound of node support accuracy, but they are surely not interchangeable and cannot be directly compared. In that context, users may prefer computing PP and BPBay or BPML
to better explore the range of node support estimates, especially when potential conflicts between data sets are explored.
Acknowledgments
Chris Simon and Thomas R. Buckley kindly made their Cicada data sets
available. David M. Hillis and Thomas P. Wilcox provided precious enlightenment about their simulations on the Snake data set. We are grateful to Alistair G. B. Simpson, the Associate Editor Mark A. Ragan, and two anonymous reviewers for insightful comments. This work was supported by a grant from the Canadian Institute for Health Research (MOP-42470), a Killam Postdoctoral Fellowship to CJD, a doctoral MENRT grant (contract 99075) to FD, a doctoral research award from the Canadian Institutes of Health Research to YB, and by the TMR Network "Mammalian phylogeny" (contract FMRX – CT98 – 022) of the European Community, the "Génopole Montpellier Languedoc-Roussillon", and the "Action Bioinformatique" of the CNRS to EJPD. This is the contribution ISEM 2002-BBB of the Institut des Sciences de l’Evolution de Montpellier (UMR 5554 - CNRS).
LITERATURE CITED
ARKHIPOVA, I. R., andH. G. MORRISON. 2001. Three retrotransposon families in the
genome of Giardia lamblia: two telomeric, one dead. Proc. Natl. Acad. Sci. U S A 98: 14497-502.
BOUCHER, Y., H. HUBER, S. L'HARIDON, K. O. STETTER, andW. F. DOOLITTLE. 2001. Bacterial origin for the isoprenoid biosynthesis enzyme HMG-CoA reductase of the archaeal orders Thermoplasmatales and Archaeoglobales. Mol. Biol. Evol. 18: 1378- 88.
BUCKLEY, T. R. 2002. Model misspecification and probabilistic tests of topology:
evidence from empirical data sets. Syst. Biol. 51: 509-523.
BUCKLEY, T. R., andC. W. CUNNINGHAM. 2002. The effect of nucleotide substitution
model assumptions on estimates of nonparametric bootstrap support. Mol. Biol. Evol. 19: 394-405.
BUCKLEY, T. R., P. ARENSBURGER, C. SIMON, andG. K. CHAMBERS. 2002. Combined
data, Bayesian phylogenetics, and the origin of the New Zealand cicada genera. Syst. Biol. 51: 4-18.
DELSUC, F., M. SCALLY, O. MADSEN, M. J. STANHOPE, W. W. DE JONG, F. M.
CATZEFLIS, M. S. SPRINGER, andE. J. P. DOUZERY. In press. Molecular phylogeny
of living xenarthrans and the impact of character and taxon sampling on the placental tree rooting. Mol. Biol. Evol.
DOUADY,C.J.,M.DOSAY,M.S.SHIVJI AND M.J.STANHOPE. In press. Molecular
phylogenetic evidence refuting the hypothesis of Batoidea (rays and skates) as derived sharks. Mol. Phylogenet. Evol.
DOUZERY,E.J.,A.M.PRIDGEON,P.KORES,H.P.LINDER,H.KURZWEIL,and M.W.
CHASE. 1999. Molecular phylogenetics of Diseae (Orchidaceae): a contribution from nuclear ribosomal ITS sequences. Am. J. Bot. 86: 887-899.
EFRON, B., E. HALLORAN, and S. HOLMES. 1996. Bootstrap confidence levels for
phylogenetic trees. Proc. Natl. Acad. Sci. U S A 93: 13429-13434.
FELSENSTEIN, J. 1981. Evolutionary trees from DNA sequences: a maximum likelihood
approach. J. Mol. Evol. 17: 368-376.
FELSENSTEIN, J. 1985. Confidence limits on phylogenies: an approach using the
bootstrap. Evolution 39: 783-791.
FELSENSTEIN, J. 2001. PHYLIP (PHYLogeny Inference Package). Version 3.6a2.1.
Department of Genome Sciences. University of Washington. Seattle.
FELSENSTEIN, J., andH. KISHINO. 1993. Is there something wrong with the bootstrap on
phylogenies - a reply. Syst. Biol. 42: 193-200.
GOLDMAN, N., J. P. ANDERSON, andA. G. RODRIGO. 2000. Likelihood-based tests of
topologies in phylogenetics. Syst. Biol. 49: 652-670.
HENZE, K., D. S. HORNER, S. SUGURI, D. V. MOORE, L. B. SANCHEZ, M. MULLER, andT.
M. EMBLEY. 2001. Unique phylogenetic relationships of glucokinase and
glucosephosphate isomerase of the amitochondriate eukaryotes Giardia intestinalis, Spironucleus barkhanus and Trichomonas vaginalis. Gene 281: 123-131.
HILLIS, D. M., andJ. J. BULL. 1993. An empirical-test of bootstrapping as a method for
assessing confidence in phylogenetic analysis. Syst. Biol. 42: 182-192.
HUELSENBECK, J. P. 2002. Testing a covariotide model of DNA substitution. Mol. Biol.
HUELSENBECK, J. P., andF. RONQUIST. 2001. MRBAYES: Bayesian inference of
phylogenetic trees. Bioinformatics 17: 754-755.
HUELSENBECK, J. P., F. RONQUIST, R. NIELSEN, andJ. P. BOLLBACK. 2001. Bayesian inference of phylogeny and its impact on evolutionary biology. Science 294: 2310- 2314.
KAROL, K. G., R. M. MCCOURT, M. T. CIMINO, andC. F. DELWICHE. 2001. The closest living relatives of land plants. Science 294: 2351-3.
KIMURA,M.1980. A simple method for estimation evolutionary rate of base substitutions
through comparative studies of nucleotide sequences. J. Mol. Biol. 16:111-120.
LARGET, B., andD. L. SIMON. 1999. Markov chain Monte Carlo algorithms for the
Bayesian analysis of phylogenetic trees. Mol. Biol. Evol. 16: 750-759.
LEACHÉ, A. D., andT. W. REEDER. 2002. Molecular systematics of the Eastern Fence
Lizard (Sceloporus undulatus): a comparison of parsimony, likelihood, and Bayesian approaches. Syst. Biol. 51: 44-68.
LUTZONI, F., M. PAGEL, andV. REEB. 2001. Major fungal lineages are derived from lichen symbiotic ancestors. Nature 411: 937-40.
MADDISON, W. P. 1997. Gene trees in species trees. Syst. Biol. 46: 523-536.
MEIRELES, C. M., J. CZELUSNIAK, M. P. SCHNEIDER, J. A. MUNIZ, M. C. BRIGIDO, H. S.
FERREIRA, andM. GOODMAN. 1999. Molecular phylogeny of ateline New World
monkeys (Platyrrhini, Atelinae) based on gamma-globin gene sequences: evidence that Brachyteles is the sister group of Lagothrix. Mol. Phylogenet. Evol. 12: 10-30. MURPHY, W. J., E. EIZIRIK, S. J. O'BRIEN, O. MADSEN, M. SCALLY, C. J. DOUADY, E.
2001. Resolution of the early placental mammal radiation using Bayesian phylogenetics. Science 294: 2348-2351.
POSADA, D., andK. A. CRANDALL. 1998. MODELTEST: testing the model of DNA
substitution. Bioinformatics 14: 817-818.
RAMBAUT, A., and N. C. GRASSLY. 1997. Seq-Gen: an application for the Monte Carlo
simulation of DNA sequence evolution along phylogenetic trees. Comput. Appl. Biosci. 13: 235-238.
RANNALA, B., andZ. YANG. 1996. Probability distribution of molecular evolutionary
trees: a new method of phylogenetic inference. J. Mol. Evol. 43: 304-311.
STRIMMER, K., andA. VON HAESELER. 1996. Quartet Puzzling: a quartet maximum-
likelihood method for reconstructing tree topologies. Mol. Biol. Evol. 13: 964- 969.
SWOFFORD, D. L. 2002. PAUP*. Phylogenetic Analysis Using Parsimony (*and Other
Methods). Version 4.0b10. Sinauer Associates. Sunderland, Massachusetts. WADDELL, P. J., H. KISHINO, andR. OTA. 2001. A Phylogenetic Foundation for
Comparative Mammalian Genomics. Genome Informatics Series. 12: 141-155.
WHITTINGHAM, L. A., B. SLIKAS, D. W. WINKLER, andF. H. SHELDON. 2002. Phylogeny
of the tree swallow genus, Tachycineta (Aves: Hirundinidae), by Bayesian analysis of mitochondrial DNA sequences. Mol. Phylogenet. Evol. 22: 430-441.
WILCOX, T. P., D. J. ZWICKL, T. A. HEATH, andD. M. HILLIS. In press. Phylogenetic relationships of the dwarf boas and a comparison of Bayesian and bootstrap measures of phylogenetic support. Mol. Phylogenet. Evol.
YANG, Z. H., andB. RANNALA. 1997. Bayesian phylogenetic inference using DNA sequences: a Markov Chain Monte Carlo method. Mol. Biol. Evol. 14: 717-724.
FIGURE LEGENDS
FIG. 1. Linear correlation between maximum likelihood bootstrap percentages (BPML)
and Bayesian posterior probabilities (PP, open circles) or bootstrapped Bayesian posterior probabilities (BPBay, black triangles) for empirical data sets. The dotted line represents a
slope of 1—with equality of BPML and PP or BPBay—while dashed and plain lines
represent PP = f(BPML) and BPBay = f(BPML) regression lines, respectively. All axes
represent node support as percentages. See Supplementary Material for further information regarding data sets.
FIG. 2. Linear correlation between maximum likelihood bootstrap percentages (BPML)
and Bayesian posterior probabilities (PP, open circles) or bootstrapped Bayesian posterior probabilities (BPBay, black triangles) in 25 simulated data sets. “True nodes” are nodes
that were present in the model topology used to simulate the data sets and “False nodes” are nodes that were not in the model topology. The dotted line represents a slope of 1— with equality of BPML and PP or BPBay—while dashed and plain lines represent PP =
f(BPML) and BPBay = f(BPML) regression lines, respectively. All axes represent node
support as percentages. Topology and parameters used for the simulation:
(A:0.043143,((B:0.027559,(C:0.018247,D:0.024211):0.003601):0.011055,(E:0.005704,( F:0.010024,G:0.006528):0.000708):0.021913):0.003809) with branch lengths issued from the xenarthran data set; 1000 nucleotides; K2P with Ti/Tv = 2.00; Γ8 with α = 1.00.
SUPPLEMENTARY MATERIAL
Linear Correlation between ML Bootstrap Percentages and Bayesian support for Eight Highly Diverse Empirical Data Sets
X axis: BPML X axis: BPML
Y axis: PP Y axis: BPBay
Data r2 S B r2 S B Orchids, ITS 1 0.85 0.59 44.09 0.99 1.22 -21.47 Mammals, VWF 2 0.93 0.74 27.29 0.99 1.07 -8.13 Insects, EF1α3 0.75 0.36 64.33 0.99 1.07 -6.97 Insects, Mitochondrial 4 0.75 0.93 12.05 0.99 1.10 -9.95 3 domains, HMGR 5 0.73 0.59 43.89 0.98 0.98 1.77 Sharks, 12S-16S (23 taxa) 6 0.52 0.18 83.48 0.96 0.95 2.81 Sharks, 12S-16S (21 taxa) 7 0.49 0.38 64.70 0.99 0.98 1.19 Snakes, 12S-16S 8 0.27 0.25 73.37 0.95 0.93 4.85
Combination of 6 data sets9 0.54 0.47 55.64 0.96 1.01 -1.85 Combination of 8 data sets 0.54 0.45 57.40 0.97 1.01 -1.38
NOTE.—S and B are respectively the slope and the intercept of the linear correlation Y = S x BPML + B.
1
: Subset of nuclear ribosomal ITS (682 aligned nucleotides, nt) for 23 Diseae orchids including 10 Satyriinae, 12 Disiinae and one Brownleeinae species (Douzery et al. 1999); highest likelihood tree: (Brownleea,(((Disa uniflora,(Disa racemosa,Disa pillansii,(Disa
chrysostachya,Herschelia)),(Disa rosea,Disa sagittalis))),(((Satyrium membranaceum,(Satyrium humile,(Satyrium stenopetalum,(Satyrium
acuminatum,(Satyrium carneum,Satyrium ligulatum))))),(Satyrium nepalense,Satyrium odorum)),(Satyrium bicallosum,Satyrium rhynchanthum))).
2
: Nuclear protein coding gene vWF (1161 nt) for 13 xenarthran mammals (Delsuc et al. in press); highest likelihood tree: (((Dasypus novemcinctus,Dasypus
kappleri),((Euphractus sexcinctus,(Chaetophractus villosus,Zaedyus pichiy)),(Tolypeutes matacus,(Priodontes maximus,Cabassous unicinctus)))),(Cyclopes didactylus,(Tamandua tetradactyla,Myrmecopha tridactyla)),(Choloepus didactylus,Bradypus tridactylus)). Seven armadillo genera are underlined and were used to provide the model tree for simulations.
3
: EF1α protein coding gene (2033 nt) of Buckley et al. (2002) for 14 cicada insects; highest likelihood tree: (Diemeniana frenchi,Diemeniana tillyardi,(((Amphipsalta cingulata,Notopsalta sericea),(Cicadetta celis,Cicadetta puer)),(Pauropsalta
johanae,(Myersalna depicta,((Maoricicada cassiope,Maoricicada hamiltoni),((Kikihia scutellaris,Kikihia cauta),(Rhodopsalta cruentata,Rhodopsalta leptomera))))).
4
: Mitochondrial (12S-16S ribosomal RNA [rRNA] + COI + COII) markers (2249 nt) of Buckley et al. (2002) for 14 cicadas; highest likelihood tree: (Diemeniana
frenchi,Diemeniana tillyardi,(((Amphipsalta cingulata,Notopsalta sericea),(Cicadetta celis,Cicadetta puer)),(Pauropsalta johanae,(Myersalna depicta,((Kikihia
scutellaris,Kikihia cauta),((Maoricicada cassiope,Maoricicada hamiltoni),(Rhodopsalta cruentata,Rhodopsalta leptomera))))).
5
: 3-hydroxy-3-methylglutaryl coenzyme A reductase (HMGR, 258 amino acids) for 15 taxa representing all three domains of life (Eukarya-Bacteria-Archea; Boucher et al. 2001); highest likelihood tree: (((Archaeoglobus profundus,(Archaeoglobus
fulgidus,(Streptococcus pyogenes,Pseudomonas mevalonii))),((Saccharomyces cerevisiae,Homo sapiens),(Arabidopsis thaliana,Zea mays))),((Methanothermobacter thermautotrophicus,(Vibrio cholerae,Haloferax volcanii)), (((Pyrococcus
abyssi,Pyrococcus horikoshii), Streptomyces aeriouvifer ), Aeropyrum pernix)))
6
: Shark mitochondrial 12S-16S rRNA for 23 taxa (1880 nt, Douady et al., in press); highest likelihood tree: (Petromyzon marinus,(Polymixia japonica,((((((Centrophorus granulosus,Squalus acanthias),(Squatina californica,Pristiophorus
nudipinnis)),((Heterodontus francisci,Ginglymostoma cirratum),(((((Isurus oxyrinchus,Isurus paucus),Lamna nasus),Carcharodon carcharias),(Carcharias taurus,Alopias vulpinus)),((Carcharhinus porosus,Mustelus manazo),Scyliorhinus canicula)))),(Hexanchus griseus,Heptranchias perlo)),(Raja radiata,Urobatis jamaicensis)),Hydrolagus colliei)),Siren intermedia).
7
: Shark mitochondrial 12S-16S rRNA for 21 taxa (1963 nt, Douady et al., in press); highest likelihood tree: (Polymixia japonica,(((((((Centrophorus granulosus,Squalus acanthias),(Squatina californica,Pristiophorus nudipinnis)),(Hexanchus
griseus,Heptranchias perlo)),((((((Isurus oxyrinchus,Isurus paucus),Lamna
nasus),Carcharodon carcharias),Carcharias taurus),Alopias vulpinus),((Carcharhinus porosus,Mustelus manazo),Scyliorhinus canicula))),Heterodontus
francisci),Ginglymostoma cirratum),(Raja radiata,Urobatis jamaicensis)),Hydrolagus barbouri).
8
: Snake mitochondrial 12S-16S rRNA for 23 taxa (1545 nt, Wilcox et al., in press); highest likelihood tree: ((Leptotyphlops dulcis,(Typhlops jamaicensis,Typhlops
ruber)),(Anilius scytale,((Trachyboa boulengeri,(Tropidophis greenwayi,(Tropidophis pardalis,(Tropidophis feicki,Tropidophis melanurus)))),((Xenopeltis unicolor,(Morelia boeleni,Loxocemus bicolor)),((Cylindrophis ruffus,(Uropeltis melanogaster,Rhinophis philippinus)),(((Ungaliophis continentalis,Exiliboa placata),Eryx conicus),(Boa
constrictor,(Acrochordus javanicus,(Pituophis lineaticolis,(Crotalus polysticus,Azemiops feae)))))))))).
9
: Six strictly independent data sets (Sharks 12S-16S [21 taxa] and Insects EF1α data sets excluded).
Figure 1 y = 0.59x + 43.89 R² = 0.73 y = 0.98x + 1.77 R² = 0.98 0 10 20 30 40 50 60 70 80 90 100 0 10 20 30 40 50 60 70 80 90 100 BPML P P a n d B PB a y BPML 0 10 20 30 40 50 60 70 80 90 100 P P a n d B PB a y 0 10 20 30 40 50 60 70 80 90 100 y = 0.95x + 2.81 R² = 0.96 y = 0.18x + 83.48 R² = 0.52 0 10 20 30 40 50 60 70 80 90 100 0 10 20 30 40 50 60 70 80 90 100 P P a n d B PB a y y = 0.59x + 44.09 R² = 0.85 y = 1.22x - 21.47 R² = 0.99 0 10 20 30 40 50 60 70 80 90 100 0 10 20 30 40 50 60 70 80 90 100 P P a n d B PB a y y = 0.47x + 55.64 R² = 0.54 y = 1.01x - 1.85 R² = 0.96
A. The three domains of life HMGR B. Sharks (23 taxa) 12S-16S C. Orchids ITS D. Combination Six empirical data sets
Figure 2 y = 1.14x - 2.05 R² = 0.78 y = 0.84x + 11.54 R² = 0.80 0 10 20 30 40 50 60 70 80 90 100 BPML 0 10 20 30 40 50 60 70 80 90 100 P P a n d B PB a y y = 0.87x + 15.79 R² = 0.88 y = 0.92x + 4.99 R ²= 0.92 0 10 20 30 40 50 60 70 80 90 100 BPML 0 10 20 30 40 50 60 70 80 90 100 P P a n d B PB a y
Figure 3 0.1 substitution / site Diemeniana frenchi Diemeniana tillyardi Amphipsalta cingulata Notopsalta sericea Cicadetta celis Cicadetta puer Pauropsalta johanae Myersalna depicta Kikihia scutellaris Kikihia cauta Maoricicada cassiope Maoricicada hamiltoni Rhodopsalta cruentata Rhodopsalta leptomera Maoricicada cassiope Maoricicada hamiltoni Kikihia scutellaris Kikihia cauta Mitochondrial genes (COI + COII + 12S + 16S) 2249 sites Nuclear gene (EF-1αααα) 2033 sites PP = 0.93 BPML= 69 BPBay= 59 PP = 0.94 BPML= 65 BPBay= 65 0.1 substitution / site Petromyzon Siren Polymixia Lamniformes Carcharhiniformes Rajiformes Myliobatiformes Hexanchiformes Hexanchiformes Chimaeriformes Squatiniformes Orectolobiformes Orectolobiformes Heterodontiformes Heterodontiformes Pristiophoriformes Squaliformes PP = 0.98 BPML= 61 BPBay= 57 PP = 0.99 BPML= 53 BPBay= 47 23 taxa (12S + 16S) 1880 sites 21 taxa (12S + 16S) 1963 sites