Altered Binding of Tumor Antigenic Peptides to MHC
Class I Affects CD8+ T Cell–Effector Responses
The MIT Faculty has made this article openly available.
Please share
how this access benefits you. Your story matters.
Citation
Clancy-Thompson, Eleanor et al. “Altered Binding of Tumor
Antigenic Peptides to MHC Class I Affects CD8+ T Cell–Effector
Responses.” Cancer immunology research 6 (2018): 1524-1536 ©
2018 The Author(s)
As Published
10.1158/2326-6066.cir-18-0348
Publisher
American Association for Cancer Research (AACR)
Version
Author's final manuscript
Citable link
https://hdl.handle.net/1721.1/124836
Terms of Use
Creative Commons Attribution-Noncommercial-Share Alike
Altered binding of tumor antigenic peptides to MHC class I
affects CD8
+T cell-effector responses
Eleanor Clancy-Thompson1, Christine A. Devlin2, Paul M. Tyler1, Mariah M. Servos1, Lestat R. Ali1,3, Katherine S. Ventre1, M. Aladdin Bhuiyan1, Patrick T. Bruck1, Michael E.
Birnbaum#2,4, and Stephanie K. Dougan#1,3,4
1Dana-Farber Cancer Institute, Department of Cancer Immunology and Virology, Boston, MA 02215, USA
2Koch Institute for Integrative Cancer Research, Dept. of Biological Engineering, Massachusetts Institute of Technology, Cambridge, MA 02139, USA
3Harvard Medical School Department of Microbiology and Immunobiology, Boston, MA 02215, USA
# These authors contributed equally to this work.
Abstract
T-cell priming occurs when a naïve T cell recognizes cognate peptide-MHC complexes on an activated antigen presenting cell. The circumstances of this initial priming have ramifications on the fate of the newly primed T cell. Newly primed CD8+ T cells can embark onto different trajectories, with some becoming short-lived effector cells and others adopting a tissue resident or memory cell fate. To determine whether T-cell priming influences the quality of the effector T-cell response to tumors, we used transnuclear CD8+ T cells that recognize the melanoma antigen TRP1 using TRP1high or TRP1low TCRs that differ in both affinity and fine specificity. From a series of altered peptide ligands, we identified a point mutation (K8) in a non-anchor residue that, when analyzed crystallographically and biophysically, destabilized the peptide interaction with the MHC binding groove. In vitro, the K8 peptide induced robust proliferation of both TRP1high and
TRP1low CD8+ T cells but did not induce expression of PD-1. Cytokine production from K8-stimulated TRP1 cells was minimal, whereas cytotoxicity was increased. Upon transfer into B16 tumor-bearing mice, the reference peptide (TRP1-M9)- and K8-stimulated TRP1 cells were equally effective at controlling tumor growth but accomplished this through different mechanisms. TRP1-M9-stimulated cells produced more IFNγ, whereas K8-stimulated cells accumulated to higher numbers and were more cytotoxic. We, therefore, conclude that TCR recognition of weakly binding peptides during priming can skew the effector function of tumor-specific CD8+ T cells.
4 Corresponding authors: Stephanie K. Dougan, Dana-Farber Cancer Institute, 450 Brookline Ave., Sm558B, Boston, MA 02215,
Phone: (617)582-9609, Fax: (617)582-9610, Stephanie_dougan@dfci.harvard.edu, Michael E. Birnbaum, Koch Institute for Integrative Cancer Research, 500 Main Street, 76-353D, Cambridge, MA 02139, Phone: (617)715-2355, mbirnb@mit.edu.
Author contributions: E.C-T., C.A.D, P.M.T, and M.M.S. designed and conducted experiments, analyzed data, and helped write the
manuscript. M.A.B, K.V., and P.B. conducted experiments. L.R.A. analyzed RNAseq data. M.E.B. and S.K.D. designed experiments,
HHS Public Access
Author manuscript
Cancer Immunol Res
. Author manuscript; available in PMC 2019 December 01.Published in final edited form as:
Cancer Immunol Res. 2018 December ; 6(12): 1524–1536. doi:10.1158/2326-6066.CIR-18-0348.
A
uthor Man
uscr
ipt
A
uthor Man
uscr
ipt
A
uthor Man
uscr
ipt
A
uthor Man
uscr
ipt
Keywords
CD8+ T-cell epitopes; TRP1; melanoma self-antigen; H-2Db; MHC peptide binding; IFNg; cytotoxicity
Introduction
Naïve T-cell priming occurs when a T cell recognizes its cognate peptide complexed with MHC on the surface of an activated antigen presenting cell, typically a dendritic cell. Costimulatory ligands on the dendritic cell engage CD28 on the T cell to amplify the signal sent via the TCR/CD3 complex, resulting in T-cell activation. Successfully activated T cells proliferate, secrete cytokines such as IL2, and differentiate into effector T cells that may leave the lymph node and traffic to sites of inflammation. Many steps in this initial priming process have ramifications on the ensuing effector cell response. For CD4+ T cells, slight alterations in the cytokine milieu at the time of priming can skew the cells to adopt distinct effector cell fates, with Th1, Th2, and Th17 cells coordinating very different kinds of immune responses (1).
CD8+ T cells have discrete effector functions as well, including secretion of IFNγ, TNFα, and IL2, cytolysis, and differentiation into tissue resident or central memory cells. CD8+ T-cell fates are influenced by the circumstances of T-T-cell priming. This has been best studied for memory cells, where alterations in TCR affinity or duration of contact with the initial antigen presenting cell can affect memory T-cell formation (2-7). CD8+ T cell-effector functions are also influenced by TCR affinity for peptide-MHC (pMHC) complexes, suggesting that effector functions may be imprinted as early as the priming stage. In a study of influenza-specific T-cell responses, CD8+ T cells with lower TCR affinities produced fewer cytokines, with IFNγ being produced more frequently than IL2, suggesting that CD8+ T cell-effector functions are determined by the quality of TCR engagement. CD8+ T cell subsets are particularly important in tumors, where T cells may have low affinity or be in various states of exhaustion or dysfunction (8). Higher affinity TCR engagement leads to better antitumor responses, but only to a certain extent. Work by our group and others has shown that adoptive transfer of T cells with the highest affinity TCRs leads to tumor control that is equivalent to or slightly worse than that conferred by more moderate affinity TCRs (9, 10).
We previously reported two lines of mice derived by somatic cell nuclear transfer from nuclei of melanoma-specific CD8+ T cells (9). These two lines of mice contain monoclonal populations of T cells with TCRs that recognize tyrosinase related protein 1 (TRP1) with either high or low affinity (TRP1high or TRP1low). Upon adoptive transfer into tumor-bearing mice, both high and low affinity TRP1 T cells controlled tumor growth equally well. This is encouraging, because not all patients have robust neoantigen-specific T-cell
responses (11). Recruiting self-reactive T cells, which may have a lower affinity, into the antitumor response may be a good strategy for expanding the reach of immunotherapy to a broader patient population.
A
uthor Man
uscr
ipt
A
uthor Man
uscr
ipt
A
uthor Man
uscr
ipt
A
uthor Man
uscr
ipt
TRP1 is a self-antigen that can be presented on H-2Db, although the native epitope binds poorly to the MHC groove due to an alanine at the 9th position anchor residue. Substitution of this alanine for methionine dramatically increases the binding to H-2Db, as previously reported both for TRP1 and other H-2Db binding peptides (12, 13), and T cells generated through vaccination with the altered peptide can mediate rejection of melanomas expressing the native TRP1 peptide (14). The use of altered peptide ligands as cancer vaccines allows for priming and expansion of TCR clonotypes that cross-react with the native peptide but would not ordinarily be primed by the native peptide alone. Typically, the altered peptide contains modified anchor residues to increase stability of the peptide-MHC complex, while presenting a nearly identical TCR contact surface (12, 15). Examples of altered peptide ligands for mouse and human tumor antigens and for MHC class I and class II have been reported (15-18). However, increased stability of the peptide-MHC complex does not always correlate with more efficient T-cell activation. For example, insertion of a proline residue in the third position of a melanoma epitope destabilized its binding to H-2Db, yet resulted in increased cytokine production from stimulated T cells expressing a transgenic TCR (19). How TCRs recognize pMHC complexes is important (20). The relationships between TCR structure, antigen affinity, signaling strength, and antitumor activity are not fully defined (21). Although a correlation between TCR-pMHC affinity and activity exists, this relationship is not absolute, with both high-affinity/low activity and low-affinity/high activity TCR-pMHC pairs identified and characterized (21-23). These relationships are complicated due to factors such as antigen density, mode of structural engagement, and involvement of other molecules in the immune synapse (20). In an immunotherapeutic setting, where antitumor activity must be balanced with the potential for autoimmunity, higher affinity, without consideration for other factors, may not necessarily lead to better outcomes. The affinity of a prospective neoantigen for its cognate MHC and how it compares to the affinity of the original self-antigen, may also be important factors in the choice of target antigens (24, 25). Therefore, the efficacy of a candidate target antigen in a tumor may rely upon multivariate considerations, including TCR-pMHC affinity, the mode of engagement between the TCR and pMHC, the peptide’s ability to be processed and presented by MHC, and similarity to self-antigens.
Here we examined how the initial step of T-cell priming influenced the functions of the ensuing CD8+ effector T cells. Melanoma-specific CD8+ T cells were primed in vitro using peptides that bound to H-2Db with distinct biophysical properties. PD-1 upregulation, cytokine production, and granzyme B expression were differentially regulated by priming with different peptides. These initial differences were propagated long-term and resulted in qualitatively different effector functions in vitro and in tumor-bearing mice.
Materials and Methods
Animal care
Animals were housed at the Dana-Farber Cancer Institute and were maintained according to protocols approved by the DFCI IACUC (#14-019 and #14-037). TRP1high and TRP1low transnuclear mouse lines were generated by us as previous reported and maintained in house (9). Both lines are now available through Jackson labs (stock #30957 and #30958). TRP1high
A
uthor Man
uscr
ipt
A
uthor Man
uscr
ipt
A
uthor Man
uscr
ipt
A
uthor Man
uscr
ipt
mice were also crossed to CD45.1+ mice from Jackson labs (B6.SJL-Ptprca Pepcb/BoyJ, stock #002014). C57BL/6 mice were purchased from Jackson Labs.
Cell lines
For mammalian cell studies, B16-F10 cells were purchased from ATCC. Panc02 cells were obtained from the Division of Cancer Treatment and Diagnosis (DCTD), National Cancer Institute cell repository. RMAS cells were a gift from Hidde Ploegh (Whitehead Institute for Biomedical Research). Cells were cultured in RPMI 1640 medium (Gibco) supplemented with 10% heat-inactivated FBS (Omega Scientific catalogue # FB-11), 2 mM L-glutamine (Gibco), penicillin G sodium (100 U/mL, Gibco), streptomycin sulfate (100 μg/mL, Gibco), 1 mM sodium pyruvate (Gibco), 0.1 mM nonessential amino acids (Gibco), and 0.1 mM β-mercaptoethanol (Sigma). Cells were passaged 2-6 times prior to use and were used for experiments at 80-90% confluency. Mycoplasma testing was performed by PCR every 4 months and was negative for the entire course of this study. No further authentication was performed.
For insect cell production of baculoviruses and protein, Sf9 and High Five cells were each a gift from K. Christopher Garcia (Stanford University). Sf9 cells were cultured in Sf900-III medium supplemented with 10% FBS (Atlanta biologicals, S11150) and gentamicin sulfate (Lonza, 17518Z) at 28°C. High Five cells were cultured in Insect Xpress medium (Lonza, BE12-730Q) supplemented with gentamicin sulfate (Lonza, 17518Z) at 28°C. No cell line authentication or mycoplasma testing were performed during the course of this study.
In vivo experiments
In vivo experiments were performed as described (26). Briefly, 2×10⁵ B16 cells were inoculated by subcutaneous injection into the flank in 100 μL of phosphate buffered saline (PBS). Tumor size was measured daily using precision calipers. Mice were euthanized when the total tumor volume exceeded 1500 mm3. Tumors were excised, minced with scissors, and incubated in RPMI containing digestion enzymes (Miltenyi tumor dissociation kit, catalogue # 130-096-730) at 37oC for 30 minutes. Tumors were filtered through a 40-micron cell strainer, washed with PBS, and centrifuged at 300 x g for 5 minutes. The resulting cell pellet containing tumor debris and infiltrating immune cells was resuspended in FACS buffer (PBS with 2% fetal calf serum) and stained with a master mix of antibodies described below. Tumor-draining inguinal lymph nodes were crushed through a 40-micron cell strainer to obtain single-cell suspensions. Spleens were crushed through a 40-micron cell strainer and erythrocytes removed with ACK lysis buffer (150mM NH4Cl, 10mM KHCO3, 0.1mM Na2EDTA).
Flow cytometry
Cells from 1/10 spleen, total tumor draining lymph nodes, and approximately 50 mg tumor were incubated with extracellular staining mix including 2% fetal calf serum for 30 minutes at 4oC, washed once in PBS, and either resuspended in 1% formalin in PBS for extracellular analysis only or were fixed, permeabilized, and stained with intracellular antibodies against specific cytokines (intracellular cytokine buffer kit from Biolegend catalogue # 421002). Analysis was performed on a BD Fortessa flow cytometer. All tumor infiltrates were first
A
uthor Man
uscr
ipt
A
uthor Man
uscr
ipt
A
uthor Man
uscr
ipt
A
uthor Man
uscr
ipt
gated on CD45+ cells using SSC low as a proxy for viability. Flow cytometry antibodies used in this study were purchased from Biolegend: CD8 (clone 53-6.7), CD25 (clone 3C7), CD44 (clone IM7), CD45 (clone 30-F11), CD45.1 (clone A20), granzyme B (clone QA16A02), H2-Db (clone KH95), IFNγ (clone XMG1.2), KLRG1 (clone 2F1), LAG-3 (clone C9B7W), and TIGIT (clone 1G9). Analysis was performed using Flow Jo software. H-2Db tetramers containing a photocleavable ligand as described (27) were obtained from the NIH Tetramer Core Facility and photo-exchanged in the presence of an altered peptide library (A1, A3, A4, K4, E8, F8, K8, TRP1-M9, S8) and the native TRP1 peptide
(TAPDNLGYA). An irrelevant peptide was included as a negative control. Tetramer (1 μg) and peptide solutions (1 mM final concentration) were placed in a 96-well plate (U-bottom, 100 μL per well). The plate was placed on ice and irradiated for 15 minutes in a Stratalinker 2400 UV cross-linker equipped with 365-nm UV-lamps at an ≈10- to 20-cm distance. Peptides were synthesized by the MIT Koch Institute Biopolymers Facility.
Cell culturing, proliferation assay, and cytokine analysis
Primary cells were cultured in RPMI 1640 medium (Gibco) supplemented with 10% heat-inactivated FBS (Omega Scientific catalogue # FB-11), 2 mM L-glutamine (Gibco), penicillin G sodium (100 U/mL, Gibco), streptomycin sulfate (100 μg/mL, Gibco), 1 mM sodium pyruvate (Gibco), 0.1 mM nonessential amino acids (Gibco), and 0.1 mM β-mercaptoethanol (Sigma).
B cells were isolated from C57BL/6 mouse spleen and lymph nodes using magnetic bead enrichment (Thermo Fisher Dynabeads Mouse CD43, catalogue # 11422D) and stimulated with agonistic anti-CD40 (clone HM40-3, 2 μg/mL BD Cell Analysis catalogue # 553721) for 48 hours. CD8+ T cells were isolated from spleen and lymph nodes of TRP1high and TRP1low mice using EasySep™ Mouse CD8+ T Cell Isolation Kit (StemCell catalogue # 19853) and stained with Celltrace Violet (Invitrogen) according to the manufacturer’s instructions. T cells were plated at a 1:1 ratio with activated B cells, altered peptide ligands (1 μg/mL), and human IL2 (10 U/mL Peprotech catalogue # 200-02-250UG; day 0). After coculture for 3-6 days, T cells were stained and analyzed by flow cytometry as described above and using Flow Jo software. Proliferation index was calculated by dividing the mitotic events by the progenitors.
For cytokine analysis, CD40-activated B cells and CD8+ T cells were cocultured at a 1:1 ratio, and supernatants were harvested after 48 hours. IL2 and IFNγ were quantified by ELISA (Biolegend catalogue # 431006 for IL2 and # 430806 for IFNγ). Supernatants were diluted 1:4 prior to analysis and used at 100 μL volume per well of a 96 well plate.
Additional cytokines and chemokines were analyzed by cytokine bead array (Discovery Assay 31-plex mouse cytokine and chemokine panel, Eve Technologies).
Re-stimulation and cytotoxicity assay
On day −2, B cells were isolated by CD43 magnetic bead selection and stimulated with anti-CD40 as described for the proliferation assay. CD8+ T cells were isolated from spleen and lymph nodes of TRP1high mice and plated at a 1:1 ratio with activated B cells, TRP1-M9 or K8 peptide (1 μg/mL), and human IL2 (10 U/mL; day 0). After coculture for 48 hours, B
A
uthor Man
uscr
ipt
A
uthor Man
uscr
ipt
A
uthor Man
uscr
ipt
A
uthor Man
uscr
ipt
cells are removed using the same CD8+ T-cell negative selection kit as above (day 2). T cells were rested in culture for one week, with fresh media containing IL2 (10 U/mL) supplied every 48 hours. On day 8, B16 and Panc02 (negative control tumor cell line) were plated with IFNγ (100 ng/mL, Peprotech catalogue # 315-05) for 24 hours to enhance MHC class I expression. On day 9, T cells were plated in media as a negative control (no re-stimulation), with B16 cells, or with Panc02 cells at various ratios as indicated in the figure legends. Wells with no T cells, including media only, B16 only, and Panc02 only wells, were used as negative controls. After coculture for 24 hours (day 10), GolgiStop was added according to the manufacturer’s protocol, and the cells were further incubated for 3.5 hours. T cells were removed by vigorous pipetting and analyzed by flow cytometry using the antibodies indicated above. After T cells were removed, the remaining tumor cells were lysed with CellTiter-Glo (Promega) as previously reported and analyzed using a Perkin Elmer EnVision plate reader (28). Luminescence values were compared to values from wells containing tumor cells only (no T cells). Media only values were subtracted from experimental values to eliminate background signal.
Adoptive Transfer
CD8+ T cells were isolated from TRP1high CD45.1+ mice and cocultured with CD40-activated B cells in the presence of TRP1-M9 or K8 peptide and IL2 as already described. After 48 hours, 2×10⁶ CD45.1+CD8+ T cells were transferred by intravenous injection (150 μL volume, diluted in sterile PBS) into B16 tumor-bearing mice at either 2 days or 5 days post tumor-inoculation as indicated in the figure legend. For some experiments, tumor size was monitored daily by precision calipers. For other experiments, tumor size was not measured and mice were euthanized 6 days post adoptive transfer, and spleens, tumor draining lymph nodes, and tumors were dissociated and analyzed by flow cytometry as above. Transferred TRP1 T cells were identified as CD45+CD8+CD45.1+ cells.
RMAS stabilization assay
The TAP-deficient cell line RMASwas incubated at 30oC overnight. TRP1 altered peptides were used at the concentrations indicated in Fig. 1F and incubated with 100,000 RMAS cells at 37oC for an additional 3 hours as previously described (29). Peptide binding was assessed by surface expression of H-2Db, as measured by flow cytometry of cultured RMAS cells and analyzed using Flow Jo.
RNAseq
106 TRP1high or TRP1low CD8+ T cells were stimulated with 106 peptide-pulsed B-cell blasts. CD8+ T cells were sorted by FACS from cocultures after 48 hours, and RNA was prepared (Qiagen RNeasy Plus Mini Kit catalogue # 74134). Library preparation and Illumina sequencing was performed by the Dana-Farber Molecular Biology Core Facility Kapa stranded mRNA Hyper Prep kit (KAPABiosystems) was used for library construction, followed by multiplex sequencing on a single lane of HiSeq (Illumina). 75bp paired sequencing was performed. Data were analyzed using Viper software and deposited in GEO (accession number GSE120892).
A
uthor Man
uscr
ipt
A
uthor Man
uscr
ipt
A
uthor Man
uscr
ipt
A
uthor Man
uscr
ipt
Protein expression of recombinant H-2Db
Recombinant H-2Db is expressed both as a peptide-β2M-H-2Db single-chain trimer and as exogenously loaded MHC molecules. The single-chain trimers were constructed as previously described (30), with the C-terminus of the TRP1-M9 or K8 peptide linked to the N-terminus of mouse β2M via a 15-amino acid (GGGS)3 linker, the C-terminus of β2M linked to the N-terminus of H-2Db with a 20 amino acid (GGGS)4 linker, and with C-terminal BAP and His8 tags for site-specific biotinylation and purification, respectively. The construct was cloned into the GP67A vector (BD Biosciences, 554756) for production of baculoviruses. Baculoviruses were created in SF9 cells (gift from K. Christopher Garcia) via co-transfection of BestBac 2.0 (Expression Systems 91-002) and the MHC constructs with Cellfectin II (Life Technologies 10362-100). Proteins were expressed via infection of High Five cells (gift from K. Christopher Garcia) with baculoviruses for 48 hours at 27oC, and then purified as previously described (31). H-2Db was expressed with exogenously loaded TRP1-M9 and K8 peptides via refolding of bacterially-expressed inclusion bodies. Briefly, H-2Db and mouse β2M were each cloned into the pET28a vector (Novagen 69864-3), then expressed in BL21 DE3 E. coli (New England Biolabs, C2527I) at 37o for 5 hours. Bacteria were pelleted via centrifugation (20 minutes at 6,000 x g), resuspended in Hepes Buffered Saline (10 mM HEPES pH 7.2, 150mM NaCl), and lysed by adding 2x volume of lysis buffer (50 mM Tris-HCl pH 8.0, 1% (v/v) Triton X-100, 1% (w/v) Sodium deoxycholic acid, 100 mM NaCl) and 10 μL Benzonase. Cells were then sonicated and centrifuged for 15 minutes at 10,000xg, leaving protein inclusion bodies. The inclusion bodies were then purified via resuspension followed by centrifugation three times in a detergent-containing wash buffer (50 mM Tris-HCl pH 8.0, 100 mM NaCl, 0.5% (v/v) Triton X-100, 1 mM Sodium EDTA, 1 mM DTT, 0.2 mM PMSF), followed by a final wash in a a detergent-free buffer (50 mM Tris-HCl pH 8.0, 1 mM Sodium EDTA, 1 mM DTT, 0.2 mM PMSF). Purified inclusion bodies were then solubilized in a urea containing buffer (20 mM Tris-HCl pH 8.0, 8 M urea, 0.5 mM EDTA, 1 mM DTT). The β2M and H-2Db inclusion bodies were then then co-refolded in the presence of TRP1-M9 or K8 peptides via the dilution method in refolding buffer (100 mM Tris pH 8.0, 400 mM Arginine hydrochloride, 0.5 mM oxidized glutathione, 5 mM reduced glutathione, 2 mM Sodium EDTA, 0.2 mM PMSF) as previously described (32). All proteins were then exchanged into HBS (100mM HEPES pH 7.2, 150 mM NaCl) and purified via size exclusion chromatography using an AKTAPure FPLC on an S200 Increase column (GE Healthcare).
Single-chain trimer sequences For M9: Protein: MLLVNQSHQGFNKEHTSKMVSAIVLYVLLAAAAHSAFATAPDNLGYMGG GGSGGGGSGGGGSIQKTPQIQVYSRHPPENGKPNILNCYVTQFHPPHIEIQMLKNGK KIPKVEMSDMSFSKDWSFYILAHTEFTPTETDTYACRVKHASMAEPKTVYWDRDM GGGGSGGGGSGGGGSGGGGSGPHSMRYFETAVSRPGLEEPRYISVGYVDNKEFVRF DSDAENPRYEPRAPWMEQEGPEYWERETQKAKGQEQWFRVSLRNLLGAYNQSAG GSHTLQQMSGCDLGSDWRLLRGYLQFAYEGRDYIALNEDLKTWTAADMAAQITRR KWEQSGAAEHYKAYLEGECVEWLHRYLKNGNATLLRTDSPKAHVTHHPRSKGEVT
A
uthor Man
uscr
ipt
A
uthor Man
uscr
ipt
A
uthor Man
uscr
ipt
A
uthor Man
uscr
ipt
LRCWALGFYPADITLTWQLNGEELTQDMELVETRPAGDGTFQKWASVVVPLGKEQN YTCRVYHEGLPEPLTLRWEPAAAGGGLNDIFEAQKIEWHEHHHHHHHH* DNA: ATGCTACTAGTAAATCAGTCACACCAAGGCTTCAATAAGGAACACACAAGC AAGATGGTAAGCGCTATTGTTTTATATGTGCTTTTGGCGGCGGCGGCGCATTCTGC CTTTGCGaccgcgccggataacctgggctatatgGGAGGTGGGGGATCA GGCGGAGGAGGCTCAGGTGGGGGAGGCTCAATCCAGAAAACCCCTCAAATTCAA GTATACTCACGCCACCCACCGGAGAATGGGAAGCCGAACATACTGAACTGCTACG TAACACAGTTCCACCCGCCTCACATTGAAATCCAAATGCTGAAGAACGGGAAAAA AATTCCTAAAGTAGAGATGTCAGATATGTCCTTCAGCAAGGACTGGTCTTTCTATAT CCTGGCTCACACTGAATTCACCCCCACTGAGACTGATACATACGCCTGCAGAGTTA AGCATGCCAGTATGGCCGAGCCCAAGACCGTCTACTGGGATCGAGACATGGGAGG TGGCGGTTCGGGCGGAGGCGGCTCGGGTGGCGGCGGCAGCGGCGGAGGTGGTT CGGGCCCACACTCGATGCGGTATTTCGAGACCGCCGTGTCCCGGCCCGGCCTCGA GGAGCCCCGGTACATCTCTGTCGGCTATGTGGACAACAAGGAGTTCGTGCGCTTC GACAGCGACGCGGAGAATCCGAGATATGAGCCGCGGGCGCCGTGGATGGAGCAG GAGGGGCCGGAGTATTGGGAGCGGGAAACACAGAAAGCCAAGGGCCAAGAGCA GTGGTTCCGAGTGAGCCTGAGGAACCTGCTCGGCGCCTACAACCAGAGCGCGGG CGGCTCTCACACACTCCAGCAGATGTCTGGCTGTGACTTGGGGTCGGACTGGCGC CTCCTCCGCGGGTACCTGCAGTTCGCCTATGAAGGCCGCGATTACATCGCCCTGA ACGAAGACCTGAAAACGTGGACGGCGGCGGACATGGCGGCGCAGATCACCCGAC GCAAGTGGGAGCAGAGTGGTGCTGCAGAGCATTACAAGGCCTACCTGGAGGGCG AGTGCGTGGAGTGGCTCCACAGATACCTGAAGAACGGGAACGCGACGCTGCTGC GCACAGATTCCCCAAAGGCACATGTGACCCATCACCCCAGATCTAAAGGTGAAGT CACCCTGAGGTGCTGGGCCCTGGGCTTCTACCCTGCTGACATCACCCTGACCTGG CAGTTGAATGGGGAGGAGCTGACCCAGGACATGGAGCTTGTGGAGACCAGGCCT GCAGGGGATGGAACCTTCCAGAAGTGGGCATCTGTGGTGGTGCCTCTTGGGAAG GAGCAGAATTACACATGCCGTGTGTACCATGAGGGGCTGCCTGAGCCCCTCACCC TGAGATGGGAGCCTGCGGCCGCGGGTGGCGGTCTGAACGACATCTTCGAGGCTC AGAAAATCGAATGGCACGAACATCATCACCACCATCACCACCATTAA For K8: Protein: MLLVNQSHQGFNKEHTSKMVSAIVLYVLLAAAAHSAFATAPDNLGKMGG GGSGGGGSGGGGSIQKTPQIQVYSRHPPENGKPNILNCYVTQFHPPHIEIQMLKNGK KIPKVEMSDMSFSKDWSFYILAHTEFTPTETDTYACRVKHASMAEPKTVYWDRDM GGGGSGGGGSGGGGSGGGGSGPHSMRYFETAVSRPGLEEPRYISVGYVDNKEFVRF DSDAENPRYEPRAPWMEQEGPEYWERETQKAKGQEQWFRVSLRNLLGAYNQSAG GSHTLQQMSGCDLGSDWRLLRGYLQFAYEGRDYIALNEDLKTWTAADMAAQITRR KWEQSGAAEHYKAYLEGECVEWLHRYLKNGNATLLRTDSPKAHVTHHPRSKGEVT LRCWALGFYPADITLTWQLNGEELTQDMELVETRPAGDGTFQKWASVVVPLGKEQN YTCRVYHEGLPEPLTLRWEPAAAGGGLNDIFEAQKIEWHEHHHHHHHH* DNA: ATGCTACTAGTAAATCAGTCACACCAAGGCTTCAATAAGGAACACACAAGC AAGATGGTAAGCGCTATTGTTTTATATGTGCTTTTGGCGGCGGCGGCGCATTCTGC CTTTGCGaccgcgccggataacctgggcaaaatgGGAGGTGGGGGATCAGGCGGAGGAGGCTC
A
uthor Man
uscr
ipt
A
uthor Man
uscr
ipt
A
uthor Man
uscr
ipt
A
uthor Man
uscr
ipt
AGGTGGGGGAGGCTCAATCCAGAAAACCCCTCAAATTCAAGTATACTCACGCCAC CCACCGGAGAATGGGAAGCCGAACATACTGAACTGCTACGTAACACAGTTCCACC CGCCTCACATTGAAATCCAAATGCTGAAGAACGGGAAAAAAATTCCTAAAGTAGA GATGTCAGATATGTCCTTCAGCAAGGACTGGTCTTTCTATATCCTGGCTCACACTG AATTCACCCCCACTGAGACTGATACATACGCCTGCAGAGTTAAGCATGCCAGTATG GCCGAGCCCAAGACCGTCTACTGGGATCGAGACATGGGAGGTGGCGGTTCGGGC GGAGGCGGCTCGGGTGGCGGCGGCAGCGGCGGAGGTGGTTCGGGCCCACACTC GATGCGGTATTTCGAGACCGCCGTGTCCCGGCCCGGCCTCGAGGAGCCCCGGTAC ATCTCTGTCGGCTATGTGGACAACAAGGAGTTCGTGCGCTTCGACAGCGACGCGG AGAATCCGAGATATGAGCCGCGGGCGCCGTGGATGGAGCAGGA GGGGCCGGAGTATTGGGAGCGGGAAACACAGAAAGCCAAGGGCCAAGAGCAGT GGTTCCGAGTGAGCCTGAGGAACCTGCTCGGCGCCTACAACCAGAGCGCGGGCG GCTCTCACACACTCCAGCAGATGTCTGGCTGTGACTTGGGGTCGGACTGGCGCCT CCTCCGCGGGTACCTGCAGTTCGCCTATGAAGGCCGCGATTACATCGCCCTGAAC GAAGACCTGAAAACGTGGACGGCGGCGGACATGGCGGCGCAGATCACCCGACGC AAGTGGGAGCAGAGTGGTGCTGCAGAGCATTACAAGGCCTACCTGGAGGGCGAG TGCGTGGAGTGGCTCCACAGATACCTGAAGAACGGGAACGCGACGCTGCTGCGC ACAGATTCCCCAAAGGCACATGTGACCCATCACCCCAGATCTAAAGGTGAAGTCA CCCTGAGGTGCTGGGCCCTGGGCTTCTACCCTGCTGACATCACCCTGACCTGGCA GTTGAATGGGGAGGAGCTGACCCAGGACATGGAGCTTGTGGAGACCAGGCCTGC AGGGGATGGAACCTTCCAGAAGTGGGCATCTGTGGTGGTGCCTCTTGGGAAGGA GCAGAATTACACATGCCGTGTGTACCATGAGGGGCTGCCTGAGCCCCTCACCCTG AGATGGGAGCCTGCGGCCGCGGGTGGCGGTCTGAACGACATCTTCGAGGCTCAG AAAATCGAATGGCACGAACATCATCACCACCATCACCACCATTAA
Differential Scanning Fluorimetry
All H-2Db proteins were diluted to 1 μM in HBS (10 mM HEPES pH 7.2, 150 mM NaCl) in the presence of Sypro Orange dye (Thermo-Fisher S6650) diluted 1000-fold from its 5,000X stock to 5X. 20 μL of each protein:dye mixture were then placed in triplicate in a Bio-Rad CFX384 Real-Time PCR system. The proteins were exposed to increasing temperature from 20o-95oC at 1 degree/minute increments, and fluorescence was monitored at 525 nm wavelength. The protein melting temperature (Tm) was determined by calculating the minimum of the -dF/dt measurement at 525 nm as previously described (33).
Crystallization, structural determination, and refinement
TRP1-M9- and K8-single-chain trimer proteins were concentrated to 10-15 mg/mL. Initial screening was conducted using the PACT premier and JCSG+ crystallization screens (Hampton Research). 100 nL of each condition in the crystallization screens were
individually combined with 100 nL of protein in sitting drops using a Phenix crystallization robot (Art Robbins). Crystals were then further optimized in 1 μL + 1 μL protein:crystallant mixture sitting drops. For the TRP1-M9 single-chain trimer, crystals formed in 16% PEG-6000, 200 mM LiCl, and 100 mM Tris-HCl (pH 8.0). For the K8 single-chain trimer, crystals formed in 30% PEG-1500 and 100 mM MIB buffer (Hampton Research), pH 7.0. Crystals were flash frozen in liquid nitrogen in crystallant supplemented with 20-25% ethylene glycol.
A
uthor Man
uscr
ipt
A
uthor Man
uscr
ipt
A
uthor Man
uscr
ipt
A
uthor Man
uscr
ipt
For TRP1-M9, X-ray diffraction data was collected at the MIT Structural Biology Service Center using a Rigaku Micromax-007H-HF X-ray source and collected via a Rigaku Saturn 944 CCD. For K8, data was collected at Advanced Photon Source (APS) beamline 24-ID-E via an Eiger X 16M detector. Data were then indexed, integrated, and scaled using XDS and XSCALE (34).
Structures were solved via molecular replacement using the program Phaser (35). The molecular replacement search models used were a previously solved H-2Db structure (PDB ID: 4HUU) (36), with the α1α2, α3, and β2M domains each placed separately. The peptide was not included when solving the structure to avoid model bias. Manual model building of the peptide was performed in COOT followed by rounds of refinement using Phenix (37, 38). Simulated annealing composite omit maps were generated using Phenix (38). Structures were visualized and figures made using PYMOL (The PyMOL Molecular Graphics System, Version 2.0 Schrödinger, LLC).
Accession numbers
TRP1-M9-H-2Db and TRP1-K8-H-2Db coordinates and structure factors are deposited in the Protein Data Bank (PDB) under accession numbers 6MP0 and 6MP1, respectively.
Statistics
Unpaired student’s t test with Welch’s correction was used throughout. Error bars are SD, p values <0.05 after Bonferroni correction were considered significant. Data were analyzed using Graphpad Prism software.
Results
TRP1-altered peptide ligand K8 is a weak agonist that binds poorly to MHC class I
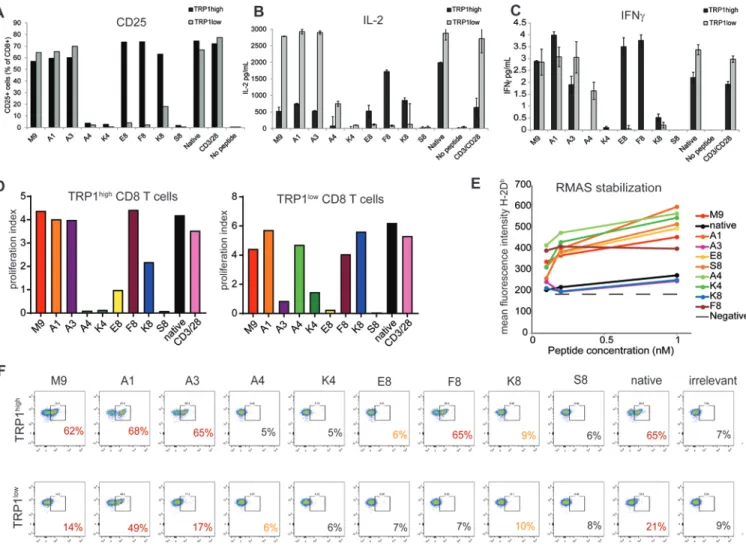
Using the heteroclytic TRP1 peptide as our reference (TRP1-M9), we generated a panel of altered peptide ligands with single amino acid substitutions in the non-anchor residues (39, 40). We used this peptide library to stimulate CD8+ T cells derived from TRP1high or TRP1low transnuclear mice (9). As predicted, several of these had abolished recognition by both TRP1high and TRP1low TCRs, and selective agonists of each TCR were also identified (Table 1 and Fig. 1A-D). One peptide, K8, was weakly agonistic for both TRP1high and TRP1low TCRs, resulting in robust proliferation but diminished CD25 expression and diminished IL2 and IFNγ production from both TCR clonotypes (Fig. 1A-D). Given the complete absence of sequence similarity between TRP1high and TRP1low TCRα and TCRβ CDR3 regions (9), we had not expected to find peptides that had diminished recognition to a similar extent between the two different TCRs. Weak agonists that bind strongly to TCRs but weakly to the MHC have been reported (41). To determine whether K8 bound to H-2Db, we performed an RMAS stabilization assay (Fig. 1E). RMAS cells are deficient in the peptide transport complex TAP, and, therefore, cannot properly stabilize MHC class I peptide complexes on their cell surface (29). Exogenously added peptides can compensate for this defect, leading to surface display of H-2Db that is directly proportional to the binding capabilities of the added peptide. Addition of TRP1 altered peptides resulted in stabilization of surface H-2Db, consistent with the peptides being H-2Db binders. As
A
uthor Man
uscr
ipt
A
uthor Man
uscr
ipt
A
uthor Man
uscr
ipt
A
uthor Man
uscr
ipt
expected, native TRP1 peptide with its 9th position alanine performed poorly in the RMAS stabilization assay, whereas TRP1-M9 peptide and most of the other altered peptide ligands stabilized H2-Db expression on RMAS cells, consistent with the alterations affecting non-anchor residues. K8 and A3 peptides, however, bound poorly to H-2Db, despite the mutations being in predicted TCR contact sites. In the case of A3, suboptimal H-2Db binding was compensated for by increased affinity for the TCR, as A3 tetramers were able to stain both TRP1high and TRP1low cells (Fig. 1F). K8 tetramers, however, failed to stain either TRP1high or TRP1low T cells, suggesting that this peptide is poorly presented by H-2Db and engages both TRP1high and TRP1low TCRs with moderate to low affinity (Fig. 1G).
Biophysical and structural analyses of K8 reveals destabilized binding to H-2Db
Although P8 is predicted to be a solvent-exposed, TCR-contact residue, class I MHCs can accommodate a distribution of peptide lengths (42), and mutations within a peptide can cause unpredicted changes in overall peptide geometry in the MHC groove, including changing the TCR contact epitope (22). Therefore, to verify the results from the RMAS stabilization assay (Fig. 1F) and to better understand how a point mutation might destabilize binding to H-2Db, we conducted a series of structural and biophysical studies comparing recombinantly expressed H-2Db bound to either the TRP1-M9 or K8 peptides. We first set out to structurally characterize the TRP1-M9 and K8 peptides bound to H-2Db via X-ray crystallography. Because MHCs refolded from bacterial inclusion bodies and exogenously loaded with peptide did not readily crystallize, we expressed insect cell peptide-β2M-H-2Db ‘single-chain trimers’ that contain MHC molecules physically tethered to the peptide via a glycine-serine linker to ensure that even weakly-binding peptides could be stably presented (30). With these constructs, we crystalized and obtained the structures of the K8 and TRP1-M9 single-chain trimer constructs (Fig. 2 and Supplementary Table S1). When the structures of K8 and TRP1-M9 were compared, it was observed that both peptides were presented in the MHC peptide binding groove in a canonical orientation, with the P2, P5, and P9 positions serving as MHC-contacting ‘anchor’ residues. Essentially no global alterations to MHC structure (the RMSD between H-2Db in each structure was 1.38 Å), the peptide’s backbone, or any side change conformation aside from the defining mutation at P8 was observed (Fig. 2A and Supplementary Fig. S1A-B). These structures, therefore, suggest that no gross alteration in peptide presentation exists and that the alteration at P8 is likely the cause of the observed difference in peptide stability.
We further compared the peptides using a simulated annealing composite omit map, and observed the electron density of the K8 peptide was substantially worse at the P4, P6, and P8 side chains, as well as the P8 peptide backbone (Fig. 2B). However, because K8 and TRP1-M9 crystallized in different crystal forms (Table 1), it was difficult to establish a causal relationship. Our structural and biophysical analyses indicated that it was the difference in contact between H-2Db and the solvent-exposed ‘TCR contact’ residue P8 that drove the differences in peptide presentation. Although the P8 position was exposed to solvent, it still made contact with amino acids on the MHC helices (Supplementary Fig. S1C), potentially providing a mechanism for the observed differences.
A
uthor Man
uscr
ipt
A
uthor Man
uscr
ipt
A
uthor Man
uscr
ipt
A
uthor Man
uscr
ipt
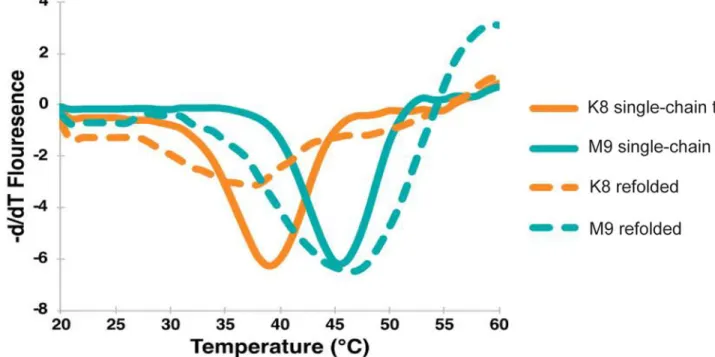
Because we did not observe any gross alterations to peptide conformation and to ensure linking the peptide and MHC did not inadvertently affect the noted peptide stability changes (Fig. 1), we analyzed each pMHC by determining their Tm via differential scanning
fluorimetry (DSF), a method that enables accurate determination of protein folding and stability (43) and has been shown to correlate with other measurements of pMHC stability, such as peptide half-max inhibitory concentration (IC50) (33). DSF measurements found the H-2Db-TRP1-M9 single-chain trimer had a Tm of 45.5oC, whereas the H-2Db-TRP1-K8 single-chain trimer had a Tm of 39.5oC (Fig. 3), demonstrating the constructs used for crystallography retained a stability difference despite their superimposable structures (Fig. 2). Refolded MHC loaded with exogenously loaded peptide showed similar measurements to the peptide-linked single-chain trimers (Fig. 2), additionally suggesting that the stability difference between the peptides is not altered by peptide linkage. These differences
confirmed the results of the RMAS stabilization assay (Fig. 1F), and further demonstrated an alteration of the peptide’s ability to bind to MHC caused by the P8 Tyr-Lys mutation, despite no gross structural changes (Fig. 2).
K8 stimulation of TRP1high or TRP1low CD8+ T cells leads to an altered activation profile
To determine whether the stability of peptide binding to MHC affected the functional properties of stimulated CD8+ T cells, we activated TRP1high or TRP1low CD8 T cells in vitro with either TRP1-M9 or K8 peptides. Cytokine production was increased in TRP1-M9 activated cultures, regardless of which TCR was present (Fig. 4A). Transcriptional analysis likewise showed a signature of K8 activation that was distinct from activation with TRP1-M9 peptide. Fig. 4B shows a heat map of differentially expressed genes between TRP1-TRP1-M9- and K8-stimulated conditions, with OX40 (Tnfrsf4), Nur77 (Nr4a1), IFNγ, and PD-1 (Pdcd1) increased in TRP1-M9 conditions and cell trafficking molecules and granzyme A (Gzma) having higher expression in K8-stimulated conditions. Overall, gene signature enrichment analysis confirmed higher IL2/STAT5 signaling in TRP1-M9-stimulated cells, but higher interferon signaling and chemokine signaling in K8-stimulated cells (Fig. 4C). In addition to its role in T-cell exhaustion, PD-1 is an acute activation marker that is upregulated on activated T cells. However, PD-1 expression remained low on K8-stimulated TRP1high and TRP1low cells, even at high peptide concentrations (Fig. 5A-B). Although TRP1-M9-stimulated cells may seem more activated, K8-stimulated cells displayed a skewed activation profile that could not be easily classified as simply less activated. We considered whether TRP1-M9 pulsed antigen presenting cells (APCs) simply contained more stable pMHC complexes than APCs pulsed with K8 at the same concentration. To evaluate this, we titrated TRP1-M9 and K8 peptides and found that lower concentrations of peptide resulted in overall less activated T cells in both conditions (Supplementary Fig. 2A). These results suggest that although our typical stimulations are performed at a relatively high concentration of peptide (1 nM), TRP1-M9-stimulated T cells are not dying of
activation-induced cell death. Increasing K8 concentrations to 100 nM restored maximal IL2 production but did not restore maximal IFNγ production, suggesting that even when controlling for pMHC density, K8 stimulation resulted in skewed activation (Supplementary Fig. 2B).
A
uthor Man
uscr
ipt
A
uthor Man
uscr
ipt
A
uthor Man
uscr
ipt
A
uthor Man
uscr
ipt
Overall proliferation was similar between both TRP1-M9- and K8-stimulated conditions (Fig. 1E and Fig. 5A, 5C). We examined activation over longer term in in vitro cultures and found that 4-6 days of in vitro culture showed equivalent proliferation and CD44 expression between TRP1-M9 and K8 activation, yet PD-1 expression remained low on K8-stimulated cells throughout the culture period (Fig. 5C-E). Therefore, K8 peptide could activate T cells, with a unique feature of diminished PD-1 expression.
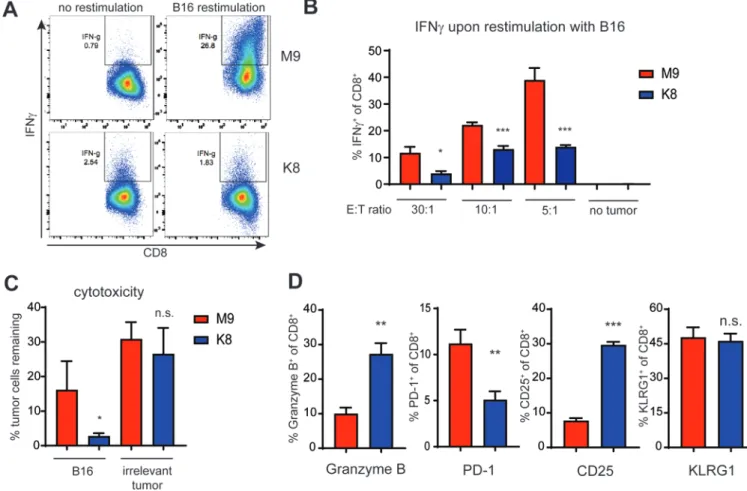
We next investigated the effect of priming TRP1high cells with either TRP1-M9 or K8 peptide on overall effector function. For these experiments, CD8+ T cells were cocultured with APCs and peptide for 48 hours, and then re-isolated with magnetic beads, washed, and plated in fresh media containing IL2 and no further peptide stimulation. TRP1-M9- or K8-primed CD8+ T cells were rested for one week to generate effector cells, and then re-stimulated with B16 melanoma cells expressing endogenous levels of TRP1 protein (Fig. 6). At every effector to target ratio, TRP1-M9-primed CD8+ T cells expressed more IFNγ than their K8-primed counterparts (Fig. 6A-B). However, K8-primed cells were more cytolytic, expressed higher levels of intracellular granzyme, and killed B16 melanoma cells more effectively than TRP1-M9-primed cells (Fig. 6C-D).
T-cell priming influences CD8+ T cell-effector functions in a mouse melanoma model
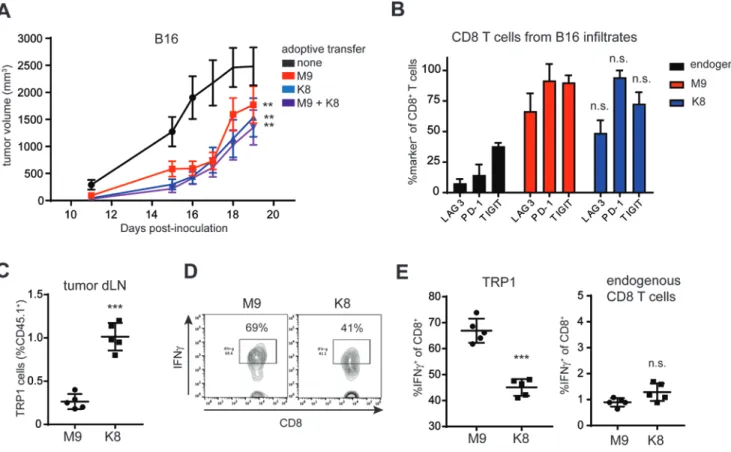
Given the seemingly divergent effector functions of K8- versus TRP1-M9-stimulated TRP1high cells in vitro, we next asked whether these functional differences were relevant in vivo. Adoptive transfer of 500,000 K8- or TRP1-M9-stimulated TRP1high CD8+ T cells into B16 tumor-bearing mice significantly delayed tumor growth (Fig. 7A). Adoptive transfer of the same total number of activated CD8+ T cells mixed at a 1:1 ratio (250,000 TRP1-M9 and 250,000 K8 stimulated cells) did not have a significantly different effect from transfer of either TRP1-M9- or K8-stimulated cells alone, suggesting that the two kinds of stimulated cells acted additively, rather than synergistically (Fig. 7A). Analysis of tumor infiltrating TRP1high cells showed equivalent levels of PD-1, LAG3, and TIGIT expression between TRP1-M9- and K8-primed conditions (Fig. 7B). Thus, although K8 priming led to consistently low PD-1 expression in vitro, PD-1 was restored in vivo, possibly due to interactions with native TRP1 peptide displayed on H-2Db in the tumor microenvironment. Cell-trafficking molecules, including sphingosine-1-phosphate receptor (S1pr1), were increased in K8-stimulated cells (Fig. 4B), which suggested altered localization of these cells in vivo. Mice with B16 tumors received an adoptive transfer of TRP1-M9- or K8-activated TRP1highCD45.1+ cells one week post-tumor inoculation, at a time point when tumors were approximately 50 mm3. Six days later, tumor draining lymph nodes were isolated, and transferred cells quantified based on their expression of the CD45.1 congenic marker. Three-fold more K8-stimulated cells were recovered from the tumor draining lymph nodes as ompared to TRP1-M9-stimulated cells (Fig. 7C). Consistent with in vitro
experiments, TRP1-M9-stimulated cells produced more IFNγ in tumor draining lymph nodes (Fig. 7D-E). No difference in IFNγ production was observed when gating on endogenous CD8+ T cells (Fig. 7E), suggesting that the increased IFNγ was a function of prior activation with the TRP1-M9 peptide rather than alterations in the microenvironment.
A
uthor Man
uscr
ipt
A
uthor Man
uscr
ipt
A
uthor Man
uscr
ipt
A
uthor Man
uscr
ipt
Discussion
The nuances of T-cell priming matter. Here, we showed that priming with peptide ligands differring by a single amino acid can imprint disparate fates on the resulting effector CD8+ T cells. Although priming with TRP1-M9 peptide led to predominantly cytokine-producing cells, priming with K8 peptide led to effector CD8+ T cells specializing in cytolytic function. CD8+ T cell effector subsets are less clearly defined than the well-known CD4+ T-cell subsets, yet we demonstrated not only that functionally distinct lineages can form, but also that the fate decisions made during priming can propagate over multiple cell divisions. To that point, phenotypic differences imparted during in vitro activation with TRP1-M9- versus K8-primed cells were maintained six days after adoptive transfer into B16 tumor-bearing mice.
How T cells mediate tumor rejection is still unclear. Although the role of CD8+ T cells in tumor control is well-documented, CD8+ T cells may act through their production of IFNγ, their direct cytolysis of tumor cells, or both. Previous reports have shown that growth inhibition via IFNγ can be equally as important as direct cytolysis (44). Acquired resistance to checkpoint blockade in both mice and humans is frequently mediated by the loss of signaling through the IFNγ receptor in tumor cells (45, 46). In our model, we showed preferential production of IFNγ by TRP1-M9-primed cells. We hypothesized that this IFNγ contributed to the overall control of tumor growth in vivo, although we did not exclude the possibility that TRP1-M9-primed cells were also engaging in direct cytolysis. Tumor-specific CD8+ T cells, particularly those of more moderate affinity, do not always produce multiple cytokines and have high expression of granzymes (47). Loss of this polyfunctional state has been assumed to be part of T-cell exhaustion, and in some cases, previously polyfunctional CD8+ T cells lose effector capacity as a result of signaling through co-inhibitory ligands, such as PD-1 or exposure to nutrient starvation or suppressive myeloid cells. A complementary hypothesis may be that CD8+ effector T cells become polarized to execute only one distinct effector function during priming. Here, we demonstrated, using T cells specific for a melanoma self-antigen, that fates are determined at the level of T-cell priming.
TRP1high and TRP1low T cells, by virtue of having been selected at random from a mouse during primary vaccination with a melanoma vaccine, represent physiologically achievable affinities of self-antigen reactive TCRs. Adoptive transfer of activated TRP1 cells alone does not cure mice with pre-established B16 melanoma (9), and attempts to use higher affinity T cells only improve responses to a certain point (10). Higher affinity priming leads to higher expression of PD-1 on activated cells, possibly explaining the paradox that vaccination with high-affinity peptides stimulates robust CD8+ T cell responses but impairs tumor control compared to vaccination with lower affinity peptides (48). PD-1 may also play a role in restraining cytolytic capacity of newly primed effector cells. In mice acutely infected with lymphocytic choriomeningitis virus (LCMV) Armstrong, early blockade of PD-1 led to increased granzyme B expression in virus-specific CD8+ T cells and increased viral clearance (49). Here, we found that K8-primed T cells, which do not acutely upregulate PD-1, similarly showed increased granzyme B expression and increased cytolytic capacity in the effector phase.
A
uthor Man
uscr
ipt
A
uthor Man
uscr
ipt
A
uthor Man
uscr
ipt
A
uthor Man
uscr
ipt
T-cell priming is influenced by multiple factors, including TCR affinity, but also contact time, the number and density of cognate MHC-peptide complexes, co-stimulation, and the local cytokine milieu. We used in vitro priming with equivalently activated APCs to investigate the role of the particular pMHC-TCR dynamics on T-cell priming. This three-molecule interaction was controlled on the TCR side by showing that two structurally distinct TCRs recognizing K8-H-2Db complexes led to the same lower PD-1 expression and skewed toward cytotoxicity. We, therefore, focused our attention on the pMHC interaction and discovered that K8 forms unusually unstable complexes with H-2Db.
Our results further showed the requirement of the entire peptide, rather than only the MHC anchor positions, in determining T-cell recognition and function. Although it has been established that peptide binding to the MHC is an important factor for antigenicity (12, 50) and that the interplay between affinities of neoantigens and unmutated self-antigens can affect anti-tumor responses (24, 25), our data suggested that even relatively subtle peptide alterations that do not obviously affect MHC anchor positions may affect immune response and effector phenotypes. These effects have been previously observed for both class I and class II MHCs (51, 52). Although individual point mutants did have large effects in isolation, the ‘TCR contact epitope’ as a whole made significant contact to the MHC and could, in aggregate, affect peptide presentation and the resulting T-cell responses. A previous report of influenza peptide binding to H-2Db examined MHC binding affinities upon single amino acid substitutions at all non-anchor positions and found that mutations to the TCR contact positions, such as position 8, had relatively modest, yet potentially impactful influences, on peptide stability (53, 54). The mutation we study here (Tyr to Lys in position 8) caused a 10-fold increase in IC50. Factors beyond changes to pMHC stability, including the overall rigidity of the pMHC complex, have also been observed and may potentially have similar effects, as we observed between TRP1-M9 and K8 (19, 55, 56). Collectively, these data showed the need to better understand and design peptide targets for immunotherapies because simply maximizing either peptide affinity for MHC or TCR effector response may not lead to a maximally effective antitumor response.
Supplementary Material
Refer to Web version on PubMed Central for supplementary material.
Acknowledgments:
We thank the MIT Structural Biology Service Center, Robert Grant and the Drennan Lab at MIT for their assistance in crystallographic data collection, and Engin Ozkan for his assistance with structural refinement. E.C-T. was funded by NIH T32CA207021. S.K.D. was funded by the Melanoma Research Alliance, the Pew Foundation, and the Claudia Adams Barr Program in Cancer Research. M.E.B was funded by NIH grant P30-CA14051, and support from the Packard Foundation, the V Foundation, and the American Association for Cancer Research.
Funding: E.C-T. was funded by NIH T32CA207021. S.K.D. was funded by the Melanoma Research Alliance, the
Pew Foundation, and the Claudia Adams Barr Program in Cancer Research. M.E.B was funded by NIH grant P30-CA14051, and support from the Packard Foundation, the V Foundation, and the American Association for Cancer Research
A
uthor Man
uscr
ipt
A
uthor Man
uscr
ipt
A
uthor Man
uscr
ipt
A
uthor Man
uscr
ipt
References
1. Kim HJ, and Cantor H 2014 CD4 T-cell subsets and tumor immunity: the helpful and the not-so-helpful. Cancer Immunol Res 2:91–98. [PubMed: 24778273]
2. Henrickson SE, Mempel TR, Mazo IB, Liu B, Artyomov MN, Zheng H, Peixoto A, Flynn MP, Senman B, Junt T, et al. 2008 T cell sensing of antigen dose governs interactive behavior with dendritic cells and sets a threshold for T cell activation. Nat Immunol 9:282–291. [PubMed: 18204450]
3. Zheng H, Jin B, Henrickson SE, Perelson AS, von Andrian UH, and Chakraborty AK 2008 How antigen quantity and quality determine T-cell decisions in lymphoid tissue. Mol Cell Biol 28:4040– 4051. [PubMed: 18426917]
4. Krummey SM, Martinez RJ, Andargachew R, Liu D, Wagener M, Kohlmeier JE, Evavold BD, Larsen CP, and Ford ML 2016 Low-Affinity Memory CD8+ T Cells Mediate Robust Heterologous Immunity. J Immunol 196:2838–2846. [PubMed: 26864034]
5. Knudson KM, Goplen NP, Cunningham CA, Daniels MA, and Teixeiro E 2013 Low-affinity T cells are programmed to maintain normal primary responses but are impaired in their recall to low-affinity ligands. Cell Rep 4:554–565. [PubMed: 23933258]
6. Knudson KM, Hamilton SE, Daniels MA, Jameson SC, and Teixeiro E 2013 Cutting edge: The signals for the generation of T cell memory are qualitatively different depending on TCR ligand strength. J Immunol 191:5797–5801. [PubMed: 24244018]
7. Teixeiro E, Daniels MA, Hamilton SE, Schrum AG, Bragado R, Jameson SC, and Palmer E 2009 Different T cell receptor signals determine CD8+ memory versus effector development. Science 323:502–505. [PubMed: 19164748]
8. La Gruta NL, Turner SJ, and Doherty PC 2004 Hierarchies in cytokine expression profiles for acute and resolving influenza virus-specific CD8+ T cell responses: correlation of cytokine profile and TCR avidity. J Immunol 172:5553–5560. [PubMed: 15100298]
9. Dougan SK, Dougan M, Kim J, Turner JA, Ogata S, Cho HI, Jaenisch R, Celis E, and Ploegh HL 2013 Transnuclear TRP1-specific CD8 T cells with high or low affinity TCRs show equivalent antitumor activity. Cancer Immunol Res 1:99–111. [PubMed: 24459675]
10. Zhong S, Malecek K, Johnson LA, Yu Z, Vega-Saenz de Miera E, Darvishian F, McGary K, Huang K, Boyer J, Corse E, et al. 2013 T-cell receptor affinity and avidity defines antitumor response and autoimmunity in T-cell immunotherapy. Proc Natl Acad Sci U S A 110:6973–6978. [PubMed: 23576742]
11. Hacohen N, Fritsch EF, Carter TA, Lander ES, and Wu CJ 2013 Getting personal with neoantigen-based therapeutic cancer vaccines. Cancer Immunol Res 1:11–15. [PubMed: 24777245]
12. Cho HI, and Celis E 2009 Optimized peptide vaccines eliciting extensive CD8 T-cell responses with therapeutic antitumor effects. Cancer Res 69:9012–9019. [PubMed: 19903852]
13. Achour A, Michaelsson J, Harris RA, Odeberg J, Grufman P, Sandberg JK, Levitsky V, Karre K, Sandalova T, and Schneider G 2002 A structural basis for LCMV immune evasion: subversion of H-2D(b) and H-2K(b) presentation of gp33 revealed by comparative crystal structure.Analyses. Immunity 17:757–768. [PubMed: 12479822]
14. Cho HI, Jung SH, Sohn HJ, Celis E, and Kim TG 2015 An optimized peptide vaccine strategy capable of inducing multivalent CD8(+) T cell responses with potent antitumor effects. Oncoimmunology 4:e1043504. [PubMed: 26451316]
15. Chen JL, Stewart-Jones G, Bossi G, Lissin NM, Wooldridge L, Choi EM, Held G, Dunbar PR, Esnouf RM, Sami M, et al. 2005 Structural and kinetic basis for heightened immunogenicity of T cell vaccines. J Exp Med 201:1243–1255. [PubMed: 15837811]
16. van Stipdonk MJ, Badia-Martinez D, Sluijter M, Offringa R, van Hall T, and Achour A 2009 Design of agonistic altered peptides for the robust induction of CTL directed towards H-2Db in complex with the melanoma-associated epitope gp100. Cancer Res 69:7784–7792. [PubMed: 19789338]
17. Hafstrand I, Doorduijn EM, Duru AD, Buratto J, Oliveira CC, Sandalova T, van Hall T, and Achour A 2016 The MHC Class I Cancer-Associated Neoepitope Trh4 Linked with Impaired
A
uthor Man
uscr
ipt
A
uthor Man
uscr
ipt
A
uthor Man
uscr
ipt
A
uthor Man
uscr
ipt
Peptide Processing Induces a Unique Noncanonical TCR Conformer. J Immunol 196:2327–2334. [PubMed: 26800871]
18. Chen S, Li Y, Depontieu FR, McMiller TL, English AM, Shabanowitz J, Kos F, Sidney J, Sette A, Rosenberg SA, et al. 2013 Structure-based design of altered MHC class II-restricted peptide ligands with heterogeneous immunogenicity. J Immunol 191:5097–5106. [PubMed: 24108701] 19. Hafstrand I, Doorduijn EM, Sun R, Talyzina A, Sluijter M, Pellegrino S, Sandalova T, Duru AD,
van Hall T, and Achour A 2018 The Immunogenicity of a Proline-Substituted Altered Peptide Ligand toward the Cancer-Associated TEIPP Neoepitope Trh4 Is Unrelated to Complex Stability. J Immunol 200:2860–2868. [PubMed: 29507106]
20. Aleksic M, Dushek O, Zhang H, Shenderov E, Chen JL, Cerundolo V, Coombs D, and van der Merwe PA 2010 Dependence of T cell antigen recognition on T cell receptor-peptide MHC confinement time. Immunity 32:163–174. [PubMed: 20137987]
21. Stone JD, Chervin AS, and Kranz DM 2009 T-cell receptor binding affinities and kinetics: impact on T-cell activity and specificity. Immunology 126:165–176. [PubMed: 19125887]
22. Adams JJ, Narayanan S, Liu B, Birnbaum ME, Kruse AC, Bowerman NA, Chen W, Levin AM, Connolly JM, Zhu C, et al. 2011 T cell receptor signaling is limited by docking geometry to peptide-major histocompatibility complex. Immunity 35:681–693. [PubMed: 22101157] 23. Schubert DA, Gordo S, Sabatino JJ, Jr., Vardhana S, Gagnon E, Sethi DK, Seth NP, Choudhuri K,
Reijonen H, Nepom GT, et al. 2012 Self-reactive human CD4 T cell clones form unusual immunological synapses. J Exp Med 209:335–352. [PubMed: 22312112]
24. Balachandran VP, Luksza M, Zhao JN, Makarov V, Moral JA, Remark R, Herbst B, Askan G, Bhanot U, Senbabaoglu Y, et al. 2017 Identification of unique neoantigen qualities in long-term survivors of pancreatic cancer. Nature 551:512–516. [PubMed: 29132146]
25. Rech AJ, Balli D, Mantero A, Ishwaran H, Nathanson KL, Stanger BZ, and Vonderheide RH 2018 Tumor Immunity and Survival as a Function of Alternative Neopeptides in Human Cancer. Cancer Immunol Res.
26. Tyler PM, Servos MM, de Vries RC, Klebanov B, Kashyap T, Sacham S, Landesman Y, Dougan M, and Dougan SK 2017 Clinical Dosing Regimen of Selinexor Maintains Normal Immune Homeostasis and T-cell Effector Function in Mice: Implications for Combination with Immunotherapy. Mol Cancer Ther 16:428–439. [PubMed: 28148714]
27. Grotenbreg GM, Roan NR, Guillen E, Meijers R, Wang JH, Bell GW, Starnbach MN, and Ploegh HL 2008 Discovery of CD8+ T cell epitopes in Chlamydia trachomatis infection through use of caged class I MHC tetramers. Proc Natl Acad Sci U S A 105:3831–3836. [PubMed: 18245382] 28. Dougan M, Ingram JR, Jeong HJ, Mosaheb MM, Bruck PT, Ali L, Pishesha N, Blomberg O, Tyler
PM, Servos MM, et al. 2018 Targeting Cytokine Therapy to the Pancreatic Tumor Microenvironment Using PD-L1-Specific VHHs. Cancer Immunol Res.
29. Ljunggren HG, Stam NJ, Ohlen C, Neefjes JJ, Hoglund P, Heemels MT, Bastin J, Schumacher TN, Townsend A, Karre K, et al. 1990 Empty MHC class I molecules come out in the cold. Nature 346:476–480. [PubMed: 2198471]
30. Palmowski MJ, Parker M, Choudhuri K, Chiu C, Callan MF, van der Merwe PA, Cerundolo V, and Gould KG 2009 A single-chain H-2Db molecule presenting an influenza virus nucleoprotein epitope shows enhanced ability at stimulating CD8+ T cell responses in vivo. J Immunol 182:4565–4571. [PubMed: 19342630]
31. Birnbaum ME, Mendoza JL, Sethi DK, Dong S, Glanville J, Dobbins J, Ozkan E, Davis MM, Wucherpfennig KW, and Garcia KC 2014 Deconstructing the peptide-MHC specificity of T cell recognition. Cell 157:1073–1087. [PubMed: 24855945]
32. Garboczi DN, Hung DT, and Wiley DC 1992 HLA-A2-peptide complexes: refolding and crystallization of molecules expressed in Escherichia coli and complexed with single antigenic peptides. Proc Natl Acad Sci U S A 89:3429–3433. [PubMed: 1565634]
33. Hellman LM, Yin L, Wang Y, Blevins SJ, Riley TP, Belden OS, Spear TT, Nishimura MI, Stern LJ, and Baker BM 2016 Differential scanning fluorimetry based assessments of the thermal and kinetic stability of peptide-MHC complexes. J Immunol Methods 432:95–101. [PubMed: 26906089]
34. Kabsch W 2010 Xds. Acta Crystallogr D Biol Crystallogr 66:125–132. [PubMed: 20124692]
A
uthor Man
uscr
ipt
A
uthor Man
uscr
ipt
A
uthor Man
uscr
ipt
A
uthor Man
uscr
ipt
35. McCoy AJ, Grosse-Kunstleve RW, Adams PD, Winn MD, Storoni LC, and Read RJ 2007 Phaser crystallographic software. J Appl Crystallogr 40:658–674. [PubMed: 19461840]
36. Valkenburg SA, Gras S, Guillonneau C, Hatton LA, Bird NA, Twist KA, Halim H, Jackson DC, Purcell AW, Turner SJ, et al. 2013 Preemptive priming readily overcomes structure-based mechanisms of virus escape. Proc Natl Acad Sci U S A 110:5570–5575. [PubMed: 23493558] 37. Emsley P, Lohkamp B, Scott WG, and Cowtan K 2010 Features and development of Coot. Acta
Crystallogr D Biol Crystallogr 66:486–501. [PubMed: 20383002]
38. Adams PD, Afonine PV, Bunkoczi G, Chen VB, Davis IW, Echols N, Headd JJ, Hung LW, Kapral GJ, Grosse-Kunstleve RW, et al. 2010 PHENIX: a comprehensive Python-based system for macromolecular structure solution. Acta Crystallogr D Biol Crystallogr 66:213–221. [PubMed: 20124702]
39. Hudrisier D, Mazarguil H, Laval F, Oldstone MB, and Gairin JE 1996 Binding of viral antigens to major histocompatibility complex class I H-2Db molecules is controlled by dominant negative elements at peptide non-anchor residues. Implications for peptide selection and presentation. J Biol Chem 271:17829–17836. [PubMed: 8663374]
40. Dura B, Dougan SK, Barisa M, Hoehl MM, Lo CT, Ploegh HL, and Voldman J 2015 Profiling lymphocyte interactions at the single-cell level by microfluidic cell pairing. Nat Commun 6:5940. [PubMed: 25585172]
41. Holmberg K, Mariathasan S, Ohteki T, Ohashi PS, and Gascoigne NR 2003 TCR binding kinetics measured with MHC class I tetramers reveal a positive selecting peptide with relatively high affinity for TCR. J Immunol 171:2427–2434. [PubMed: 12928390]
42. Abelin JG, Keskin DB, Sarkizova S, Hartigan CR, Zhang W, Sidney J, Stevens J, Lane W, Zhang GL, Eisenhaure TM, et al. 2017 Mass Spectrometry Profiling of HLA-Associated Peptidomes in Mono-allelic Cells Enables More Accurate Epitope Prediction. Immunity 46:315–326. [PubMed: 28228285]
43. Niesen FH, Berglund H, and Vedadi M 2007 The use of differential scanning fluorimetry to detect ligand interactions that promote protein stability. Nat Protoc 2:2212–2221. [PubMed: 17853878] 44. Matsushita H, Hosoi A, Ueha S, Abe J, Fujieda N, Tomura M, Maekawa R, Matsushima K, Ohara
O, and Kakimi K 2015 Cytotoxic T lymphocytes block tumor growth both by lytic activity and IFNgamma-dependent cell-cycle arrest. Cancer Immunol Res 3:26–36. [PubMed: 25127875] 45. Gao J, Shi LZ, Zhao H, Chen J, Xiong L, He Q, Chen T, Roszik J, Bernatchez C, Woodman SE, et
al. 2016 Loss of IFN-gamma Pathway Genes in Tumor Cells as a Mechanism of Resistance to Anti-CTLA-4 Therapy. Cell 167:397–404 e399. [PubMed: 27667683]
46. Manguso RT, Pope HW, Zimmer MD, Brown FD, Yates KB, Miller BC, Collins NB, Bi K, LaFleur MW, Juneja VR, et al. 2017 In vivo CRISPR screening identifies Ptpn2 as a cancer
immunotherapy target. Nature 547:413–418. [PubMed: 28723893]
47. Wilde S, Sommermeyer D, Leisegang M, Frankenberger B, Mosetter B, Uckert W, and Schendel DJ 2012 Human antitumor CD8+ T cells producing Th1 polycytokines show superior antigen sensitivity and tumor recognition. J Immunol 189:598–605. [PubMed: 22689880]
48. Zahm CD, Colluru VT, and McNeel DG 2017 Vaccination with High-Affinity Epitopes Impairs Antitumor Efficacy by Increasing PD-1 Expression on CD8(+) T Cells. Cancer Immunol Res 5:630–641. [PubMed: 28634215]
49. Ahn E, Araki K, Hashimoto M, Li W, Riley JL, Cheung J, Sharpe AH, Freeman GJ, Irving BA, and Ahmed R 2018 Role of PD-1 during effector CD8 T cell differentiation. Proc Natl Acad Sci U S A.
50. Harndahl M, Rasmussen M, Roder G, Dalgaard Pedersen I, Sorensen M, Nielsen M, and Buus S 2012 Peptide-MHC class I stability is a better predictor than peptide affinity of CTL
immunogenicity. Eur J Immunol 42:1405–1416. [PubMed: 22678897]
51. Schlueter CJ, Manning TC, Schodin BA, and Kranz DM 1996 A residue in the center of peptide QL9 affects binding to both Ld and the T cell receptor. J Immunol 157:4478–4485. [PubMed: 8906825]
52. Anderson MW, and Gorski J 2003 Cutting edge: TCR contacts as anchors: effects on affinity and HLA-DM stability. J Immunol 171:5683–5687. [PubMed: 14634075]
A
uthor Man
uscr
ipt
A
uthor Man
uscr
ipt
A
uthor Man
uscr
ipt
A
uthor Man
uscr
ipt
53. Sigal LJ, and Wylie DE 1996 Role of non-anchor residues of Db-restricted peptides in class I binding and TCR triggering. Mol Immunol 33:1323–1333. [PubMed: 9171892]
54. Sigal LJ, Goebel P, and Wylie DE 1995 Db-binding peptides from influenza virus: effect of non-anchor residues on stability and immunodominance. Mol Immunol 32:623–632. [PubMed: 7643854]
55. Uchtenhagen H, Abualrous ET, Stahl E, Allerbring EB, Sluijter M, Zacharias M, Sandalova T, van Hall T, Springer S, Nygren PA, et al. 2013 Proline substitution independently enhances H-2D(b) complex stabilization and TCR recognition of melanoma-associated peptides. Eur J Immunol 43:3051–3060. [PubMed: 23939911]
56. Plaksin D, Polakova K, Mage MG, and Margulies DH 1997 Rigidification of the alpha2 helix of an MHC class I molecule by a valine to proline mutation in position 165 does not prevent peptide-specific antigen presentation. J Immunol 159:4408–4414. [PubMed: 9379039]
A
uthor Man
uscr
ipt
A
uthor Man
uscr
ipt
A
uthor Man
uscr
ipt
A
uthor Man
uscr
ipt
Figure 1: A spectrum of TRP1 altered peptide ligands identifies agonists, selective agonists, and null peptides.
A-C) CD8+ T cells were isolated from spleens and lymph nodes of TRP1high or TRP1low mice and cocultured at a 1:1 ratio with CD40-activated B cell blasts and 1 ng/mL of the indicated peptides. A) Cells were stained with antibodies to CD8 and CD25 and analyzed by flow cytometry 48 hours post-activation. B) IL2 and C) IFNγ in culture supernatants were quantified by ELISA after 48 hours. Error bars are ±SD. All data are representative of at least 3 independent replicates. D) TRP1high and TRP1low CD8+ T cells were labeled with Celltrace Violet and cocultured at a 1:1 ratio with CD40-activated B cell blasts and 1 nM of the indicated peptides for 72 hours. Cells were stained with antibodies to CD8 and analyzed by flow cytometry. Proliferation index was quantified as the number of mitotic events divided by the number of progenitor cells. All data are representative of at least 3
independent replicates. E) 106 RMAS cells were incubated at 30oC overnight. TRP1 altered peptides were added at the indicated concentrations, and cells were incubated at 37oC for an additional 3 hours. Peptide binding was assessed by surface stabilization of H-2Db measured by flow cytometry. F) H-2Db tetramers containing a photocleavable ligand were photo-exchanged in the presence of the indicated peptides. An irrelevant peptide was included as a negative control. Total spleen cells from TRP1high and TRP1low mice were stained with antibodies to CD8 and the indicated tetramers and analyzed by flow cytometry. Plots are
A
uthor Man
uscr
ipt
A
uthor Man
uscr
ipt
A
uthor Man
uscr
ipt
A
uthor Man
uscr
ipt
gated on CD8+ cells and are representative of 5 mice across 2 independent experiments. Percentages of tetramer+ cells are shown in bold. Red numbers: positive tetramer staining, black indicates lack of tetramer staining. Yellow numbers: conditions where the peptide activated TRP1 T cells and no tetramer staining was observed.
A
uthor Man
uscr
ipt
A
uthor Man
uscr
ipt
A
uthor Man
uscr
ipt
A
uthor Man
uscr
ipt
Figure 2: Structural characterization of H2-Db/TRP1-M9 and H2-Db/K8 single-chain trimers via X-ray crystallography.
A) Structural alignment of H2-Db/TRP1-M9 and H2-Db/K8 showed no large-scale structural rearrangements (left). The overall peptide main chain orientation and side chain
conformations were essentially superimposable between each structure (right). B) Simulated annealing/composite omit maps (contoured at 1.5σ) showed substantially worse electron density for the C-terminus of the K8 peptide (particularly at the Lys 8 side chain and peptide backbone) relative to TRP1-M9, indicating decreased peptide stability.
A
uthor Man
uscr
ipt
A
uthor Man
uscr
ipt
A
uthor Man
uscr
ipt
A
uthor Man
uscr
ipt
Figure 3: ThermoFluor thermal stability shift assay shows a large difference in protein stability. H2-Db/K8 single-chain trimer (orange, solid line) demonstrated a Tm 6 degrees lower than that of H2-Db/TRP1-M9 (teal, solid line) (39.5oC vs. 45.5oC). When unlinked peptide (dashed line) was compared to peptides linked as a single-chain trimer (solid line), a similar Tm was observed for each peptide studied.
A
uthor Man
uscr
ipt
A
uthor Man
uscr
ipt
A
uthor Man
uscr
ipt
A
uthor Man
uscr
ipt
Figure 4: Stimulation with TRP1-M9 peptide generates stronger cytokine output and differential gene expression from TRP1high and TRP1low cells compared to K8 peptide.
A) TRP1high or TRP1low CD8+ T cells were cultured at a 1:1 ratio with CD40-activated B cell blasts and 1 nM of either TRP1-M9 or K8 peptides for 48 hours. Culture supernatants were collected and analyzed by cytokine bead array. n=3 biological replicates. Heat map shows log2 expression values (pg/mL). B) Total RNA was collected from TRP1 CD8+ T cells stimulated as in A, and subjected to RNAseq analysis. Genes found to be significantly differentially expressed between TRP1-M9- and K8-activated T cells are presented as a heatmap. Genes of particular relevance to T-cell effector function are in bold. C) Top 25 enriched gene sets identified by pre-ranked GSEA in K8-activated T cells (blue) vs. TRP1-M9-activated T cells (red).
A
uthor Man
uscr
ipt
A
uthor Man
uscr
ipt
A
uthor Man
uscr
ipt
A
uthor Man
uscr
ipt
Figure 5: Weak agonist peptide K8 induces robust proliferation from TRP1high and TRP1low cells without acute induction of PD-1.
A) TRP1low CD8+ T cells were labeled with Celltrace Violet and cocultured at a 1:1 ratio with CD40-activated B cell blasts and the indicated peptides at 1 μg/mL for 72 hours. Cells were stained with antibodies to CD8, PD-1, and CD25 and analyzed by flow cytometry. B) TRP1high or TRP1low CD8+ T cells were cocultured at a 1:1 ratio with CD40-activated B cell blasts pulsed with either TRP1-M9 or K8 peptides at the indicated concentrations. PD-1 expression was determined by flow cytometry. N=4/group. C) TRP1high CD8+ T cells were labeled with CFSE and cocultured at a 1:1 ratio with CD40-activated B cell blasts pulsed with 1 μg/mL TRP1-M9 or K8 for the indicated times. Proliferation was assessed by flow cytometry. D-E) CD8+ T cells from C were stained with the indicated antibodies and analyzed by flow cytometry. N=3/group. Error bars are +SD. P values were calculated by ratio paired t test across all three time points.