HAL Id: hal-00295772
https://hal.archives-ouvertes.fr/hal-00295772
Submitted on 2 Nov 2005
HAL is a multi-disciplinary open access
archive for the deposit and dissemination of
sci-entific research documents, whether they are
pub-lished or not. The documents may come from
teaching and research institutions in France or
abroad, or from public or private research centers.
L’archive ouverte pluridisciplinaire HAL, est
destinée au dépôt et à la diffusion de documents
scientifiques de niveau recherche, publiés ou non,
émanant des établissements d’enseignement et de
recherche français ou étrangers, des laboratoires
publics ou privés.
Atmospheric bromoform at Mace Head, Ireland:
seasonality and evidence for a peatland source
L. J. Carpenter, D. J. Wevill, S. O’Doherty, G. Spain, P. G. Simmonds
To cite this version:
L. J. Carpenter, D. J. Wevill, S. O’Doherty, G. Spain, P. G. Simmonds. Atmospheric bromoform
at Mace Head, Ireland: seasonality and evidence for a peatland source. Atmospheric Chemistry and
Physics, European Geosciences Union, 2005, 5 (11), pp.2927-2934. �hal-00295772�
www.atmos-chem-phys.org/acp/5/2927/ SRef-ID: 1680-7324/acp/2005-5-2927 European Geosciences Union
Chemistry
and Physics
Atmospheric bromoform at Mace Head, Ireland: seasonality and
evidence for a peatland source
L. J. Carpenter1, D. J. Wevill1, S. O’Doherty2, G. Spain3, and P. G. Simmonds2
1Department of Chemistry, University of York, York, YO10 5DD, UK
2School of Chemistry, University of Bristol, Bristol, BS8 1TS, UK
3Department of Physics, NUIGalway, Galway, Ireland
Received: 21 June 2005 – Published in Atmos. Chem. Phys. Discuss.: 15 August 2005 Revised: 21 October 2005 – Accepted: 21 October 2005 – Published: 2 November 2005
Abstract. In situ atmospheric observations of bromoform
(CHBr3)made over a 2.5 year period at Mace Head,
Ire-land from May 2001- Dec 2003, including during the NAM-BLEX (North Atlantic Marine Boundary Layer Experi-ment) campaign, show broad maxima from spring until au-tumn and winter minima, with mixing ratios of 5.3+1.0 pptv (mid March - mid October) and 1.8+0.8 pptv
(December-February). This indicates that, unlike CHCl3, which has a
summer minimum and winter maximum at Mace Head,
lo-cal biologilo-cal sources of CHBr3have a greater influence on
the atmospheric data than photochemical decay during long-range transport. The emission sources are predominantly macroalgal, but we find evidence for a small terrestrial flux from peatland ecosystems, which so far has not been
ac-counted for in the CHBr3budget. Sharp increases in CHCl3
and CHBr3 concentrations and decreases in O3
concentra-tions occurred at night when the wind direction switched from an ocean- to a land-based sector (land breeze) and the
wind speed dropped to below 5 ms−1. These observations
infer a shallow atmospheric boundary layer with increased
O3deposition and concentration of local emissions of both
CHCl3and CHBr3. The ratio of 1CHCl3/1CHBr3 varied
strongly according to the prevailing wind direction; from
0.60+0.15 in south-easterly (100–170◦)and northerly (340–
20◦)air to 2.5+0.4 in north-easterly (40–70◦)air. Of these
land-sectors, the south-easterly air masses are likely to be strongly influenced by macroalgal beds along the coast and the emission ratios probably reflect those from seaweeds in addition to land sources. The north-easterly airmasses how-ever had an immediate fetch inland, which locally is com-prised of coastal peatland ecosystems (peat bogs and coastal conifer plantations), previously identified as being strong
Correspondence to: L. J. Carpenter
(ljc4@york.ac.uk)
sources of atmospheric CHCl3 under these conditions.
Al-though we cannot entirely rule out other local land or coastal sources, our observations also suggest peatland ecosystem
emissions of CHBr3. We use correlations between CHCl3
and CHBr3 during the north-easterly land breeze events in
conjunction with previous estimates of local wetland CHCl3
release to tentatively deduce a global wetland CHBr3source
of 20.4 (0.4–948) Gg yr−1, which is approximately 7% of the
total global source.
1 Introduction
Bromoform is ubiquitous in the marine environment and is the major natural carrier of organic bromine to the atmo-sphere. It has a relatively short tropospheric lifetime of ∼3 weeks and is believed to make a significant contribution to inorganic bromine in the upper troposphere and lower strato-sphere (Sturges et al., 2000; Nielsen and Douglass, 2001;
von Glasow et al., 2004). The major sources of CHBr3
have been identified as marine in origin, namely macroal-gae, ocean phytoplankton and water chlorination (Gschwend et al., 1985; Carpenter and Liss, 2000; Quack and Wallace, 2003 and references therein). To date, there are only limited and inconclusive studies of production by terrestrial
ecosys-tems. CHBr3has been found in the air of upper soil of a
pris-tine spruce forest (Haselmann et al., 2000). However in soil air of rural areas, Hoekstra et al. (1998) found no detectable
concentrations of CHBr3, except after in-situ enrichment by
KBr. This suggests the potential of soils containing elevated bromide, e.g. coastal soils/peatlands, to produce brominated trihalomethanes. Peat bogs cover approximately 3% of the total continental land mass (Biester et al., 2004). They are comprised exclusively of organic matter and in additional
2928 L. J. Carpenter et al.: Atmospheric bromoform at Mace Head coastal bogs are subject to deposition of halides from sea
spray, making such sites potentially significant organohalo-gen producers. Biester et al. (2004) found that the major-ity of halogens in peat exist in an organically bound form, with concentrations dependent upon peat decomposition pro-cesses. Speciated organohalogens were however not identi-fied in this study.
Chloroform concentrations at Mace Head can be substan-tially influenced by local biological emissions from the pine forests and peat bogs, which cover large parts of Ireland (Dimmer et al., 2001; O’Doherty et al., 2001). Extrapolat-ing from chamber studies made on Irish peatland ecosys-tems, Dimmer et al. (2001) estimated global annual fluxes
of 4.7 (0.1–151.9) Gg yr−1of CHCl3from such systems and
24.1 Gg yr−1 from total wetlands. CHBr3 measurements
were not made in the latter study. Here, we present over
2.5 years of CHBr3 data measured at Mace Head and use
the tracer-ratio technique, in conjunction with the data from Dimmer et al. (2001), to estimate the contribution of peatland
and wetlands to global CHBr3emissions.
2 Experimental
2.1 Site description
Mace Head is located on the remote western coast of County
Galway, Ireland (53◦190N, 9◦540W). The site is well known
for background air measurements and receives relatively clean marine air from the prevailing westerly sector associ-ated with the easterly tracking cyclonic systems of the North Atlantic. The surrounding area is sparsely populated and contains a large expanse of peat bogs. The nearest large pop-ulation centre is Galway, ∼62 miles to the east. Heard et al. (2005) gives a full description of the site.
2.2 Instrumentation
The York halocarbon measurements were made during the NAMBLEX campaign (2 August–3 September 2002) with a Perkin Elmer Turbomass GC-MS system with electron im-pact ionisation and operating in selective ion recording mode. Air sampling was from a height of 20 m through a
stain-less steel 3/400 manifold, pumped at ∼30 L min−1. Sample
volumes of 500 mL were pre-concentrated on a two stage
carbon-based adsorbent trap held at −10◦C before being
transferred to the GC by rapid heating to 400◦C.
Halocar-bons were separated on a SGE BPX5 capillary column (50 m x 0.32 mm i.d.×3 µm d.f.). Detection limits are between 0.02 and 0.12 pptv for approximately hourly samples of CHCl3, CH3I, C2H5I, 1-C3H7I, 2-C3H7I, CH2ClI, CH2Br2,
CHBr2Cl, CH2BrI, CHBr3 and CH2I2 with a precision of
3–8% (5% for CHBr3)and complete recovery of all
com-pounds. Our calibration system utilises fixed volume (50 µl) loop injections of the output of thermostatted in-house per-meation tubes filled with pure liquids (≥97% purity, Aldrich,
UK) into a 100 ml min−1stream of purified nitrogen gas in
order to dilute parts per million by volume (ppmv) mixing ratios into low parts per trillion by volume (pptv). The ibration is completely automated, allowing multi-point cal-ibrations during routine operation. The overall accuracy of the measurements is estimated to be ±15%. A full descrip-tion of the calibradescrip-tion and GC-MS methodology is given in Wevill and Carpenter (2004).
Routine AGAGE (Advanced Global Atmospheric Gases Experiment) GC-MS observations, made by Bristol Univer-sity, of a range of halocarbons commenced at Mace Head in 1994. A full description of the instrumentation can be found in Prinn et al. (2000) and Simmonds et al. (1995). A nominal, precisely repeatable two liters of ambient air or calibration standard are trapped onto a 3-stage mixed ad-sorbent contained in a microtrap. The microtrap is located
between two thermoelectric coolers maintained at −50◦C
during sampling. This low temperature enables the small mass of adsorbent material to have the capacity to quanti-tatively trap the compounds of interest. The trapped sample is purged briefly with clean helium then thermally desorbed
(245◦C) directly onto a chromatographic capillary column
(CPSil-5, 100 m×0.32 mm i.d.×5 µm d.f.), interfaced to an Agilent benchtop MS. The individual trace components are separated and identified using both their chromatographic re-tention times, and their characteristic ion masses. Each com-ponent is quantified by integrating the response of a selected target ion and where possible, two qualifier ions are used to ensure compound specific ion ratios are maintained. Cus-tom software developed at Scripps Institution of Oceanogra-phy (SIO), enables constant monitoring of ion ratios, peak width ratios and many other diagnostic parameters. This enables rapid identification and determination of instrumen-tal problems. At present standard and air analysis are al-ternated every two hours to provide six calibrated measure-ments per day. The method of standard preparation and prop-agation is described in detail in O’Doherty et al. (2004). Briefly, all working standards are 35 l stainless steel elec-tropolished tanks (Essex Cryogenics, Missouri, USA) filled with Mace Head “real-air”, under baseline conditions, and have a working life of 3–4 months. Calibration of ambi-ent air measuremambi-ents is achieved by means of bracketing them with measurements from a working standard tank. At
present, a CHBr3 calibration is not assigned for the
ADS-GC-MS data at Mace Head; the Bristol data presented here
were instead calibrated using contemporaneous York CHBr3
data collected at Mace Head, as described below.
2.3 Comparison of York/Bristol measurements and
conver-sion of Bristol CHBr3relative response to pptv values
An “organic” x-y correlation (i.e. a correlation which min-imizes errors in both the x- and y-directions, e.g. Helsel
and Hirsch, 1992) of York/Bristol CHCl3data taken within
the same 40-min period during the NAMBLEX campaign
(a)
(b)
Fig. 1. (a) Organic correlation of York and Bristol CHCl3
mix-ing ratios measured durmix-ing the NAMBLEX campaign, usmix-ing data points taken within the same 40-min period. (b) Organic correlation of York CHBr3mixing ratios and Bristol CHBr3relative response data, using data points taken within same 40-min period.
showed that on average the York measurements were 13%
higher than the AGAGE data (with zero offset), with an R2
value of 0.95 (Fig. 1a). The fact that the instruments were not sampling for the same time periods may explain some or most of the scatter, however there is clearly also a calibration difference although this is within the estimated error of our measurements.
The same procedure for the correlation of York CHBr3
mixing ratios against the Bristol CHBr3relative response to
a Mace Head reference air sample (contained in a 36 L elec-tropolished Essex canister) revealed more variance in the
lin-ear regression (R2value of 0.74) and an offset in the Bristol
data (Fig. 1b). Because the York instrument has the same
pre-cision for CHBr3and CHCl3measurements (Wevill and
Car-penter, 2004), we attribute the increased scatter of the corre-lation compared to Fig. 1a to the shorter lifetime and hence
greater natural variability of atmospheric CHBr3. Indeed,
both instruments detected greater variability in atmospheric
CHBr3levels during NAMBLEX (relative standard deviation
0 5 10 15 20 25 30 17-Aug-2002 19-Aug-2002 21-Aug-2002 23-Aug-2002 25-Aug-2002 27-Aug-2002 29-Aug-2002 31-Aug-2002 2-Sep-2002 4-Sep-2002 Date pptv CHBr 3
Bristol standard correlation Bristol organic correlation York CHBr3
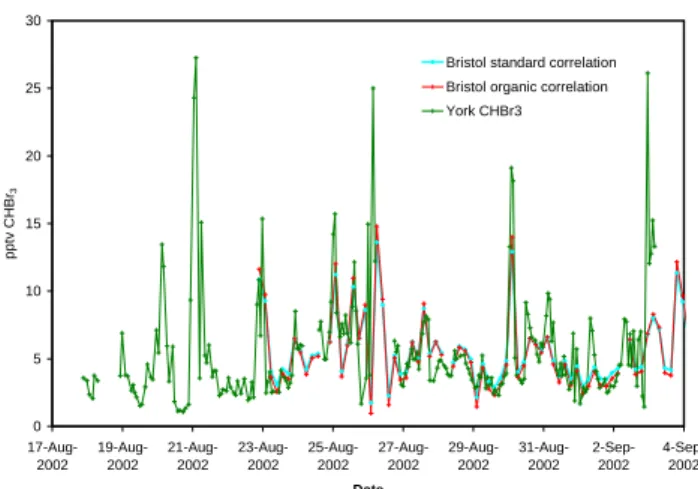
Figure 2. Comparison of York and Bristol CHBr3 data, converted to mixing ratios using both
the organic correlation of Figure 2 and a standard correlation. Fig. 2. Comparison of York and Bristol CHBr3data, converted to
mixing ratios using both the organic correlation of Fig. 1b and a standard correlation.
of 80% (York) and 60% (Bristol)) compared to CHCl3
(rela-tive standard deviation of 50%, both instruments). The offset of the Bristol data may be caused by incomplete recovery of
high concentrations of CHBr3 in the microtrap, which was
designed for quantitative measurements of the more volatile
Halons and CFCs rather than CHBr3. A comparison of the
York data with Bristol CHBr3mixing ratios converted using
both the organic regression values and a standard linear least squares regression (with York data on the x-axis) is shown in Fig. 2 and reveals the higher dynamic range of the York data. Although the Bristol instrument appears to
underesti-mate the highest mixing ratios of CHBr3, nevertheless the
average concentrations derived using this approach are equal to the York average concentrations. We chose to use a stan-dard correlation to “correct” the Bristol data to mixing ratios because the organic correlation under-predicted low values and in fact resulted in occasional negative mixing ratios in winter.
2.4 Tracer-ratio approach
The tracer-ratio technique has been used, in various forms, to estimate trace gas emissions by utilising correlations ob-tained with a reference compound with a known emission,
in this case CHCl3 (e.g. Dunse et al., 2001, 2005; Biraud
et al., 2002; Carpenter et al., 2003). Here, we attempt to
use CHBr3/CHCl3correlations obtained during land breeze
events in order to estimate Irish terrestrial emissions of
bro-moform. Visual inspection of the data from Mace Head
clearly shows the strong covariance of CHCl3, CHBr3 and
O3 concentrations during land breeze events (e.g. Fig. 3).
Although the size and duration of the land breeze episodes
varied, a strong temporal correlation in CHCl3, CHBr3and
O3and wind direction was always apparent, with only one
maximum in CHCl3 and CHBr3. For each “event”,
2930 L. J. Carpenter et al.: Atmospheric bromoform at Mace Head 0 5 10 15 20 25 30
29 Aug 0:00 29 Aug 12:00 30 Aug 0:00 30 Aug 12:00 31 Aug 0:00 Date (UCT) CHCl 3 (ppt), CHBr 3 (ppt) 0 5 10 15 20 25 30 35 40 45 50 O3
(ppb), wind direction (degrees/10)
YORK CHBr3 ppt YORK CHCl3 O3 wind direction (a) (b) 0 5 10 15 20 25 30
08 Apr 0:00 08 Apr 12:00 09 Apr 0:00 09 Apr 12:00 10 Apr 0:00 10 Apr 12:00 11 Apr 0:00 Date (UCT)
CHCl
3
(ppt), CHBr
3
(ppt), wind direction/10 (degrees)
0 10 20 30 40 50 60 70 O3 (ppb) AGAGE CHBr3 AGAGE CHCl3 wind direction O3
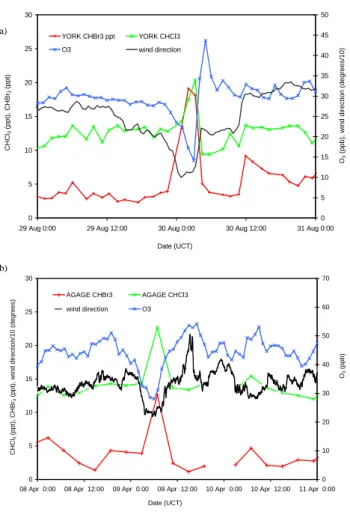
Figure 3. Land breeze events during the nights of (a) 29th/30th August 2002 and (b) 8th/9th
April 2003. 0 5 10 15 20 25 30
29 Aug 0:00 29 Aug 12:00 30 Aug 0:00 30 Aug 12:00 31 Aug 0:00 Date (UCT) CHCl 3 (ppt), CHBr 3 (ppt) 0 5 10 15 20 25 30 35 40 45 50 O3
(ppb), wind direction (degrees/10)
YORK CHBr3 ppt YORK CHCl3 O3 wind direction (a) (b) 0 5 10 15 20 25 30
08 Apr 0:00 08 Apr 12:00 09 Apr 0:00 09 Apr 12:00 10 Apr 0:00 10 Apr 12:00 11 Apr 0:00 Date (UCT)
CHCl
3
(ppt), CHBr
3
(ppt), wind direction/10 (degrees)
0 10 20 30 40 50 60 70 O3 (ppb) AGAGE CHBr3 AGAGE CHCl3 wind direction O3
Figure 3. Land breeze events during the nights of (a) 29th/30th August 2002 and (b) 8th/9th
April 2003.
Fig. 3. Land breeze events during the nights of (a) 29/30 August
2002 and (b) 8/9 April 2003.
concentration 1X (where X=CHCl3or CHBr3)from
base-line was calculated, both in units of pptv, yielding one data point for each event. The “baseline” was taken by interpolat-ing between the halocarbon concentrations measured imme-diately before and after a particular event. We then use the simple approach of assuming a linear relationship between the enhancements in mixing ratio,
1CHCl3/1CHBr3=E (1)
where E is the molar emission ratio (Dunse et al., 2005) and
both 1CHCl3and 1CHBr3are in units of ppt. The overall
approach assumes no atmospheric decay along the trajectory, which in this case should apply, given the short fetches (see below). More details concerning the tracer-ratio approach can be found in Dunse et al. (2005).
In order to deduce the mass (M) of emissions, the relative molecular weight (MW) of the two gases should be taken into account:
MCHBr3 =E.MCHCl3.(MWCHBr3/MWCHCl3) (2)
The mass of CHCl3 emissions was obtained from
esti-mates of peatland (coastal marshes and bogs) and total
wet-0 5 10 15 20 25 30 Apr-01 Jun-01 Aug-01 Oct-01 Dec-01 Feb-02 Apr-02 Jun-02 Aug-02 Oct-02 Dec-02 Feb-03 Apr-03 Jun-03 Aug-03 Oct-03 Dec-03 Date CH Br 3 (p p tv )
Figure 4. Bristol CHBr3 data fixed to the York calibration scale. The crosses are individual
(approx. 4 hourly) data points and the solid line is a 20-point moving average.
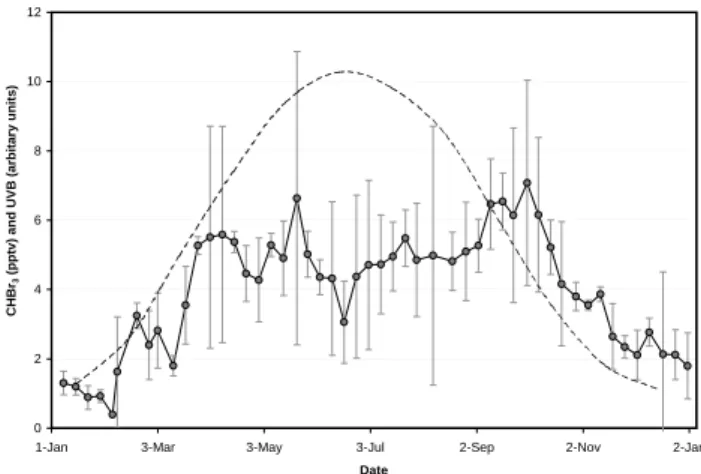
igure 5. Mean annual cycle of CHBr3 and UVB at Mace Head. The error bars on the
bromoform data are the RSDs of the 2-weekly average data points from each year. Before the 21st May, only 2 data points are available for each average (3 data points after this time).
0 2 4 6 8 10 12
1-Jan 3-Mar 3-May 3-Jul 2-Sep 2-Nov 2-Jan
Date CHBr 3 (pptv ) a nd U V B (a rbita ry units ) 0 0 0 0 0 0 0 0 0 F
Fig. 4. Bristol CHBr3data fixed to the York calibration scale. The
crosses are individual (approx. 4 hourly) data points and the solid line is a 20-point moving average.
land (peatland plus coastal conifer forest) ecosystem
terres-trial sources of CHCl3at Mace Head (Dimmer et al., 2001),
as discussed in Sect. 3.2. Such emissions are believed to be the cause of enhanced chloroform concentrations observed during land breeze episodes at Mace Head (O’Doherty et al., 2001).
2.5 Identifying local land breeze events
Land breeze events are quite commonly observed at Mace Head, and are characterised by a change in wind direction from westerly (ocean sector) in the day to easterly (land sec-tor) at night (e.g. O’Doherty et al., 2001; Biraud et al., 2002).
They are accompanied by a rapid decrease in O3, due to
in-creased deposition over land and a shallower nocturnal
con-tinental boundary layer, and increases in CHCl3, CO2 and
212Pb concentrations during low wind speeds due to local
emissions (Biraud et al., 2002). Here, we select events within
the land sector (20–140◦)with a greater than 40% maximum
decrease in [O3] and greater than 100% change in [CHCl3].
We define the fetch of the land breeze events as the product of their time duration (typically 5–7 h) and the average wind
speed recorded during the event (typically 1–5 ms−1)and
se-lect events with a fetch of <50 km, i.e. dominated by local continental emissions.
3 Results and discussion
3.1 General trends and seasonality
The complete Bristol data set, fixed to the York calibra-tion scale as described in Sect. 2.3, is shown in Fig. 4. Broad spring-autumn maxima, with occasional peaks of over 25 pptv but an average of ∼5 pptv, and winter minima are
ap-parent. Figure 5 shows an averaged annual cycle for CHBr3
based upon 2.5 years of data, comprising 2-weekly average data points, with mixing ratios of 5.3±1.0 pptv (mid March– mid October) and 1.8±0.8 pptv (December–February). Also
L. J. Carpenter et al.: Atmospheric bromoform at Mace Head 2931 shown is an average UVB (290–320 nm) annual cycle
com-puted for Mace Head. The only other published annual
measurements of CHBr3 have been made at the free
tropo-spheric site of Mauna Loa (Atlas and Ridley, 1996, discussed in Nielsen and Douglass, 2001) and at Alert, in the Arctic boundary layer (Yokouchi et al., 1996). Both these stud-ies showed winter maxima and summer minima, suggesting higher reactive loss in summer during long-range transport, but could give little information on the seasonal variation of sources. Thus our data gives a unique insight into the
sea-sonal variation of coastal CHBr3emissions.
CHBr3 appears to be the most abundant organic halogen
compound emitted from macroalgae (e.g. Nightingale et al., 1995; Mtolera et al., 1996; Carpenter et al., 2000) and these emissions are significant on a global scale, comprising
prob-ably the dominant source of atmospheric CHBr3
(Carpen-ter and Liss, 2000). Halocarbon formation in macroalgae
is initiated by oxidative stress, resulting in H2O2
produc-tion as part of a defense mechanism (Theiler et al., 1978; Peders´en et al., 1996 and references therein). The forma-tion of polyhalomethanes are initiated by haloperoxidase en-zymes produced in the cells, which catalyse the reaction of
accumulated halide ions with H2O2, forming a hypohalous
acid. Halogenated species such as CHBr3 may be
subse-quently formed in the algal cells and transferred across the cell membrane to seawater (Gschwend et al., 1985). Alterna-tively, formation may be initiated outside the cell by reaction of the released hypohalous acid with organic matter in sea-water (Wever et al, 1991).
Macroalgae exhibit quite constant cover over the course of the year, resulting from the continual recruitment of young plants and the prolific output of spores. Our data indicate that
CHBr3emission occurs all year, with only a short winter
pe-riod of minimal levels (November–February), when the algal population of the intertidal region is at its lowest. Goodwin et
al. (1997) and Klick (1993) reported that CHBr3release from
brown macroalgae maximises in mid summer, probably due to enhanced tissue decay during this period. Further, a
num-ber of studies have shown that CHBr3release from
macroal-gae is stimulated by light (e.g. Klick, 1993; Nightingale et al., 1995; Mtolera et al., 1996; Pedersen et al., 1996; Goodwin et al., 1997; Carpenter et al., 2000). Light-induced stress, especially at high light intensities, results in increased cel-lular levels of activated oxygen species including hydrogen peroxide, as by-products of oxygenic photosynthesis, which generally increase the emission of halocarbons. Seaweed
in-cubation experiments reveal an enhancement in CHBr3
re-lease by factors of 2–10 in daylight compared to the dark (Mtolera et al., 1996; Pedersen et al., 1996; Carpenter et al., 2000). Thus, variation in light intensities and/or tissue decay, in conjunction with higher algal coverage from early spring through to late autumn, could explain the seasonal variation
of CHBr3at Mace Head.
It is well established that trace gas emissions from phyto-plankton tend to peak in spring (at this latitude around early
0 5 10 15 20 25 Apr-01 Jun-01 Aug-01 Oct-01 Dec-01 Feb-02 Apr-02 Jun-02 Aug-02 Oct-02 Dec-02 Feb-03 Apr-03 Jun-03 Aug-03 Oct-03 Dec-03 Date CH Br3 (p p tv )
Figure 4. Bristol CHBr3 data fixed to the York calibration scale. The crosses are individual
(approx. 4 hourly) data points and the solid line is a 20-point moving average.
igure 5. Mean annual cycle of CHBr3 and UVB at Mace Head. The error bars on the
bromoform data are the RSDs of the 2-weekly average data points from each year. Before the 21st May, only 2 data points are available for each average (3 data points after this time).
0 2 4 6 8 10 12
1-Jan 3-Mar 3-May 3-Jul 2-Sep 2-Nov 2-Jan
Date CHBr 3 (pptv ) a nd U V B (a rbita ry units ) 0 0 0 0 0 0 0 0 0
FFig. 5. Mean annual cycle of CHBr3and UVB at Mace Head. The
error bars on the CHBr3data are the RSDs of the 2-weekly average data points from each year.
May), however the contribution of temperate microalgae to
atmospheric CHBr3levels at Mace Head is probably minimal
(Carpenter et al., 2003). The highest CHBr3concentrations
are consistently found along coastlines containing macroal-gal beds, with coastal and shelf seawater concentrations of
CHBr3of up to 100 times greater than open ocean
concen-trations (Quack and Wallace, 2003).
3.2 Land breeze events
In total, 28 land breeze events as defined by the selection cri-teria described in Sect. 2.4 were identified during mid 2001– 2003, all occurring during the period 23:00–04:00. These events were characterised by sharp changes in wind direction
(from sea to land), [O3], [CHCl3] and [CHBr3], as typified by
the events shown in Fig. 3. The variation in CHCl3correlated
well with the variations in CHBr3 and in O3 during every
one of these events. Only on the 29/30 August 2002 (during the NAMBLEX campaign) were sufficient Bristol and York data available for comparison; the excellent agreement of the
(corrected) Bristol and York 1CHCl3/1CHBr3ratios of 0.62
and 0.61, respectively gives some confidence that both data sets can be used to give an estimate of the emission ratio E in Eq. (1).
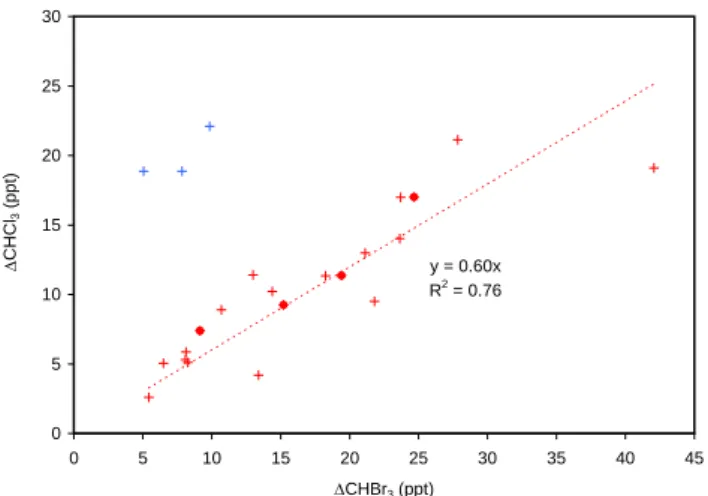
Figure 6 shows the 1CHCl3 vs. 1CHBr3 correlations,
separated into events occurring in either coastally-influenced
(e.g. south-easterly (100–170◦) or northerly (340–20◦)), or
north-easterly (40–70◦) winds. South-easterly and northerly
winds travel across the Irish shoreline and are expected to be strongly influenced by local macroalgal emissions.
Dur-ing such events, the 1CHCl3/1CHBr3molar ratio was
rela-tively invariant at 0.6±0.15, indicating that average emission
ratios of CHCl3/CHBr3from the local coastline are also
rela-tively constant. Both CHCl3and CHBr3are known products
2932 L. J. Carpenter et al.: Atmospheric bromoform at Mace Head y = 0.60x R2 = 0.76 0 5 10 15 20 25 30 0 5 10 15 20 25 30 35 40 45 ΔCHBr3 (ppt) Δ CHCl 3 (ppt)
Figure 6. ΔCHCl3/ΔCHBr3 ratios obtained using both Bristol (crosses) and York (filled circle)
data. The red data points were obtained during southeasterly or northerly winds (probable oastal influence); the blue data points were obtained during northeasterly winds, with no c
apparent immediate coastal influence.
Fig. 6. 1CHCl3/1CHBr3 ratios obtained using both Bristol
(crosses) and York (filled circle) data. The red data points were obtained during southeasterly or northerly winds (probable coastal influence); the blue data points were obtained during northeasterly winds, with no apparent immediate coastal influence.
2000 and references therein), with CHBr3consistently
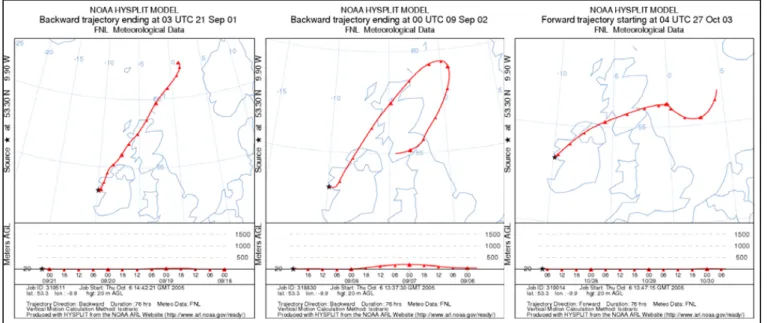
pro-duced in higher amounts across many different genera. From the north-easterly winds data set, data were selected which back-trajectories (Fig. 7) indicated had an inland fetch with no immediate coastal influence. This selection criterion
left 3 data points, as shown in Fig. 6. The 1CHCl3/1CHBr3
molar ratio during these conditions was much higher than the coastally-influenced land-breeze events, with an average value of 2.5±0.4. The variance in the ratio may be due to a number of factors including different starting
concen-trations of CHCl3 and CHBr3along the trajectories during
the various events, and different emission ratios from lo-cal terrestrial sources, e.g. peat bogs, inland marshes and
coastal forests. Although CHBr3 was not measured,
Dim-mer et al. (2001) found strikingly different emission ratios
of CHCl3 to CH3Br in peatland compared to conifer
for-est in the vicinity of Mace Head, with greater variation still within vegetation types. Thus, although our measurements
show evidence of peatland ecosystem sources of CHBr3at
Mace Head, an absolute emission ratio compared to CHCl3
should be treated with caution, not only because of vari-ation within source, but also because of the short
atmo-spheric lifetimes of CHCl3 and CHBr3, and the
instrumen-tal issues potentially affecting the Bristol ratios, as discussed in Sect. 2.3. Nevertheless, it is instructive to approximate source strengths from peatland emissions in order to compare with other known source strengths (which are also highly
un-certain). Dimmer et al. (2001) estimated a global CHCl3flux
from peatland soil of 4.7 (0.1–151.9) Gg yr−1and from total
wetlands of 24.1 Gg yr−1, calculated simply by
extrapolat-ing the measured Irish fluxes to estimated global coverages;
1.04×10⁶km2for peatbog (Olson, 1992) and 5.3×10⁶km2
for wetlands (Matthews and Fung, 1987). We use the 1σ
limits of the molar 1CHCl3/1CHBr3ratio determined here
of 2.5 (2.1–2.9), together with CHCl3 source estimates to
deduce a total global CHBr3 peatland source of 54.0 (0.1–
183) Gg yr−1 and total wetlands source of 20.4 (0.4–948)
Gg yr−1. Any non-peatland ecosystem sources of either
CHCl3or CHBr3 over the north-easterly fetch will add
er-ror to our peatland emission estimates. However, despite the large uncertainties involved, it is worth comparing our peat-land and wetpeat-land source estimates with current estimates for
CHBr3emission of 220 Gg yr−1 from macroalgae
(Carpen-ter and Liss, 2000) and a total global source of 300 Gg yr−1
(Dvortsov et al., 1999). Thus, it is possible that peatland and
wetland emissions of CHBr3 together are a small (<10%)
but significant unaccounted term in the CHBr3budget.
4 Conclusions
So far, global modelling studies of tropospheric and
strato-spheric bromine that have specifically included CHBr3
(Dvortsov et al., 1999; Nielsen and Douglass, 2001; von Glasow et al. 2004) have assumed a seasonally invariant
ocean source of CHBr3. Our study indicates a much stronger
source of CHBr3in summer than in winter, possibly linked to
light levels and macroalgal coverage, and points to an
addi-tional coastal terrestrial source in the CHBr3budget of
(ten-tatively) around 7% of the global source. The dual roles of such ecosystems in conjunction with macroalgae indicate the
dominance of coastal regions in providing CHBr3to the
at-mosphere. Changes in wetland emissions, through man’s im-pact on land use, and in ultraviolet radiation at the earth’s sur-face due to the effect of ozone-depleting substances on strato-spheric ozone, show the possibility of anthropogenic effects
on the release of CHBr3, which itself is an ozone-depleting
substance.
Acknowledgements. We specifically acknowledge the cooperation
and efforts of the station operators and support staff Gerard Spain and Duncan Brown at Mace Head. We also thank the Physics Department, National University of Ireland, Galway, for making the research facilities and meteorological data at Mace Head available. The operation of the Mace Head station was supported by the National Aeronautic and Space Administration (NASA) (grants NAGW-732, NAG1-1805, NAG5-3974 NAG-12099, to MIT; grants NAGW-2034, NAG5-4023 to SIO), the Department of the Environment, Food and Rural Affairs (UK) (contracts PECD 1/1/130 and 7/10/154, EPG 1/1/82 and EPG 1/1/130 to International Science Consultants). The halocarbon compo-nent of the NAMBLEX campaign was funded by NERC grant NER/A/S/2001/01064. We gratefully acknowledge the NOAA Air Resources Laboratory (ARL) for providing the HYSPLIT transport and dispersion model. DJW thanks the EPSRC for his studentship. Edited by: D. Heard
Figure 7. NOAA HYSPLIT model 3-day back trajectories for north-easterly land-breeze
events.
Fig. 7. NOAA HYSPLIT model 3-day back trajectories for north-easterly land-breeze events.
References
Biester, H., Keppler, F., Putschew, A., Martinez-Cortizas A., and Petri M.: Halogen retention, organohalogens, and the role of organic matter decomposition on halogen enrichment in two Chilean peat bogs, Environ. Sci. Technol., 38, 1984–1991, 2004. Biraud, S., Ciais, P., Ramonet, M., Simmonds, P., Kazan, V., Mon-fray, P., O’Doherty, S., Spain, G., and Jennings, S. G.: Quantifi-cation of carbon dioxide, methane, nitrous oxide and chloroform emissions over Ireland from atmospheric observations at Mace Head, Tellus B, 54 (1), 41–60, 2002.
Carpenter, L. J. and Liss, P. S.: On temperate sources of CHBr3 and other reactive organic bromine gases, J. Geophys. Res., 105, 20 539–20 548, 2000.
Carpenter, L. J., Malin, G., Kuepper, F., and Liss, P. S.: Novel biogenic iodine-containing trihalomethanes and other short-lived halocarbons in the coastal East Atlantic, Global Biogeochem. Cycles, 14, 1191–1204, 2000.
Carpenter, L. J., Liss, P. S., and Penkett, S. A.: Marine organohalo-gens in the atmosphere over the Atlantic and Southern Oceans, J. Geophys. Res., 108, 4256, doi: 10.1029/2002JD002769, 2003. Dimmer, C. H., Simmonds, P. G., Nickless, G., and Bassford, M. R.:
Biogenic fluxes of halomethanes from Irish peatland ecosystems, Atmos. Environ., 35, 321–330, 2001.
Dunse, B. L., Steele, L. P., Fraser, P. J., and Wilson, S. R.: An analysis of Melbourne pollution episodes observed at Cape Grim from 1995–1998, in: Baseline Atmospheric Program (Australia) 1997–98, edited by: Tindale, N. W., Francey, R. J., and Derek, N. A., pp. 34–42, Bureau of Meteorology and CSIRO Atmospheric Research, Melbourne, Australia, 2001.
Dunse, B. L., Steele, L. P., Wilson, S. R., Fraser, P. J., Krummel, P. B.: Trace gas emissions from Melbourne, Australia, based on AGAGE observations at Cape Grim, Tasmania, 1995–2000, At-mos. Environ., 39, 6334–6344, 2005.
Dvortsov, V. L., Geller, M. A., Solomon, S., Schauffler, S. M., Atlas,
E. L., and Blake, D. R.: Rethinking reactive halogen budgets in the midlatitude lower stratosphere, Geophys. Res. Lett., 26, 1699–1702, 1999.
Gschwend, P. M., McFarlane, J. K., and Newman, K. A.: Volatile halogenated organic compounds released to seawater from tem-perate marine macroalgae, Science, 227, 1023–1035, 1985. Goodwin, K. D., Lidstrom, M. E., and Oremland, R. S.:
Ma-rine bacterial degradation of brominated methanes, Environ. Sci. Technol., 31, 3188–3192, 1997.
Haselmann, K. F., Laturnus, F., Svensmark, B., and Gron, C.: For-mation of chloroform in spruce forest soil – results from labora-tory incubation studies, Chemosphere, 41, 1769–1774, 2000. Helsel, D. R. and Hirsch, R. M.: Studies in environmental science
49: Statistical methods in water resources, Amsterdam, Elsevier, p. 276, 1992.
Hoekstra, E. J., De Leer, E. D. B, and Brinkman, U. A. T: Natural formation of chloroform and brominated trihalomethanes in soil, Environ. Sci. Technol., 32, 3724–3729, 1998.
Klick, S.: The release of volatile halocarbons to seawater by un-treated and heavy metal exposed samples of the brown seaweed
Fucus vesiculosus, Mar. Chem., 42, 211–221, 1993.
Matthews, E. and Fung, I.: Methane emission from natural wet-lands: global distribution, area and environmental characteristics of sources, Global Biogeochem. Cycles, 1, 61–86, 1987. Mtolera, M. S. P., Collen, J., Pedersen, M., Ekdahl, A.,
Abra-hamsson, K., and Semesi, A. K.: Stress-induced produc-tion of volatile halogenated organic-compounds in Eucheuma-denticulatum (Rhodophyta) caused by elevated pH and high light intensities, Euro. J. Phycology, 31, 89–95, 1996.
Nielsen, J. E. and Douglass, A. R.: Simulation of bromoform’s con-tribution to stratospheric bromine, J. Geophys. Res., 106, 8089– 8100, 2001.
Nightingale, P. D., Malin, G., and Liss, P. S.: Production of chlo-roform and other low-molecular-weight halocarbons by some species of macroalgae, Limnol. Oceanogr., 40, 680–689, 1995.
2934 L. J. Carpenter et al.: Atmospheric bromoform at Mace Head
O’Doherty, S., Simmonds, P. G., Cunnold, D. M., Wang, H. J., Stur-rock, G. A., Fraser, P. J., Ryall, D., Derwent, R. G., Weiss, R. F., Salameh, P., Miller, B. R., and Prinn, R. G.: In-Situ Chloroform Measurements at AGAGE Atmospheric Research Stations from 1994–1998, J. Geophys. Res., 106, 20 429–20 444, 2001. O’Doherty, S., Cunnold, D. M., Manning, A., Miller, B. R., Wang,
R. H. J., Krummel, P. B., Fraser, P. J., Simmonds, P. G., Mc-Culloch, A., Weiss, R. F., Salameh, P., Porter, L. W., Prinn, R. G., Huang, J., Sturrock, G., Ryall, D., Derwent, R. G., and Montzka, S. A.: Rapid growth of hydrofluorocarbon 134a and hydrochlorofluorocarbons 141b, 142b, and 22 from Advanced Global Atmospheric Gases Experiment (AGAGE) observations at Cape Grim, Tasmania, and Mace Head, Ireland, J. Geophys. Res., 109, D06310, doi:10.1029/2003JD004277, 2004.
Olson, J.: Global Ecosystems Database, Version 1.0: Disc A. NOAA National Geophysical Data Center, Boulder, CO, USA, World Ecosystems (WEI.4): digital raster data on a 10 minute geographic 19 080×2160 grid, 1992.
Peders´en, M., Coll´en, J., Abrahamsson, K., and Ekdahl, A.: Produc-tion of halocarbons from seaweeds – An oxidative stress reacProduc-tion, Sci. Mar., 60, 257–263, 1996.
von Glasow, R., von Kuhlmann, R., Lawrence, M. G., Platt, U., and Crutzen, P. J.: Impact of reactive bromine chemistry in the troposphere, Atmos. Chem. Phys., 4, 2481–2497, 2004,
SRef-ID: 1680-7324/acp/2004-4-2481.
Prinn, R. G., Weiss, R. F., Fraser, P. J., Simmonds, P. G., Cun-nold, D. M., Alyea, F. N., O’Doherty, S., Salameh, P., Miller, B. R., Huang, J., Wang, R. H. J., Hartley, D. E., Harth, C., Steele, L. P., Sturrock, G., Midgley, P. M., and McCulloch, A.: A history of chemically and radiatively important gases in air deduced from ALE/GAGE/AGAGE, J. Geophys. Res., 105, 17 751–17 792, 2000.
Simmonds, P. G., O’Doherty, S., Nickless, G., Sturrock, G. A., Swaby, R., Knight, P., Ricketts, J., Woffendin, G., and Smith, R.: Automated gas chromatograph-mass spectrometer for routine atmospheric field measurements of the CFC replacement com-pounds, the hydrofluorocarbons and hydrochlorofluorocarbons, Anal. Chem., 34, 717–723, 1995.
Sturges, W. T., Oram, D. E., Carpenter, L. J., Engel A., and Penkett, S. A.: Bromoform as a source of bromine to the stratosphere, Geophys. Res. Lett., 27, 2081–2084, 2000.
Theiler, R., Cook, J. C., Hager, L. P., and Studa, J. F.: Halohydro-carbon synthesis by bromoperoxidase, Science, 202, 1094–1096, 1978.
Quack, B. and Wallace D. W. R.: Air-sea flux of bromoform: Con-trols, rates, and implications, Global Biogeochem. Cycles, 17 (1), 1023, doi:10.1029/2002GB001890, 2003.
Vilter, H.: Peroxidases from Phaeophyceae .3. Catalysis of halo-genation by peroxidases from Ascophyllum-Nodosum (L) Le-Jol, Bot. Mar., 26 , 429–435, 1983.
Wever, R., Tromp, M. G. M., Krenn, B. E., Marjani, A., and Vantol, M.: Brominating activity of the seaweed Ascophyllum-nodosum – impact on the biosphere, Environ. Sci. Tech., 25, 446–449, 1991.
Wevill, D. J. and Carpenter, L. J.: Automated measurement and calibration of reactive volatile halogenated organic compounds in the atmosphere, Analyst, 129, 634–638, 2004.
Yokouchi, Y., Barrie, L. A., Toom D., and Akimoto, H.: The sea-sonal variation of selected natural and anthropogenic halocar-bons in the Arctic troposphere, Atmos. Environ., 30, 1723–1727, 1996.