HAL Id: hal-00459267
https://hal.archives-ouvertes.fr/hal-00459267
Submitted on 23 Feb 2010
HAL is a multi-disciplinary open access
archive for the deposit and dissemination of
sci-entific research documents, whether they are
pub-lished or not. The documents may come from
teaching and research institutions in France or
abroad, or from public or private research centers.
L’archive ouverte pluridisciplinaire HAL, est
destinée au dépôt et à la diffusion de documents
scientifiques de niveau recherche, publiés ou non,
émanant des établissements d’enseignement et de
recherche français ou étrangers, des laboratoires
publics ou privés.
Impact of the execution context on Grid job
performances
Tristan Glatard, Diane Lingrand, Johan Montagnat, Michel Riveill
To cite this version:
Tristan Glatard, Diane Lingrand, Johan Montagnat, Michel Riveill. Impact of the execution context
on Grid job performances. International Workshop on Context-Awareness and Mobility in Grid
Com-puting (WCAMG’07), May 2007, Rio de Janeiro, Brazil. pp.713–718, �10.1109/CCGRID.2007.62�.
�hal-00459267�
Impact of the execution context on Grid job performances
Tristan Glatard
1,2, Diane Lingrand
1, Johan Montagnat
1, Michel Riveill
11
Rainbow, I3S joint research laboratory of CNRS and the University of Nice-Sophia Antipolis, France
2Asclepios, INRIA Sophia Antipolis, France
{glatard, lingrand, johan, riveill}@i3s.unice.fr
http://rainbow.i3s.unice.fr
Abstract
In this paper, we examine how the execution context of grid jobs can help to refine submission strategies on a pro-duction grid. On this kind of infrastructure, the latency highly impacts performances. We present experiments that quantify the dependencies between the grid latency and both internal and external context parameters on the EGEE grid infrastructure. We show how job submission managers, job execution sites and the submission date can be statisti-cally correlated to grid performances.
1. Objectives
Grids are increasingly used as support infrastructures for different scientific application areas [11, 9, 5]. Several grids, such as the European EGEE grid infrastructure1[10] or the Open Science Grid (OSG)2, have reached a produc-tion level quality of service. These large scale and multi-users systems are characterized by a non-stationary load, their heterogeneity and their large geographic expansion. As a consequence, non-negligible jobs submission laten-cies, measured as the time between the jobs submission and the start of their execution, are observed. They are mainly due to queuing systems, network delays and system faults. This system variability is known to highly impact application performances and thus has to be taken into ac-count [14].
Several initiatives aim at modeling grid infrastructure Workload Management Systems (WMS). In [12], corre-lations between job execution characteristics (job size or number of processors requested, job runtime and memory used) are studied on a multi-cluster supercomputer in order to build models of workloads, enabling comparative study on system design and scheduling strategies. Feitelson [4]
1http://www.eu-egee.org 2http://opensciencegrid.org
has observed correlations between runtime and job size, number of cluster and time of the day.
Models of the grid latency enable the optimization of job submission parameters such as jobs granularity or the timeout value needed to make the WMS robust against sys-tem faults and outliers. Properly modeling a large scale in-frastructure is a challenging problem given its heterogeneity and its dynamic behavior. In a previous work, we adopted a probabilistic approach [6] which proved to improve appli-cation performances while decreasing the load applied on the grid middleware by optimizing jobs granularities. Fur-thermore, in [7], we show how the distribution of the grid latency impacts the choice of a timeout value for the jobs. An optimal timeout value can be obtained by minimizing the expectation of the job execution time J which can be expressed as follows, where FRdenotes the cdf of the
la-tency, fRthe corresponding pdf, t∞the timeout value and ρ the proportion of outlier jobs:
EJ(t∞) = 1 FR(t∞) Z t∞ 0 ufR(u)du+ t∞ (1 − ρ)FR(t∞) −t∞.
The resulting timeout value is highly dependent on the na-ture and parameters of the distribution of R. In particular, the weight of the tail of the distribution of the latency is a discriminatory parameter: heavy-tailed distribution always lead to a finite optimal timeout value whereas for light-tailed ones, it may be better not to set any timeout.
These studies show that determining a precise and up-to-date model of the grid latency is a crucial issue to allow the optimization of job submission parameters. However, the underlying model relies on an estimation of the distribution of the grid latency which is currently collected by the user at a global scale from historical data in absence of specific grid monitoring service. The forthcoming estimation of the distribution may be outdated, thus impairing the accuracy of the estimation, in particular in case of rapid variations of the grid status.
Taking into account contextual information has recently been reported to help in estimating single jobs and
work-flows execution time by rescheduling [13]. We aim at refin-ing our grid model with more local and dynamic parame-ters. Each job can be characterized by its execution context that depends on the grid status and may evolve during the job life-cycle. The context of a job depends both on param-eters internal and external to the grid infrastructure. The internal context corresponds to parameters such as the com-puter(s) involved in the WMS of a specific job. It may not be completely known at the job submission date. The ex-ternal context is related to parameters such as the day of the week and may have an impact on the load imposed to the grid.
Our final goal is to improve job execution performance on grids. This requires taking into account contextual in-formation and its frequent update. In this paper, we are studying some parameters among the broad range of con-textual information that could be envisaged and we discuss their relevance with regard to grid infrastructures.
2. EGEE infrastructure and data collection
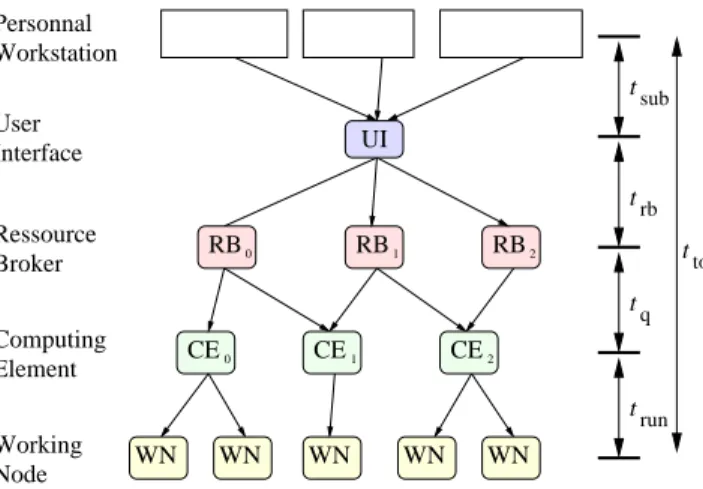
Our experiments are based on the EGEE production grid infrastructure. With 35000 CPUs dispatched world-wide in more than 190 computing centers, EGEE represents an interesting case of study as it exhibits highly variable and quickly evolving load patterns that depend on the concur-rent activity of up to 1000 users. For the following discus-sion, we here introduce the main components of the batch-oriented EGEE grid infrastructure, that are diagrammed in figure 1. ttot User Interface Ressource Broker Computing Element Working Node Personnal Workstation UI RB RB CE CE CE WN WN WN WN WN 0 1 2 1 0 RB2 t t t t sub rb q run
Figure 1. EGEE submission schema.
When a user want to submit a job from her workstation, she connects to an EGEE client known as a User Interface (UI). A Resource Broker (RB) queues the user requests and dispatches them to the different computing centers avail-able. The gateway to each computing center is one or more Computing Element (CE) batch manager that will distribute
the workload over the Worker Nodes (WN) in the center. During its life-cycle, a job changes its status. Received by the RB it is initially waiting, then queued at the CE and running on the WN. If everything went right, the job is then completed. Otherwise, it is aborted, timeout or in an error status depending on the type of failure. As shown in fig-ure 1, UIs can connect to different RBs, and RBs may be connected to overlapping sets of CEs.
To study the grid behavior, we have collected mea-sures over the submission of a very large number of probe jobs (i.e. jobs only consisting in the execution of a
/bin/hostnamecommand). We maintained a constant number of probes inside the system by submitting a new one as soon as one completed to avoid introducing any ex-tra variability. The probe jobs were assigned a fixed 10000 seconds timeout beyond which they were canceled and not taken into account (2.5% of the submitted jobs timeouted). The results presented in this document involve the remain-ing 4477 probe jobs. For each one, we logged the job sub-mission date, the UI used, the UI load at subsub-mission time, the RB used, the CE used and the jobs status duration (total duration ttot and partial durations tsub, trb, tq and trunas
illustrated in figure 1).
The cumulative distribution function (cdf) of the latency of this data set is plotted on figure 2. Its median is 363 seconds, its expectation is 559 seconds and its standard de-viation is 850 seconds, which quantifies the highly variable behavior of the EGEE grid. The first part of this experi-mental distribution is close to a log-normal distribution and its tail can be modeled by a Pareto distribution [7]. Pareto distributions are used to model a large class of computer system measurements (jobs durations, size of the files, data transfers length on the Internet. . . ) [8]. This heavy tailed distribution demonstrates that the EGEE grid exhibits non-negligible probabilities for long latencies.
3. Influence of context parameters on the grid
latency
Many parameters may have a direct influence on the jobs submitted to a grid infrastructure. We are here focusing on three of them which proved to have a particular impact as shown below: the site of computation (CE), the job dis-patcher (RB) used, and the day of the week. The CE and RB are directly related to the specific EGEE grid. How-ever, the results obtained could be extended to other grid by replacing CEs and RBs by the equivalent workload manage-ment services. In the DIET middleware [1] for instance, it could correspond to Master Agents (MA) and Local Agents (LA).
0 0.2 0.4 0.6 0.8 1 0 2000 4000 6000 8000 10000 FR
Grid latency (seconds)
Experimental cdf
Figure 2. Cumulative density function of the whole experimental data
3.1. Site of computation parameter
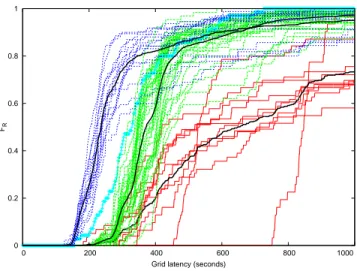
The probe measures involved 90 different computing center gateways (CEs) from the infrastructure. Figure 3 plots the cumulative distribution of the grid latency for each CE involved in the experiment. To ensure statistical signifi-cance, CEs with less than 30 probe measures were removed from the study. 60 computing elements out of the 90 were remaining.
Figure 3 suggests that 3 classes can be identified among the CEs. A k-means classification was thus done on the cumulative density functions of the CEs and the obtained classes are identified with distinct colors on the figure. Cen-troids of the classes are plotted in black.
The first class of CEs, pictured in blue, has the highest performance in average. The median of its centroid is 237 seconds. It is composed of 15 CEs. The second class of CEs, pictured in green, is composed of 35 CEs. The me-dian of its centroid is 373 seconds, which corresponds to a 1.6 ratio with respect to the fastest class. Finally, the slow-est class, pictured in red, is composed of 10 CEs and the median of its centroid is 652 seconds. Table 1 compares the median, expectation and standard-deviation of the grid latency for each CE class. It reveals that even if the first (blue) class of CEs has the highest performance in average, it is also more variable than the second (green) class. The third (red) class is the most variable. The impact of vari-ability on the performances of an application depends on the number of submitted jobs and on the performance met-ric. In some cases (high number of jobs), it would be better to submit jobs on a less variable CE class, even if it has the lowest performance in average.
A noticeable feature of the green class is that almost all
of its CEs contain thelcgpbsstring in their names. In this class, the only CE whose name does not contain this string is plotted in cyan on figure 3 and is close to the border of this class. In the blue class, no CE contains this string in its name and in the slowest class, 7 CEs have this string in their name. This shows that thelcgpbsstring name is in-formative in itself although the reasons are not necessarily known (it may correspond to a specific middleware version deployed on some of the CEs in this heterogeneous infras-tructure).
The order of magnitude of the grid latency thus appears to be correlated to the execution CE. It is relevant because the CE is directly related to the job queuing time as a CE exactly corresponds to a batch queue. Variations of middle-ware and system versions may explain the differences ob-served among the 3 different classes while variations inside a given class may be coming from the load imposed by the users and the performance of CEs host hardware.
However, in general, the execution CE is only known after the job submission, during the scheduling procedure. Thus, this information could only be exploited for param-eters that can be updated once the job has been submitted, as for instance the timeout value or the application comple-tion prediccomple-tion, whereas parameters such as the granularity of the tasks to submit could not benefit from the CE infor-mation. 0 0.2 0.4 0.6 0.8 1 0 200 400 600 800 1000 FR
Grid latency (seconds)
Figure 3. Classification in 3 classes of the cu-mulative density functions of the grid laten-cies by CE. Centroids of the k-means classes are plotted in black.
CE group Median (s) Expect. (s) Stdev (s) not lcgpbs (blue) 237 436 880
lcgpbs (green) 373 461 493 other (red) 652 1132 1396 Whole data 363 559 850
Table 1. First moments and median of the grid latency w.r.t the execution CE class
3.2. Resource Broker parameter
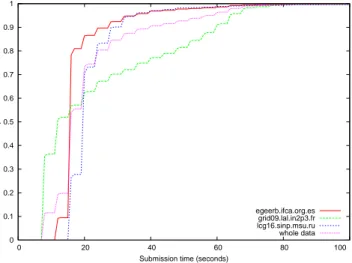
The probe measures were submitted to 3 different Re-source Brokers (RBs). Figure 4 displays the cumulative density function of the submission time of the probe jobs sent to each of the RBs as well as the one of the submis-sion time considering the whole experimental data set. We first can notice that the submission times seem to be quan-tified to a discrete set of values that correspond to the ones were the cumulative density function is growing. As every curve correspond to more than 1400 probe measures, this phenomenon does not come from the lack of measures but rather from a characteristic of the submission system. In-deed, to ensure scalability, jobs are sequentially submitted to the RB, which could explain this behavior. The submis-sion time is a multiple of the duration required to submit one job, which is about 4 seconds according to those measures. The 3 RBs exhibit quite different behaviors. Two of them (red and blue curves) have equivalent tails that are smaller than the one of the third RB (green curve). It indicates that the latter RB is prone to have very high submission delays: on this RB, 30% of the jobs require more than 40 seconds to be submitted, whereas they are less than 10% for the two other RBs. On the other hand, many of the jobs of the green RB are submitted faster than on the two other ones. As a consequence, the median of the submission time on the green RB is only 12 seconds, whereas it is respectively be-tween 19 and 20 seconds and bebe-tween 15 and 16 seconds on the blue and red RBs.
Table 2 displays the expectation and standard-deviation of the submission time with respect to the RB. Knowing that a job is submitted to the red or blue RB reduces the variance of the submission time distribution. On the contrary, the standard-deviation of the green RB is higher than the one of the whole data.
3.3. Day of the week parameter
The day of the week is an important parameter of the external context which is likely to influence the load of the grid infrastructure. Figure 5 plots the cumulative density function of the grid latency with respect to the day of the
Resource Broker Expectation (s) Stdev (s) IFCA (red) 19 14 LAL (green) 25 24 SINP (blue) 22 16 Whole data 22 19
Table 2. First moments of the submission time w.r.t the RB 0 0.1 0.2 0.3 0.4 0.5 0.6 0.7 0.8 0.9 1 0 20 40 60 80 100 F
Submission time (seconds)
egeerb.ifca.org.es grid09.lal.in2p3.fr lcg16.sinp.msu.ru whole data
Figure 4. Cumulative density functions of the submission time by Resource Broker
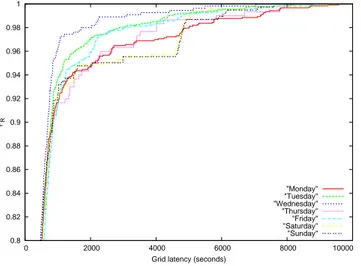
week and table 3 displays the corresponding expectations and standard-deviations. For this experiment, 1364 probes submitted during the week-end were added to the previous 4477 ones.
The seven days exhibit similar behaviors for latencies lower than 500 seconds. Above this value, Saturday and Sunday have very similar cdf significantly lower than the ones of the other days. In average, those week-end days correspond to the ones when the latency is the highest, as shown by table 3. The variance also seems to be higher during the week-end than during the week.
4. Discussion
We have shown in these experiments that the grid latency is related to the choice of a RB or a CE. More precisely, we have observed that the middleware and system versions are probably involved in this phenomenon. Computers with older systems and middlewares are probably computers that were installed before newer ones, and not upgraded. The differences can thus either come from software performance
0.8 0.82 0.84 0.86 0.88 0.9 0.92 0.94 0.96 0.98 1 0 2000 4000 6000 8000 10000 FR
Grid latency (seconds)
"Monday" "Tuesday" "Wednesday" "Thursday" "Friday" "Saturday" "Sunday"
Figure 5. Cumulative density functions of the grid latency for each day of the week
Day Expectation (s) Standard-deviation (s)
Monday 622 1088 Tuesday 530 747 Wednesday 461 542 Thursday 609 972 Friday 569 808 Saturday 630 1035 Sunday 629 1066 Whole data 569 886
Table 3. First moments of the grid latency w.r.t the day of the week
improvement or the fact that newer computers have higher computing capabilities. This hypothesis could be confirmed by other experiments establishing what fraction of the la-tency is due to the computer hardware or to its software. It might be a valuable information for middleware devel-opers. However, from a grid user point of view, the main interest is not necessarily the cause but rather its impact on the applications. A similar approach led Cieslak and co-authors [2] to propose performances analysis through grid log data mining. This can be very efficient in identifying point of failures or performance drops although it usually provide little information on their cause.
The last experiment made shows also an interesting re-sult: days from Monday to Friday are usually accepted as working days while Saturdays and Sundays are usually non-working days. This is the case for most western and eastern countries involved in the EGEE project. However, this
as-sumption fails in some participating countries (for instance, in Algeria the week-end is on Thursday-Friday and in Is-rael on Friday-Saturday). This information on working days would thus need to be corrected by the geographical loca-tion of the grid sites handling the jobs. Working on such a large geographical area also implies to consider the time of the day. Working hours depend on the country we are deal-ing with and local habits. The dependency between latency and day of the week could be refine considering:
• Local meaning of week-end (e.g. Saturday/Sunday or
Thursday/Friday).
• Local time of the day (day or night).
• Time zone: days start with significant time shifts in the
EGEE infrastructure (from GMT+9 in Japan to GMT-8 in the USA).
• Local habits (e.g. working hours).
We believe that the dependency between latency and day of the week is related to the system administrators activity (they are more frequently at work and system or services crashes are more rapidly fixed on week days). However, we also need to consider the fact that there is more activity during the week than during week-end, generating probably more faults. These hypotheses need to be further tested by building a notion of time context with respect to time zones, working days and hours.
Similarly, we can anticipate a correlation between tem-perature and faults in southern countries: in summer, air conditioning systems cooling down computing centers are more likely to break down, making large amounts of local resources unexpectedly unavailable. CPU’s temperature is certainly the most accurate parameter to demonstrate this fact but is often difficult to obtain remotely. Considering cities temperatures could also gives indications on failures probability. This information is easily obtained for large cities through well known Web information providers.
In the future, we plan to examine with more details the execution context. A definition of the context as Dey [3] proposed is probably too general to adapt to our case. For us, context is information that is relevant for our problem. We make a difference between the context of execution we need to study:
• Time context (day, hour, absolute/local,
working/not-working, week/week-end).
• Hardware context (CPU, bus, hard disk size and speed,
network adapter, bandwidth, load).
• Software (system, middleware).
• Temperature (CPU, city (daily, hourly, ...)).
and the context we will really use for estimating job laten-cies and optimizing job resubmission strategies. Reaching a very fine granularity (e.g. monitoring each computer CPU)
may be intractable in practice and the desired information is not always available. However, higher level information derived statistically such as the CEs and RBs classes may al-ready be sufficient for improving the system performances. Similarly, cities temperature may be both a sufficient and accessible information to further optimize it.
5. Conclusion
We consider the context of execution being composed by the elements that are relevant to our problem. Going into the details of all the parameters of the problem is intractable without a statistical approach. The level of detail we will reach depends both on the availability of the contextual in-formation and the needs of the model.
In this paper, we have exhibited correlations between job submission latencies and parameters from the execu-tion context such as the job dispatcher and batch systems involved in jobs management, or the week of the day. These results encourage to perform more detailed studies in order to have a better understanding of the influence of these pa-rameters.
Depending on their influence and availability, they can be used to refine our model of job latency and to optimize our job resubmission and timeouting strategies. At last, we plan to include our updated model into grid middlewares in the future. In the example of the EGEE grid, there are two levels of modification we will have to consider: at the UI level for choosing the RB and at the RB level for choosing the CE. Furthermore, even if we do not get control on the targets CEs, the timeout value assigned to a job may be dy-namically adapted taking into account the destination site processing it.
6. Acknowledgments
This work is partially funded by the French national research agency (ANR), AGIR project3 (ACI “Masse de donn´ees”) and NeuroLog project4 (ANR-07-TLOG-024). This project is in the scope of scientific topics of the STIC-ASIA OnCoMedia project5. We are grateful to the EGEE European project for providing the grid infrastructure and user assistance.
References
[1] Eddy Caron and Fr´ed´eric Desprez. DIET: A Scalable Tool-box to Build Network Enabled Servers on the Grid. Inter-national Journal of High Performance Computing Applica-tions, 2005.
3AGIR:http:www.aci-agir.org
4Neurolog:http://neurolog.polytech.unice.fr 5OnCoMedia:http://www.onco-media.com
[2] David Cieslak, Douglas Thain, and Nitesh Chawla. Trou-bleshooting Distributed Systems via Data Mining. In IEEE International Symposium on High Performance Distributed Computing (HPDC’06), Paris, France, June 2006.
[3] Anind K. Dey. Understanding and Using Context. Pattern Recognition Letters (PRL), 5(1):4–7, 2001.
[4] Dror Feitelson. Workload modeling for performance eval-uation, pages 114–141. Springer-Verlag - LNCS vol 2459, September 2002.
[5] Tristan Glatard, Johan Montagnat, Diane Lingrand, and
Xavier Pennec. Flexible and efficient workflow
deploye-ment of data-intensive applications on grids with MOTEUR. International Journal of High Performance Computing and Applications (IJHPCA), 2007.
[6] Tristan Glatard, Johan Montagnat, and Xavier Pennec. Prob-abilistic and dynamic optimization of job partitioning on a grid infrastructure. In 14th euromicro conference on Parallel, Distributed and network-based Processing (PDP06), pages 231–238, Montb´eliard-Sochaux, France, February 2006. [7] Tristan Glatard, Johan Montagnat, and Xavier Pennec.
Opti-mizing jobs timeouts on clusters and production grids. In In-ternational Symposium on Cluster Computing and the Grid (CCGrid), Rio de Janeiro, May 2007. IEEE.
[8] Mor Harchol-Balter. Task Assignment with Unknown Du-ration. Journal of the ACM (JACM), 49(2):260–288, March 2002.
[9] Nicolas Jacq, Christophe Blanchet, C. Combet, E. Cornillot, L. Duret, K. Kurata, H. Nakamura, T. Silvestre, and Vincent Breton. Grid as a bioinformatic tool. Journal of Parallel Computing, 30(9-10):1093–110, 2004.
[10] Erwin Laure, E. Fisher, S.M Fisher, Akos Frohner,´
C. Grandi, and Peter Kunszt. Programming the Grid with gLite. Computational Methods in Science and Technology, 12(1):33–45, 2006.
[11] Erwin Laure, Heinz Stockinger, and Kurt Stockinger. Perfor-mance Engineering in Data Grids. Concurrency and Compu-tation: Practice & Experience, 17(2-4), 2005. [12] Hui Li, David Groep, and Lex Wolters. Workload
Character-istics of a Multi-cluster Supercomputer. In Job Scheduling Strategies for Parallel Processing, pages 176–193. Springer Verlag, 2004.
[13] Jason Nichols, Haluk Demirkan, and Michael Goul. Auto-nomic Workflow Execution in the Grid. IEEE Transactions on Systems, Man, and Cybernetics, 36(3), May 2006. [14] Jennifer Schopf and Francine Berman. Stochastic