HAL Id: hal-00318156
https://hal.archives-ouvertes.fr/hal-00318156
Submitted on 13 Sep 2006
HAL is a multi-disciplinary open access
archive for the deposit and dissemination of
sci-entific research documents, whether they are
pub-lished or not. The documents may come from
teaching and research institutions in France or
abroad, or from public or private research centers.
L’archive ouverte pluridisciplinaire HAL, est
destinée au dépôt et à la diffusion de documents
scientifiques de niveau recherche, publiés ou non,
émanant des établissements d’enseignement et de
recherche français ou étrangers, des laboratoires
publics ou privés.
the IMF is strongly northward
H. Hu, T. K. Yeoman, M. Lester, R. Liu, H. Yang, A. Grocott
To cite this version:
H. Hu, T. K. Yeoman, M. Lester, R. Liu, H. Yang, et al.. Dayside flow bursts and high-latitude
reconnection when the IMF is strongly northward. Annales Geophysicae, European Geosciences Union,
2006, 24 (8), pp.2227-2242. �hal-00318156�
www.ann-geophys.net/24/2227/2006/ © European Geosciences Union 2006
Annales
Geophysicae
Dayside flow bursts and high-latitude reconnection when the IMF is
strongly northward
H. Hu1,2, T. K. Yeoman2, M. Lester2, R. Liu1, H. Yang1, and A. Grocott2
1Polar Research Institute of China, Shanghai, China
2Department of Physics and Astronomy, University of Leicester, Leicester, UK
Received: 9 May 2005 – Revised: 30 June 2006 – Accepted: 17 July 2006 – Published: 13 September 2006
Abstract. The characteristics of dayside ionospheric
convec-tion are studied using Northern Hemispheric SuperDARN data and DMSP particle and flow observations when the in-terplanetary magnetic field (IMF) was strongly northward during 13:00–15:00 UT on 2 March 2002. Although IMF
Bxwas positive, which is believed to favour Southern
Hemi-sphere high-latitude reconnection at equinox, a four-cell con-vection pattern was observed and lasted for more than 1.5 h in the Northern Hemisphere. The reconnection rate de-rived from an analysis of the Northern Hemisphere Super-DARN data illustrates that the high-latitude reconnection was quasi-periodic, with a period between 4–16 min. A sawtooth-like and reverse-dispersed ion signature was ob-served by DMSP-F14 in the sunward cusp convection at around 14:41 UT, confirming that the high-latitude recon-nection was pulsed. Accompanying the pulsed reconrecon-nection, strong antisunward ionospheric flow bursts were observed in the post-noon LLBL region on closed field lines, propagating with the same speed as the plasma convection. DMSP flow data show that a similar flow pattern and particle precipita-tion occurred in the conjugate Southern Hemisphere.
Keywords. Magnetospheric physics (Magnetopause, cusp,
arid boundary layers; Solar wind-magnetosphere interac-tions) – Ionosphere (Particle precipitation; Plasma convec-tion)
1 Introduction
It has been well established that the orientation of the in-terplanetary magnetic field (IMF) plays an important role in controlling the dayside reconnection (e.g. Heppner, 1972; Reiff and Burch, 1985; Moore et al., 2002), and thereby the large-scale convection-driven flow patterns (e.g.
Cow-Correspondence to: H. Hu
(hhq@pric.gov.cn)
ley, 1981; Khan and Cowley, 1999; Ruohoniemi and Baker, 1998), together with the precipitation of magnetosheath par-ticles into the magnetosphere and ionosphere via the magne-tospheric cusp region (e.g. Newell and Meng, 1992; Pinnock et al., 1995; Sandholt et al., 1998; Milan et al., 1999, 2000).
When the IMF is southward, reconnection at the low-latitude magnetopause between the closed magnetospheric field lines and the IMF field lines in the sheath, which has been referred to as low-latitude reconnection, results in the formation of open flux tubes, anti-sunward flow in the po-lar cap, twin-cell convection in the popo-lar ionosphere, and a concurrent expansion of the polar cap (Siscoe and Huang, 1985; Cowley and Lockwood, 1992). Since impulsive day-side reconnection was first observed (Haerendel et al., 1978; Van Eyken et al., 1984; Goertz et al., 1985), it has been be-lieved to be the primary mechanism for the transfer of flux from the Earth’s magnetosheath to the magnetosphere and episodes of such flux transfer are referred to as flux trans-fer events (FTEs, Russell and Elphic, 1978). Several diftrans-fer- differ-ent pulsed ionospheric signatures associated with FTEs have been studied in detail, such as the poleward moving auro-ral forms (PMAFs) (e.g. Sandholt et al., 1998), rapid veloc-ity transients or temporally enhanced flow velocities called “flow channels” or pulsed ionospheric flows (e.g. Pinnock et al., 1995; Yeoman et al., 1997; Provan et al., 1998; Milan et al., 1999, 2000; Lockwood et al., 2000; Davies et al., 2002), pulsed large-scale convection associated with cusp auroral transients (Moen et al., 1995), or poleward moving radar au-roral forms (Wild et al., 2001).
When the IMF is northward, lobe reconnection, or high-latitude reconnection between lobe field lines and the IMF begins, resulting in a multi-celled flow pattern, with a region of sunward flow in the dayside polar cap (e.g. Dungey, 1963; Russell, 1972; Reiff and Burch, 1985; Bristow et al., 1998; Sandholt et al., 2000, 2001), although observations in the dayside ionosphere suggest that open flux tube production does not switch off entirely until the clock angle falls below
-9 3 3 1000 ms-1
G
K
T
B
A
W
E
F
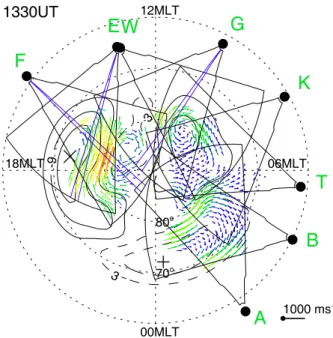
06MLT 12MLT 18MLT 00MLT 80o 70o 1330UTFig.1
Fig. 1. Fields of view of the eight Northern Hemispheric Super-DARN radars overlaid on the potential map at 13:30 UT, the middle time of the considered interval in this paper. This is plotted on a geomagnetic grid from the pole to 60◦, with 12 MLT at the top and 18 MLT to the left. The data from the beams highlighted with blue lines will be studied in detail.
∼30◦–40◦(e.g. Sandholt et al., 1998). Moore et al. (2002) and Sandholt et al. (2003) found that subsolar reconnection will weaken and disappear for nearly northward Bz. There
have been a wide range of proposed reconnection topologies that might exist for IMF Bznorthward (Dungey, 1963;
Rus-sell, 1972; Cowley, 1981 and 1983; Crooker, 1992; Onsager and Lockwood, 1997; Lockwood and Moen, 1999; Sandholt et al., 2000; Onsager et al., 2001), but there are only two ba-sic types. The first type is lobe reconnection, which takes place only in one hemisphere, referred to as “lobe stirring” (Reiff, 1982), or lobe reconfiguration, which results in circu-latory lobe convection cells in the polar cap. Another type, often referred to as lobe merging, occurs first in one hemi-sphere and then the overdraped field lines reconnect in the opposite hemisphere. The flow cells with sunward polar cap flow now cross between the open and closed field line re-gions and do not remain in the region of open flux. Open flux thus may be converted to closed flux and the convec-tion flow streamlines in the merging cells cross the polar cap boundary. Flux is lost from the polar cap and hence, the polar cap shrinks.
There is no doubt about the existence of the lobe recon-nection resulting in sunward convection within the polar cap ionosphere (Maezawa, 1976), and “four-cell” convection (Freeman et al., 1993), higher-latitude type 2 (north) auro-ras (Øieroset et al., 1997) and “reverse” cusp ion dispersion signature (Matsuoka et al., 1996). However, some
contro-versies remain over the temporal variability of the lobe re-connection and the related convection signatures. For ex-ample, the merging process has been believed to be quasi-stationary (e.g. Onsager et al., 1995; Fuselier et al., 2000; Frey et al., 2002, 2003; Chang et al., 2004), while Chisham et al. (2004) noted reconnection potential with transient en-hancements. Lu et al. (2004) observed intermittent magnetic reconnection at the high-latitude magnetopause, and Provan et al. (2005) suggested that the dayside reconnection rate was modulated by variations in the solar wind dynamic pressure and the IMF Bzcomponent.
In this paper we present a case study in which the IMF
Bz was strongly northward, a four-cell convection pattern
and antisunward flow bursts were observed in the Northern Hemisphere by SuperDARN and lasted for at least 1.5 h. A similar flow pattern and a reversed cusp ion dispersion sig-nature were also observed by DMSP satellites. It gives us an excellent opportunity to study the temporal variations of lobe reconnection and its associated ionospheric convection in detail.
2 Instrumentation
2.1 SuperDARN radar
The SuperDARN coherent HF radars (Greenwald et al., 1995) are designed to investigate field-aligned ionospheric plasma density irregularities (radar aurora) and large-scale ionospheric convection. The spectral characteristics of power, line-of-sight Doppler velocity, and spectral width (Hanuise et al., 1993) can be derived from the auto-correlation function of the returned signals. The Doppler ve-locity gives an estimate of the radar line-of-sight component of the plasma convection velocity (Ruohoniemi et al., 1987). Large-scale maps of the high-latitude convection can be de-rived from multiple radars using the “Map Potential” analy-sis method developed by Ruohoniemi and Baker (1998). In this method, the line-of-sight velocities are mapped onto a polar grid to determine a solution for the electrostatic po-tential, which is expressed in spherical harmonics, and the statistical model of Ruohoniemi and Greenwald (1996), pa-rameterized by concurrent IMF conditions, is used to stabi-lize the solution where no data are available. In this study, an eighth-order spherical harmonic fit is employed to repre-sent the Northern Hemisphere data. The flow vectors are de-rived using the SuperDARN line-of-sight velocity measure-ments and the transverse velocity component from the spher-ical harmonic fit.
During the period of interest, eight of the Northern Hemi-sphere radars were operated with excellent data coverage. Figure 1 shows the fields of view of the radars in Alti-tude Adjusted Corrected Geomagnetic (AACGM) coordi-nates (Baker and Wing, 1989), looking down on the geomag-netic north pole at 13:30 UT, the middle time of the interval
under study. Starting from the dusk side and moving clock-wise, the fields of view in the map are of Finland (F), Iceland East (E), Iceland West (W), Goose Bay (G), Kapukasing (K), Saskatoon (T), Prince George (B) and Kodiak (A) radars. The highlighted beams are beam 9 of the Finland (F) radar, beam 5 of Iceland East (E) and beam 6 of Goose Bay (G), whose data will be analysed in detail. During this interval, the CUTLASS radars (F&E) covered the antisunward flow region, while the Goose Bay radar covered the sunward flow region. It should be noted, however, that the MLT locations of the fields of view of the radars changed over the inter-val. The fields of view extend over more than 18 h of mag-netic local time, covering the whole dayside ionosphere with very rich backscatter, which makes the potential map reli-able, especially for dayside convection. There was a gap of SuperDARN coverage in the evening sector where the IMF model data are used to stabilize the solution, which might have some influence on nightside convection but no obvious influence on our results about dayside convection.
On 2 March 2002, all eight radars were operated in a stan-dard mode in which each radar scans through 16 beams of azimuthal separation 3.24◦, with a 7 s dwell time for each
beam and a total scan time of 2 min. Each beam is divided into 75 range gates of length 45 km, and so in each full scan the radars cover 52◦ in azimuth and over 3000 km in range. The CUTLASS components, Finland (F) and Iceland East (E) radars, are stereo radars (Lester et al., 2004), which have two identical channels. Channel A of these radars were operated in a standard mode, whereas Channel B was fixed in the beam directed towards Svalbard, namely beam 9 and beam 6, respectively, giving a much higher time resolution of 7 s compared to other beams. Although most of the South-ern Hemispheric radars were also in operation during that period, they received very little ionospheric backscatter. It is thus difficult to derive the large-scale convection pattern using SuperDARN data in the Southern Hemisphere to com-pare with the Northern Hemisphere.
2.2 DMSP particle and flow data
Measurements of ion and electron fluxes by the SSJ/4 (Hardy et al., 1984) and SSIES instruments on board the DMSP F13 and F14 spacecraft have been employed to investigate the pattern of particle precipitation and their relationship to the plasma flow. The DMSP spacecraft are in polar orbits (fixed in local time), sampling the ionospheric plasma at about 840 km. F13 is in a roughly dawn-dusk orientation while F14 is in 09:30–21:30 local time orientation. SSJ/4 points toward zenith at all times, and provides 1 s resolution spectra of ion and electron flux between 30 eV and 30 keV, while SSIES provides snapshot pictures of ionospheric convection during the interval, allowing us to compare the flow characteristics in both hemispheres.
2.3 ACE spacecraft
Upstream interplanetary conditions for the period under study were monitored by the ACE spacecraft (Stone et al., 1998) located at GSM coordinates (X, Y, Z)=(225, –37, – 3) Re during this interval. The solar wind and the IMF are measured by the SWEPAM and MAG instruments, respec-tively (McComas et al., 1998; Smith et al., 1999). The time lag of field changes from ACE to the dayside ionosphere has been estimated to be 67±5 min, using the algorithm of Khan and Cowley (1999). This estimate includes the propagation time between ACE spacecraft and subsolar bow shock, the transit time for the shocked and slowed solar wind across the subsolar magnetosheath, and the Alfvenic propagation time along open field lines from the subsolar magnetopause to the cusp ionosphere, in which solar wind proton number den-sity and speed are taken to be ∼10 cm−3 and ∼390 km s−1 respectively, and assuming that the reconnection occurred at the subsolar magnetopause. During the interval of interest, the active reconnection was at lobe field lines, and thus the time lag is expected to be influenced by the polarity change in Bxand might be variable and underestimated.
3 Observations
3.1 Solar wind and IMF conditions
On 2 March 2002, IMF Bzand Bxare positive for the whole
day except for some very short time negative excursions, which gives us a very good opportunity to study dayside re-connection and associated ionospheric convection and parti-cle precipitation during a prolonged period of positive IMF
Bz. In Fig. 2 we present data from the ACE spacecraft,
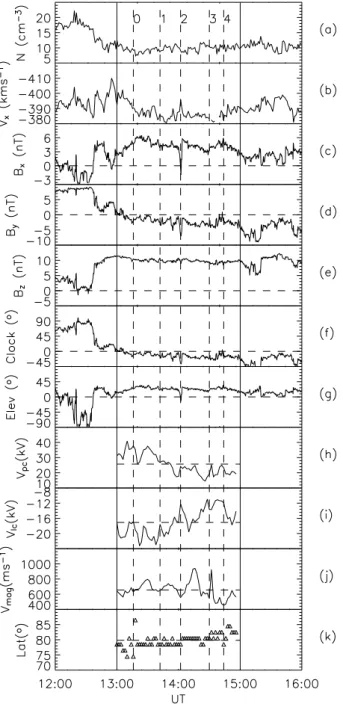
lagged by 67min via the method described above, from 12:00 to 16:00 UT on 2 March 2002. This is an extended interval describing the upstream interplanetary conditions for 1 h on either side of the interval of specific interest, namely from 13:00 to 15:00 UT, which is highlighted by the vertical solid lines. The top two panels show the solar wind proton num-ber density and speed. The following three panels show the GSM components of the IMF. The clock and elevation an-gles of the field, defined as the anan-gles of the IMF vector with GSM z axis in the y-z and z-x planes, respectively, are shown in the next two panels.
It is clear that the solar wind and IMF conditions had be-come very stable during the main interval of interest, with variable IMF restricted to about 20 min before. During 13:00–15:00 UT, the solar wind proton number density and velocity were about 10 cm−3and 390 km s−1. IMF Bx was
positive with an average value of 4 nT, while By was small
and negative, and Bzwas strongly positive with a very
con-stant value of 10 nT. The clock angle is mainly negative and its magnitude is less than 15◦, while the elevation angle is positive with a value of 20◦. An abrupt change of IMF
Fig.2
Fig. 2. Upstream interplanetary observations from the ACE spacecraft during 12:00-16:00 UT on 2 March 2002, lagged by 67 min to account for the propagation delay to the ionosphere, and parameters derived from potential maps observed by Northern Hemispheric SuperDARN radars. The top two panels show solar wind density (a) and velocity (b). The following three panels show IMF Bx(c), By(d), Bz(e) in
GSM coordinates. The next two panels show the clock (f) and elevation (g) angles of the IMF. The bottom four panels show the parameters derived from the map potential, namely the total transpolar potential difference (h), potential difference between the foci of two lobe cells (i), the magnitude of the peak flow speed (j) and the latitude (k) of the flow bursts in the post-noon sector. The vertical dashed lines illustrate the onset times of the flow bursts in (j).
orientation at 12:40 UT is noted here, although it is not in-cluded as part of the main period. Before 12:40 UT, when positive IMF By was dominant, the Northern Hemispheric
radars observed a two-cell convection pattern with a flow enhancement in the post-noon sector, associated with
day-side magnetopause low-latitude reconnection, which demon-strates that a 67±5-min time delay is acceptable for mag-netopause low-latitude reconnection. Around 12:48 UT, the Goose Bay radar observed the high-latitude ionospheric flow changed from antisunward to sunward, which shows the
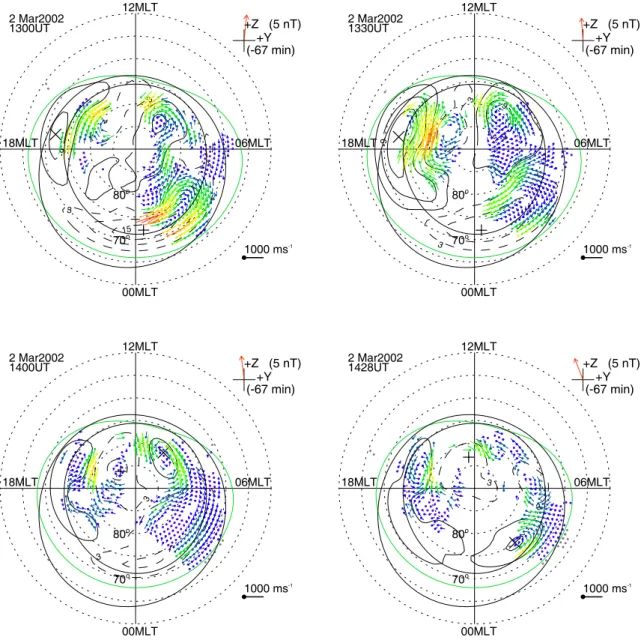
-9 3 3 15 1000 ms-1 +Z (5 nT) +Y (-67 min) 06MLT 12MLT 18MLT 00MLT 80o 70o 2 Mar2002 1300UT -9 -9 -9 3 3 1000 ms-1 +Z (5 nT) +Y (-67 min) 06MLT 12MLT 18MLT 00MLT 80o 70o 2 Mar2002 1330UT 3 3 1000 ms-1 +Z (5 nT) +Y (-67 min) 06MLT 12MLT 18MLT 00MLT 80o 70o 2 Mar2002 1400UT 3 3 1000 ms-1 +Z (5 nT) +Y (-67 min) 06MLT 12MLT 18MLT 00MLT 80o 70o 2 Mar2002 1428UT
Fig.3
Fig. 3. Streamlines and vectors of the ionospheric flows derived from the Northern Hemispheric SuperDARN velocity measurements shown on geomagnetic grids, obtained from the “map potential” algorithm. Maps are shown at 13:00, 13:30, 14:00 and 14:28 UT. The direction and magnitude of the lagged IMF are indicated at the right-hand upper corner of each map. The average auroral oval for Kp=1 and the Hepner-Maynard convection boundary are also overlaid on each of the map.
beginning of the lobe reconnection associated with strongly positive Bz. Therefore, for the ionospheric convection
re-lated to lobe reconnection, a 75-min time lag may be more reasonable, with the appropriate lag being variable during the 2-h period. However, the IMF conditions were very stable over 3 h after the northward turning, so that any errors in the calculated time lag should have no detrimental influence on our results.
3.2 Large-scale convection
In order to investigate the large-scale ionospheric flow, we have derived a sequence of convection maps using all the available SuperDARN data in the Northern Hemisphere, with the Map Potential analysis method. Before the IMF changed from By dominant to Bz dominant at 12:40 UT, the
convec-tion was dominated by a large circular dusk cell and crescent-shaped dawn flow cell, with flow enhancement in the post-noon sector, which is consistent with the Dungey-cycle flow driven in the presence of strong positive IMF By (Reiff and
Burch, 1985; Ruohoniemi and Greenwald, 1996). As the
IMF abruptly turned strongly northward around 12:40 UT, localised sunward flows began to appear within the polar cap, first appearing at the post-noon sector and then moving or expanding to the pre-noon sector, consistent with the nega-tive turning of IMF By. The global convection pattern also
changed from a distorted two-cell into a multi-cell configu-ration, and eventually a clear four-cell pattern at 13:00 UT.
In Fig. 3 we present four representative examples of the flow pattern, imaged at 13:00, 13:30, 14:00 and 14:28 UT, which employ 2-min resolution data from the eight radars indicated in Fig. 1. Figure 3 shows that the four-cell con-vection pattern and the sunward flows in the polar cap lasted for at least 1.5 h, and also that there are some strong flow bursts occurring in the dayside post-noon sector (see the map at 13:30 UT).
To examine more closely the variability of the dayside flow, in the four bottom panels of Fig. 2, we extract parame-ters from the Map Potential plots during 13:00–15:00 UT, in which horizontal dashed lines show the average values. Fig-ure 2h shows the total transpolar voltage in the flow maps, which lies typically between ∼15 and ∼40 kV, and exhibits a decreasing trend. Figure 2i illustrates the potential difference between the foci of the two lobe cells, which is believed to be related to the lobe reconnection rate at the high-latitude mag-netopause when the IMF is northward. It should be noted that this potential difference is of the opposite sense to the total transpolar voltage. The lobe potential difference was varying between –11 and –23 keV, with some transient enhancements with periods between 4 and 16 min. This suggests that the dayside high-latitude lobe reconnection during IMF Bz
posi-tive is a transient phenomenon, just like dayside low-latitude reconnection. The magnitude of the lobe potential difference also had a decreasing trend.
Inspection of the flow maps, such as those presented in Fig. 3, shows that, in addition to the temporally varying lobe cell activity, there were also strong flow bursts occurring in the post-noon sector, mainly in the antisunward direction. Figure 2j shows the peak antisunward flow speed measured in this post-noon sector, occurring in each 2-min Map Po-tential plot. In order to provide a representative value, we have averaged the vector velocities in bins of four “pixels” of the Map Potential algorithm, corresponding to 2◦of lati-tude and typically ∼7◦of longitude. Figure 2j demonstrates the bursty nature of the flow with 6–24 min periods evident. The averaged value of the peak flow speed over the interval, 625 m s−1, is indicated by the horizontal dotted line,
empha-sizing the peaks in the flow. The onsets of these peaks are marked by the vertical dashed lines. Comparison with the data in Fig. 2i shows that most of the onsets of flow bursts corresponded to the onsets of the lobe potential enhance-ments, although not all lobe potential enhancements had flow bursts associated with them. In Fig. 2k, the latitude of the antisunward flow burst peak velocity is presented, which il-lustrates that the position of the flow burst had a poleward moving trend and there is some evidence for a poleward jump
shortly after each flow burst event. 3.3 Radar parameter plots
To examine the dayside convection flows in detail, Fig. 4 presents the line-of-sight velocity and spectral width of the beams highlighted in Fig. 1, in magnetic coordinates. The scales of the parameters are illustrated with the colour bars to the right of the related panels. It should be noted that, in these plots, only ionospheric backscatter is plotted, and the positive (negative) velocities correspond to plasma drift toward (away from) the radar. The vertical dashed lines il-lustrate the onsets of the flow bursts identified in Fig. 2.
Figure 4a and d give the magnetic latitude-time-parameter plots for Beam 9 of CUTLASS-Finland radar Channel B with a 7 s resolution. A small region of backscatter appeared for a very short period around 12:30 UT between magnetic lat-itudes 76–78◦, which is related to the positive By dominant
IMF. Stronger and more extensive backscatter appeared af-ter 12:50 UT at higher latitudes of 78–82◦, which occurred about 10 min after IMF Bzturned strongly northward.
Subse-quently, the antisunward flow bursts in the post-noon region propagated poleward, with broad spectral width.
Figures 4b and e give the magnetic longitude-time-parameters plots for beam 5 of the CUTLASS-Iceland radar Channel B with 7-s resolution. Similar to Finland Beam 9, some weak backscatter appeared in a very short pe-riod around 12:30 UT near noon and stronger ionospheric backscatter appeared in the post-noon sector after 12:50 UT, which are related to the IMF Bydominant and strongly
north-ward IMF, respectively. After 12:50 UT flow burst structures (seen clearly as sloping velocity structures in Fig. 4b) prop-agating eastwards with a speed of 600 m s−1, away from the radar, occurred in the antisunward flow and wider spectral width region. It is interesting that the direction and magni-tude of the propagation speed are similar to the flow speed itself.
Figures 4c and f give magnetic latitude-time-parameter plots for Beam 6 of the Goose Bay radar which probed the midday region during this interval, with a 2-min resolution. Figure 4c shows that a strong antisunward flow appeared for a short period around 12:30 UT. At 12:48 UT the flow speed became sunward (towards the radar). The sunward flow per-sisted in the field of view for more than 2 h. This switch is re-lated to the time-lagged IMF orientation change at 12:40 UT. DMSP particle data shows (see section below) that the sun-ward flow region is the cusp.
3.4 DMSP flow and particle data
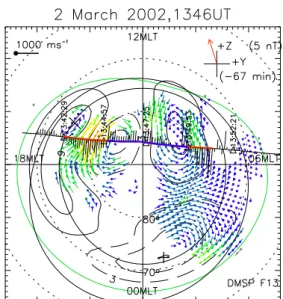
In Fig. 5a, the DMSP/F13 track and the horizontal cross-track velocity data during 13:40–13:55 UT are overlaid on the Northern Hemispheric potential map at 13:46 UT. The DMSP velocity observations agree well with SuperDARN, namely, that sunward flow occurred in the polar cap and
76 78 80 82 84 86 88 76 78 80 82 84 86 88 Mag Latitude Finland(9) (a) 76 78 80 82 84 86 88 76 78 80 82 84 86 88 Mag Latitude Finland(9) (d) 0 1 2 3 4 110 120 130 140 150 160 110 120 130 140 150 160 Mag Longitude -800 -600 -400 -200 0 200 400 600 800 Velocity (m s -1 ) Ionospheric scat only Iceland East(5) (b) 110 120 130 140 150 160 110 120 130 140 150 160 Mag Longitude 0 50 100 150 200 250 300 350 400 450 Width (m s -1 ) Ionospheric scat only Iceland East(5) (e) 0 1 2 3 4 74 76 78 80 82 84 86 74 76 78 80 82 84 86 Mag Latitude Goose Bay(6) (c) 1200 1230 1300 1330 1400 1430 1500 UT 72 74 76 78 80 82 84 86 1200 1230 1300 1330 1400 1430 1500 UT 72 74 76 78 80 82 84 86 Mag Latitude Goose Bay(6) (f) 0 1 2 3 4
Fig.4
Fig. 4. SuperDARN line-of-sight velocity and spectral width measurements from the radar beams indicated in Fig. 1 are shown for the interval 12:00–15:00 UT on 2 March 2002. The vertical dashed lines show the onset times of 5 pulsed flow features illustrated in Fig. 2j.
enhancements of antisunward flows occurred at lower lati-tude, which have been highlighted by coloured segments of the track in red and blue, respectively. Due to the convection changes which happened while F13 passed the sunward flow region in 5 min, the sunward flow region observed by F13 was wider than that indicated by the map potential measure-ment.
Figure 5b shows the particle data observed by DMSP SSJ/4 and the plasma flow data by SSIES during the same period as Fig. 5a. As shown in the top two panels in Fig. 5b, the average energy and energy flux for electrons associ-ated with antisunward flows were about 200 eV and 1010– 1011eV (cm2s sr)−1, respectively. The third panel shows that the electron energy spectrum in this region had spiky
Fig.5a
Fig. 5. (a) The track and horizontal cross track velocity data of DMSP-F13 during 13:40–13:55 UT overlaid on the potential map at 13:46 UT. The seg-ments of the track in the sunward and the antisunward flow regions are high-lighted by red and blue block lines. (b) Ion and electron data from SSJ/4 in-strument and particle flow data from SSIES on board DMSP-F13 spacecraft during 13:40–13:55 UT. From top to bottom, electron and ion energy flux in eV (cm2s sr)−1, electron and ion av-erage energy in eV, electron energy-time spectrogram, and ion energy-energy-time spectrogram. The coloured lines under Panel (3) illustrate the plausible source regions of the precipitation. The red and blue lines under the bottom panel illustrate the intervals when the satellite passed the sunward and the antisunward flow regions, respectively.
structures with sub-keV peaks. The coloured lines below this panel illustrate the plausible source region of the pre-cipitation. The bottom panel presents the horizontal cross-track component of the flow data, in which positive is sun-ward. Red and blue lines in the bottom of this panel are used to highlight the period of antisunward and sunward flows, as were identified in Fig. 5a. The characteristic energy and energy flux illustrate that these particles, related to antisun-ward convection, were mainly from the low-latitude bound-ary layer (LLBL) (Newell and Meng, 1992), interrupted by BPS or accelerated LLBL particles. Although the SSJ4 in-strument on F13 has degraded low energy ion detectors (be-low 1 keV) since 1995, we can still distinguish that there was no dispersed low-energy ion cutoff in the ion energy spectrum, which suggests that DMSP was on field lines that had been merged for a very long time or were closed (Chang
et al., 2004). The convection reversals are located within the LLBL. The sunward flow region at higher latitude was mainly in a region void of precipitation, interrupted by some spiky structures with BPS or mantle features in the elec-tron spectrum, although. The spikes in this region were sur-rounded by a diffuse background that was vastly weaker than that in the lower-latitude antisunward flow regions, which suggests that the high energy electrons might have been ac-celerated in the magnetosphere, implying that the antisun-ward flow and the sunantisun-ward flow regions in the ionosphere were related to the LLBL and polar cap/mantle, respectively. Figure 6a shows the track of the DMSP F14 during its pas-sage over the northern polar region from dusk to the pre-noon sector during 14:30–14:45 UT, overlaid on the potential map and the spectral width data of Iceland West Radar at 14:40 UT, with the segment of the track in red, highlighting
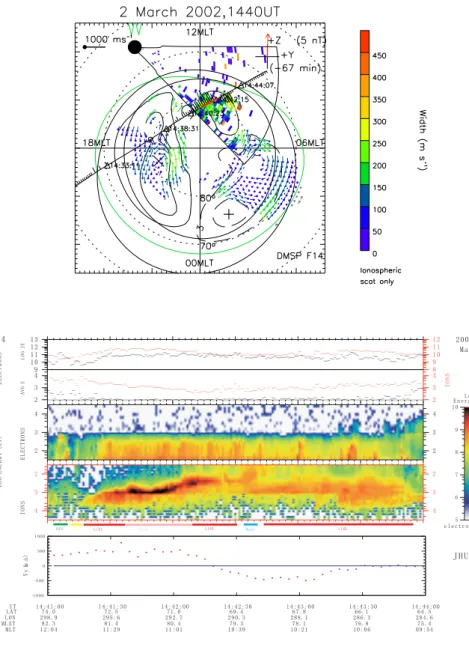
Fig.6a
Fig. 6. (a) The track and horizontal cross track velocity data of DMSP F14 during 14:40–13:55 UT overlaid on the potential map and the polar plot of the spectral width data from Iceland West radar at 14:40 UT. The track where DMSP F14 observed a reversed cusp ion dispersion signature is in red. (b) Ion and electron data from SSJ/4 instru-ment and particle flow data from SSIES on board DMSP-F14 spacecraft during 14:41–14:44 UT, in the same format as Fig. 5b. The coloured lines under Panel (3) illustrate the plausible source regions of the precipitation.
the passage of the cusp region during 14:41:38–14:42:11 UT, which will be discussed later. The flow patterns observed by the two different systems are again similar. The flow direc-tion was sunward in the cusp and changed to antisunward when the satellite had passed through the cusp region into the lower-latitude region. The spectral width is wider in the cusp region, and in fact the backscatter power (not shown) is also stronger than other regions.
The particle and plasma flow data from DMSP F14 during 14:41–14:44 UT are presented in Fig. 6b. During 14:41:38– 14:42:11 UT, the same period as the red segment track il-lustrated in Fig. 6a, the average energy and energy flux for electrons and ions were approximately (100 eV, 1010– 1011eV (cm2s sr)−1)and (1 keV, 1010–1011eV (cm2s sr)−1, respectively, indicating that these particles were from the cusp (Newell and Meng, 1992). The ion energy spectrum in the bottom panel of Fig. 6b shows that a low-energy ion
cut-off and reversed ion dispersion structure also occurred in this region, which suggests that lobe reconnection indeed hap-pened at the higher latitude cusp (Matsuoka et al., 1996). Most interesting is that the ion dispersion structure was a sawtooth-like structure (Morley and Lockwood, 2003), con-firming that the lobe reconnection was pulsed, which will be discussed later. When the DMSP F14 passed the cusp into the lower-latitude region, the low energy cutoff phenomena in the ion energy disappeared, and the electron and ion av-erage energies increased, which indicate that the satellite en-tered the LLBL region (interrupted by mantle precipitation) where flow direction changed to antisunward.
In the equinox season, positive IMF Bx is believed
to favour lobe reconnection and four-cell convection in the Southern Hemisphere (Lockwood and Moen, 1999). However, the ionospheric backscatter from southern Super-DARN radars was too poor to analyse the global convection
Fig.7
Fig. 7. The track and horizontal cross track velocity data in the Southern Hemispheric passages of DMSP F13 during 12:50–13:05 UT (a) and DMSP F14 during 13:43-13:58 UT (b), overlaid on the Northern Hemisphere potential map at the central time of the passages, respectively. The Northern Hemisphere potential map and the DMSP southern passage data are plotted in AACGM coordinates, looking down on the geomagnetic north pole and south pole, respectively.
pattern. Fortunately, the DMSP satellites measured some flow data during two of their southern passages. In order to compare the conjugate hemispheric convection, in Fig. 7, Southern Hemisphere DMSP data are overlaid on the North-ern Hemisphere convection maps at the central times of the passages. To eliminate the asymmetry caused by IMF By
in the two hemispheres, we plot Northern Hemisphere con-vection maps and the DMSP Southern Hemisphere track in AACGM coordinates (Baker and Wing, 1989), looking down on the geomagnetic north pole and south pole, respec-tively, so that the direction of the horizontal coordinates for the DMSP track is opposite to the northern potential map, namely 06:00 MLT is to the right side for the potential map while for the DMSP track it is to the left. Figure 7a demon-strates that the sunward flow region was mainly in the post-noon (pre-post-noon) sector of the central part of the northern (southern) polar region, which is coincident with the con-vection pattern for small negative Byaround 12:56 UT.
Fig-ure 7b shows the antisunward flow enhancement in the post-noon (pre-post-noon) sector of the Northern (Southern) Hemi-sphere polar region and the sunward flow at the central parts of the polar regions when IMF Bywas negative. Thus a
simi-lar dayside convection pattern occurred in both hemispheres, suggesting that magnetopause reconnection occurred in both lobe boundaries during this period.
4 Discussion
4.1 The post-noon flow bursts
The peak flow speed in the post-noon sector shows that the antisunward flow bursts happened with a period of 6–24 min (see Fig. 2j). Viscous interaction may always produce some antisunward flow in the low-latitude boundary layers, inde-pendent of any reconnection. However, during the interval of interest, neither solar wind plasma density nor solar wind speed has any obvious variation, indicating that such inter-action has little contribution to the flow bursts. On the other hand, the coincidence of the onsets of the flow bursts and the enhancements on the lobe cell potential difference sug-gests that they are closely related (see Fig. 2). There are two alternative interpretations for this relationship: in the first the transient lobe reconnection caused lobe potential en-hancements and the flow bursts; while in the second the low-latitude reconnection in the post-noon sector caused the anti-sunward flow bursts and then influenced the lobe cell poten-tial, in turn. Both of the SuperDARN and DMSP observa-tions support the former assumption.
In the flow burst region, the spectral width was broad (see Fig. 4), which has been used as the criterion of open field re-gion in the IMF southward situations. In this case, however, when IMF Bzwas strongly northward, the electron energies
and energy flux observed by the DMSP in this region sug-gest that these particles were from the low-latitude boundary layer (LLBL) (Newell and Meng, 1992). There was no low-energy ion cutoff in the ion low-energy spectrum, which suggests
10 0 -10 -20 -30 X gse 20 10 0 -10 -20 Y g se 10 0 -10 -20 -30 X gse -20 -10 0 10 20 Z g se
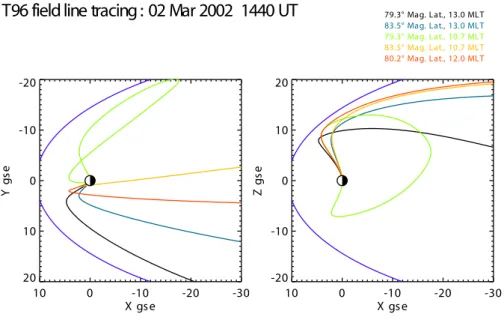
T96 field line tracing : 02 Mar 2002 1440 UT
79.3° Mag. Lat., 13.0 MLT 83.5° Mag. Lat., 13.0 MLT 79.3° Mag. Lat., 10.7 MLT83.5° Mag. Lat., 10.7 MLT
80.2° Mag. Lat., 12.0 MLT
F ig. 8
Fig. 8. A field line trace of the average and limiting locations (see text for details) of the high-latitude reconnection signatures as observed with SuperDARN using the T96 model. The field lines are projected in the GSE XY and XZ planes. The lobe field lines map close to the estimated T96 magnetopause, and span a wide range of GSE Y values.
that DMSP was on field lines that had been merged for a very long time or were closed (Chang et al., 2004).
The radar observations demonstrate that the flow bursts were not caused by the low-latitude reconnection in the postnoon sector. The Iceland East radar, whose beam was directed antisunward during the highlighted interval, ob-served flow burst structures, seen clearly in Fig. 4b, which propagated with a similar speed to the flow speed around 600 m s−1 in the antisunward direction. These structures were located in the post-noon sector, between the high-latitude clockwise lobe cell and the low-high-latitude anti-clockwise Dungey cell in the large scale flow pattern. This suggests that the flow bursts and related precipitation were caused by reconnection occurring elsewhere; otherwise, the transient should not propagate in the plasma flow velocity but in a phase velocity in the ionosphere. Provan et al. (1998) ob-served that the velocity of the transients at the reconnection region was much higher than that of the ionospheric flow.
The latitude of the peak flow at the post-noon sector ex-hibits abrupt poleward jumps just after the flow burst onsets (see Fig. 2k), which might imply that the polar cap contracted when the flow bursts occurred, even though DMSP data show that these structures were on the equatorward edge of the open/closed field boundary. If low-latitude reconnection hap-pens, it would have opened the closed field lines and then enlarged the polar cap, resulting in equatorward rather than poleward jumps. Polar cap contraction, not only at the night-side boundary (Lester et al., 1990) but also at the daynight-side boundary (Moen et al., 2004), may effectively be controlled by tail reconnection (Cowley and Lockwood, 1992); how-ever, no evidence of coincident tail reconnection is observed
in the nightside magnetometer data, and the agreement of the antisunward flow bursts and the lobe potential variation im-plies that the poleward jumps in the flow burst structure were not caused by tail reconnection but by lobe reconnection oc-curring in both hemispheres.
Although DMSP F13 observed antisunward flow enhance-ments both in the post-noon and pre-noon sectors (see Fig. 5), the map potential analysis demonstrates that most of the day-side flow bursts occurred in the postnoon sector, which was associated with prolonged small negative IMF By. Lobe
reconnection excites sunward flows in the cusp region and then as a result of magnetic tension, the reconnected field lines slide around either the dawn or the dusk flank, before being returned to the tail lobe by the magnetosheath flow. The prolonged negative IMF By, although its magnitude was
very small, led to more field lines moving towards the dusk flank, and therefore the flow bursts periodically occurred in the post-noon sector instead of the pre-noon sector.
4.2 Transient characteristics of the lobe reconnection During 13:00–15:00 UT on 2 March 2002, both northern Su-perDARN radars and DMSP satellites observed a four-cell convection pattern and sunward flow in the central part of the polar region, which illustrates that the lobe reconnection indeed happened in Northern Hemisphere, the reversed cusp ion dispersion signature observed by DMSP F14 confirms it further. These observations also give us some evidence to believe that the lobe reconnection is transient.
Assuming that the middle point (Pm)of the straight line
between the foci of the two lobe cells is located within the
ionospheric footprint of the active reconnection region, it is presumed that the active reconnection region is at the high-latitude magnetopause. During 13:00–15:00 UT Pm
varied between 79.3–83.5◦ AACGM Latitude, and 10.7– 13.0 MLT. Its average location was at 80.2◦AACGM Lati-tude, 12.0 MLT. These ionospheric locations may be mapped to the outer magnetosphere with the T96 model (Tsyganenko 1997), in which the solar wind plasma density, velocity, IMF
By, Bz and Dst are taken at 10 cm−3, 390 km s−1, –2 nT,
10 nT and –12 nT, respectively. The limiting and average lo-cations of Pmare mapped in Fig. 8, which shows the model
field lines in the GSE XY and XZ planes, along with the es-timated T96 magnetopause. This mapping suggests that the location of the reconnection occurred on lobe field lines dur-ing this period, and that the reconnection line was extended or variable in the GSE Y direction, although clearly the ac-curacy of the field line model may be limited.
As a first order estimate, the potential difference between the foci of the lobe cells, whose direction is opposite to that of the total potential difference in the whole polar region, represents the lobe reconnection rate. During the interval of interest, the lobe cell potential was variable (see Fig. 2i), with a period of 4–16 min, which suggests that the lobe reconnec-tion is also transient with the same period. The time scale is similar to the observation made by Chisham et al. (2004).
The polar cap potential is decreasing during the interval of interest. Lockwood et al. (1999) noted that much of the voltage associated with antisunward flow during northward IMF is due to field line closure in the tail and is not caused by either a viscous-like interaction or field line opening at the dayside magnetopause. There were no substorm signa-tures observed during periods of prolonged northward IMF. Wygant et al. (1983) showed that the range of residual trans-polar voltages during northward IMF dropped progressively with time since the northward turning of the IMF. This indi-cates that such voltage is associated with open flux produced by the prior period(s) of southward IMF.
In addition to the periodic flow bursts discussed above, the DMSP particle data also demonstrate that the related lobe re-connection was transient. During subsolar rere-connection un-der southward IMF (Bz<0), “stepped” and “sawtooth”
signa-tures have been shown to be caused by pulsed reconnection (Morley and Lockwood, 2003). During lobe reconnection under northward IMF (Bz>0), the sunward convection will
result in a reversed cusp ion dispersion (Woch and Lundin, 1992). As the ion precipitation evolves with elapsed time since reconnection, the particle dispersion process is just like subsolar reconnection, in which newly-reconnected lines al-low particles from the magnetosheath to precipitate through the magnetospheric cusp into the ionosphere. The velocity dispersion as the particles travel along field-lines from the point of particle injection means that the more energetic par-ticles of any species will reach the ionosphere before the less energetic particles. The low-energy ion cutoff is directly re-lated to the time elapsed since reconnection. Since the
con-vection direction is opposite to the southward IMF Bz, the
ion dispersion will be reversed. The discontinuity of ion dis-persion observed here (see Fig. 6) confirms that the lobe re-connection was transient.
Although the flow speed observed by the Goose Bay radar at the sunward flow region was not particularly variable (see Fig. 4e), the reconnection is not necessarily steady. When lobe reconnection occurs, the sunward flow is driven by the magnetic tension which is in the opposite direction of the sheath flow, so that the sunward flow speed and its change are depressed. On the other hand, after the newly-reconnected field lines become overdraped to the dusk or dawn side, the magnetic tension and the sheath flow speed are in the same direction, so that the variation in the antisunward flow are amplified. Due to the small negative By, most of reconnected
field lines were overdraped with the post-noon sector, caus-ing flow bursts in this region.
4.3 The IMF effect on lobe reconnection
Usually the time lag is very important in any analysis of the IMF effect on solar wind-magnetosphere-ionosphere cou-pling. The time lag may vary and is different for recon-nection at different locations, especially for low-latitude and high-latitude reconnection; therefore, it is very difficult to obtain an exact IMF time lag. In this study, we use the con-stant IMF time lag of 67 min calculated with the algorithm of Khan and Cowley (1999) designed for subsolar reconnection, although the high-latitude ionospheric convection switching from antisunward to sunward, as observed by the Goose Bay radar, demonstrates that this time lag is underestimated for high-latitude reconnection. However, since prolonged, sta-ble IMF conditions prevail over the interval under study, the uncertainties in the lag has no significant influence on our results.
During the interval of interest, the IMF conditions were quite stable with strongly positive Bz, positive Bx, small and
negative By. Moore et al. (2002) calculated the shape of the
X-line for the full range of clock angles using a generic T89 internal magnetic field model. They found an X line shape that is very similar to that inferred by Sandholt et al. (2003), for dominant IMF By, but also found that subsolar
recon-nection will weaken and disappear for nearly northward Bz
(small clock angles). As the clock angle increases from near zero, the X line traverses the subsolar region, producing some weak antisunward flow, but mainly azimuthal flows corre-sponding to overdraping effects, as we note here.
At equinox there is no dipole-tilt. Since Bx was positive
and Bynegative, the phase plane containing IMF first hit the
magnetopause poleward and duskward of southern cusp, and such conditions have been believed to favour southern lobe reconnection (Lockwood and Moen, 1999). The DMSP flow data during southern polar region passages illustrate that lobe reconnection and a four-cell convection pattern occurred in the both Northern and Southern Hemispheres. Unfortunately,
too little ionospheric backscatter was observed by the south-ern SuperDARN radars to study the convection pattsouth-ern in the Southern Hemisphere. In contrast, excellent coverage of the ionospheric scatter observed by northern SuperDARN radars showed that the four-cell convection pattern in the North-ern Hemisphere lasted for at least 1.5 h. The sunward iono-spheric flow preferentially occurred at prenoon.
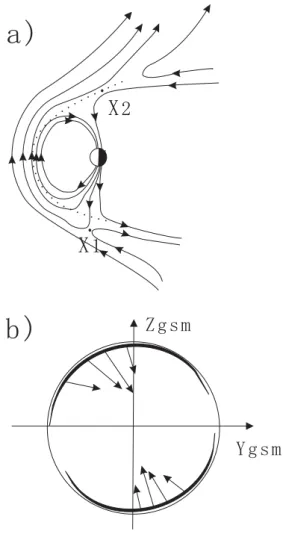
An interpretation of the proposed magnetopause reconnec-tion geometry is illustrated in Fig. 9. Figure 9a is a view of the magnetosphere from the dusk flank, in which points X1and X2are reconnection locations, the dotted line is the
open/closed field boundary. Figure 9b is a view of the mag-netopause from the Sun. When Bx is positive and the
el-evation angle is about 20◦, strongly positive B
z and small
IMF By cause the reconnection to first occur in the
south-ern dusk-side lobe in Fig. 9a, the newly-reconnected field is draped sunward and westward by magnetic tension, and then the draped interplanetary magnetic field lines from the Southern Hemisphere reconnect with the northern lobe field lines on the dawn side, resulting in a sunward and eastward flow in northern high-latitude region. In other words, the lobe reconnection might first occur in the open field region in the Southern Hemisphere and then on the open/closed field line boundary in the Northern Hemisphere, resulting in four-cell convections in both hemispheres and the closure of open magnetic flux.
During the interval, the locations of the flow bursts had a poleward moving trend, which indicates that the polar cap tended to contract. At the onset of the flow bursts, the peak location of the bursts also had poleward jumps, which sug-gests that the polar cap contraction might partly be caused by the re-closing of open field lines by lobe reconnection occur-ring in both hemispheres.
5 Summary
In this paper we present SuperDARN and DMSP satellite ob-servations when the IMF was strongly northward. Although the IMF Bx was positive during most of the interval of
in-terest, which is believed to favour Southern Hemisphere lobe reconnection at equinox, a four-cell convection pattern oc-curred in the Northern Hemisphere and lasted for at least 1.5 h, with periodic flow bursts in the post-noon antisun-ward convection region associated with LLBL precipitation on closed field lines. The flow burst structures propagated at a similar speed to the plasma convection, and the location of the flow bursts had poleward jumps at the onset times, which suggests that the flow bursts are not caused by low-latitude reconnection. The flow burst onsets were rather related to the onsets of the lobe potential enhancements, which implies that the transient lobe reconnection results in the periodic flow bursts. A sawtooth-like reversed cusp ion dispersion signa-ture observed by DMSP F14 at a sunward flow region
con-Fig. 9. Schematic illustrations of the evolution of lobe reconnection for strongly positive IMF Bz, small negative Byand positive Bxat
equinox, (a) as viewed from the dusk flank, lobe reconnection oc-curs first at the Southern Hemisphere at X1and overdraped lines
re-closed by subsequent lobe reconnection in the Northern Hemi-sphere at X2; (b) as viewed from Sun, the southern lobe
reconnec-tion occurs at dusk flank and results in sunward and westward flow, while the followed northern lobe reconnection occurs at the dawn flank and results in a sunward and eastward flow.
firms that the transient lobe reconnection was the source for the sunward convection in the four-cell pattern.
Flow data from DMSP during their Southern Hemispheric passes show that the four-cell convection also happened in the Southern Hemisphere. During most of the interval, IMF
Bxis positive, which favours southern lobe reconnection, so
that the lobe reconnection might occur in the Southern Hemi-sphere first, with field lines subsequently overdraped and re-closed by the northern lobe reconnection. Poleward jumps of the position of the flow bursts imply that the flux re-closure caused by the lobe reconnection has some contribution to the polar cap contraction.
Acknowledgements. We would like to thank the PIs of the
Super-DARN radars for provision of the radar data employed in this study. The data employed were from radars funded by the research fund-ing agencies of Canada, France, the UK, USA and Japan. We would also like to thank M. Ruohoniemi of the Johns Hopkins University Applied Physics Laboratory for provision of the “Map-Potential” algorithm software. The DMSP particle detectors were designed by D. Hardy of AFRL, and data were obtained from JHU/APL. We thank D. Hardy, F. Rich, and P. Newell for its use. We gratefully ac-knowledge the Center for Space Sciences at the University of Texas at Dallas and the US Air Force for providing the DMSP thermal plasma data. We would also like to thank N. Ness and C. Smith for provision of ACE magnetometer data, D. McComas for provi-sion of ACE SWEPAM data. This work was supported by National Natural Science Foundation of China (NSFC 40574075, 40236058, 40390154, 40310223) and UK Particle Physics and Astronomy Re-search Council (PPA/G/O/2003/00013).
Topical Editor T. Pulkkinen thanks two referees for their help in evaluating this paper.
References
Baker, K. B., and Wing, S.: A new magnetic coordinate system for conjugate studies at high latitudes, J. Geophys. Res., 94, 9139– 9143, 1989.
Bristow, W. A., Ruohoniemi, J. M., and Greenwald, R. A.: Super Dual Auroral Radar Network observations of convection during a period of small-magnitude northward IMF, J. Geophys. Res, 103, 4051–4061, 1998.
Chang, S.-W., Gallagher, D. L., Spann, J. F., Mende, S. B., Green-wald, R. A., and Newell, P. T.: Cusp and LLBL as sources of the isolated dayside auroral feature during northward IMF, J. Geo-phys. Res., 109, A12222, doi:10.1029/2004JA010619, 2004. Chisham, G., Freeman, M. P., Coleman, I. J., Pinnock, M., Hairston,
M. R., Lester, M., and Sofko, G.: Measuring the dayside recon-nection rate during an interval of due northward interplanetary magnetic field, Ann. Geophys., 22, 4243–4258, 2004.
Cowley, S. W. H.: Interpretation of observed relations between so-lar wind characteristics and effects at ionospheric altitudes, in: High-Latitude Plasma Physics, edited by: Hultqvist, B. and Hag-fors, T., Plenum Press, 225–249, 1983.
Cowley, S. W. H.: Magnetospheric and ionospheric flow and the interplanetary magnetic field, in: Physical basis of the Iono-sphere in the Solar-Terrestrial System, AGARD CP-295, 4/1-4/14, 1981.
Cowley, S. W. H. and Lockwood, M.: Excitation and decay of so-lar wind-driven flows in the magnetosphere-ionosphere system, Ann. Geophys., 10, 103–115, 1992.
Crooker, N. U.: Reverse convection, J. Geophys. Res., 97, 19 363– 19 372, 1992.
Davies, J. A., Yeoman, T. K., Rae, I. J., Milan, S. E., Lester, M., Lockwood, M., and McWilliams, K. A.: Ground-based obser-vations of the auroral zone and polar cap ionospheric responses to dayside transient reconnection, Ann. Geophys., 20, 781–794, 2002.
Dungey, J. W.: The structure of the exosphere, or, adventures in velocity space, Geophysics, in: The Earth’s Environment, edited by: Dewitt, C., Hieblot, J., and Lebau, A., Gordon and Breach, Newark, N.J., 505, 1963.
Freeman, M. P., Farrugia, C. J., Burlaga, L. F., Hairston, M. R., Greenspan, M. E., Ruohoniemi, J. M., and Lepping, R. P.: The interaction of a magnetic cloud with the earth: ionospheric con-vection in the northern and southern hemispheres for a wide range of quasi-steady interplanetary magnetic field conditions, J. Geophys. Res., 98, 7633–7655, 1993.
Frey, H. U., Mende, S. B., Immel, T. J., Fuselier, S. A., Claflin, E. S., Ge’rard, J.-C., and Hubert, B.: Proton aurora in the cusp, J. Geophys. Res., 107, 1091, doi:10.1029/2001JA900161, 2002. Frey, H. U., Phan, T. D., Fuselier, S. A., and Mende, S. B.:
Con-tinuous magnetic reconnection at Earth’s magnetopause, Nature, 426, 533, doi:10.1038/nature02084, 2003.
Fuselier, S. A., Petrinec, S. M., and Trattner, K. J.: Stability of the high-latitude reconnection site for steady northward IMF, Geo-phys. Res. Lett., 27, 473–476, 2000.
Goertz, C. K., Nielsen, E., Korth, A., Glassmeier, K.-H., Haldoupis, C., Hoeg, P., and Hayward, D.: Observations of a possible sig-nature of flux transfer events, J. Geophys. Res., 90, 4069–4078, 1985.
Greenwald, R. A., Baker, K. B., Dudeney, J. R., Pinnock, M., Jones, T. B., Thomas, E. C., Villain, J.-P., Cerisier, J.-C., Senior, C., Hanuise, C., Hunsucker, R. D., Sofko, G., Koehler, J., Nielsen, E., Pellinen, R., Walker, A. D. M., Sato, N., and Yamagishi, H.: DARN/ SuperDARN: a global view of the dynamics of high-latitude convection, Space Sci. Rev., 71, 761–796, 1995. Haerendel, G., Paschmann, G., Sckopke, N., Rosenbauer, H., and
Hedgecock, P. C.: The frontside boundary layer of the magne-topause and the problem of reconnection, J. Geophys. Res., 83, 3195–3216, 1978.
Hanuise, C., Villain, J. P., Gresillon, D., Cabrit, B., Greenwald, R. A., and Baker, K. B.: Interpretation of HF radar ionospheric Doppler spectra by collective wave scattering theory, Ann. Geo-phys., 11, 29–39, 1993.
Hardy, D. A., Schmitt, L. K., Gussenhoven, M. S., Marshall, F. J., Yeh, H. C., Shumaker, T. L., Hube, A., and Pantazis, J.: Precipi-tating electron and ion detectors (SSJ/4) for the block 5D/Flights 6-10 DMSP satellites: Calibration and data presentation, Rep. AFGL-TR-84-0317, Air Force Geophys. Lab., Hanscom Air Force Base, Mass., 1984.
Heppner, J. P.: Polar cap electric field distributions related to the interplanetary magnetic field direction, J. Geophys. Res., 27, 4877–4887, 1972.
Khan, H. and Cowley, S. W. H.: Observations of the response time of high latitude ionospheric convection to variations in the in-terplanetary magnetic field using EISCAT and IMP-8 data, Ann. Geophys., 17, 1306–1335, 1999.
Lester, M., Freeman, M. P., Southwood, D. J., Waldock, J. A., and Singer, H. J.: A study of the relationship between interplanetary parameters and large displacements of the nightside polar cap boundary, J. Geophys. Res., 95, 21 133–21 145, 1990.
Lester, M., Chapman, P. J., Cowley, S. W. H., Crooks, S. J., Davies, J. A., Hamadyk, P., McWilliams, K. A., Milan, S. E., Parsons, M. J., Payne, D. B., Thomas, E. C., Thornhill, J. D., Wade, N. M., Yeoman, T. K., and Barnes, R. J. : Stereo CUTLASS – A new capability for the SuperDARN HF radars, Ann. Geophys., 22, 459–473, 2004.
Lockwood, M. and Moen, J.: Reconfiguration and closure of lobe flux by reconnection during northward IMF: possible evidence for signatures in cusp/cleft auroral emissions, Ann. Geophys.,
17, 996–1011, 1999.
Lockwood, M., McCrea, I. W., Milan, S. E., Moen, J., Cerisier, J. C. and Thorolfsson, A.: Plasma structure within poleward-moving cusp/cleft auroral transients: EISCAT Svalbard radar observa-tions and an explanation in terms of large local time extent of events, Ann. Geophys., 18, 1027–1042, 2000.
Lu, G., Onsager, T. G., Le, G., and Russell, C. T.: Ion injections and magnetic field oscillations near the high-latitude magnetopause associated with solar wind dynamic pressure enhancement, J. Geophys. Res., 109, A06208, doi:10.1029/2003JA010297, 2004. Maezawa, K.: Magnetosphere convection induced by the positive and negative Z components of the interplanetary magnetic field: quantitative analysis using polar cap magnetic records, J. Geo-phys. Res., 81, 2289–2303, 1976.
Matsuoka, A., Tsuruda, K., Hayakawa, H., Mukai, T., and Nishida, A.: Electric field structure and ion precipitation in the polar re-gion associated with northward interplanetary magnetic field, J. Geophys. Res., 101, 10 711–10 736, 1996.
McComas, D. J., Bame, S. J., Barker, P., Feldman, W. C., Phillips, J. L., Riley, P., and Griffee, J. W.: Solar Wind Electron Proton Alpha Monitor (SWEPAM) for the Advanced Composition Ex-plorer, Space Sci. Rev., 86, 563–612, 1998.
Moen, J., Lockwood, M., Oksavik, K., Carlson, H. C., Denig, W. F., van Eyken, A. P., and McCrea I. W.: The dynamics and relation-ships of precipitation, temperature and convection boundaries in the dayside auroral ionosphere, 22, 1973–1987, 2004.
Moen, J., Sandholt, P. E., Lockwood, M., Denig, W. F., Lovhaug, U. P., Lybekk, B., Egeland, A., Opsvik, D., and Friis-Christensen, E.: Events of enhanced convection and related dayside auroral activity, J. Geophys. Res., 100, 23 917–23 934, 1995.
Milan, S. E., Lester, M., Cowley, S. W. H., and Brittnacher, M.: Convection and auroral response to a southward turning of the IMF: Polar UVI, CUTLASS and IMAGE signatures of transient magnetic flux transfer at the magnetopause, J. Geophys. Res., 105, 15 741–15 756, 2000.
Milan, S. E., Lester, M., Cowley, S. W. H., Moen, J., Sandholt, P. E., and Owen, C. J.: Meridian- scanning photometer, coherent HF radar and magnetometer observations of the cusp: a case study, Ann. Geophys., 17, 159–172, 1999.
Moore, T. E., Fok, M.-C., and Chandler, M. O.: The
dayside reconnection X line, J. Geophys. Res., 107,
doi:10.1029/2002JA009381, 2002.
Morley, S. K. and Lockwood, M.: The dependence of cusp ion sig-natures on the reconnection rate, Ann. Geophys., 21, 947–953, 2003.
Newell, P. T. and Meng, C.-I.: Mapping of the dayside ionosphere to the magnetopause according to particle precipitation events, Geophys. Res. Lett., 19, 609–612, 1992.
Øieroset, M., Sandholt, P. E., Denig, W. F., and Cowley, S. W. H.: Northward interplanetary magnetic field cusp aurora and high-latitude magnetopause reconnection, J. Geophys. Res., 102, 11 349–11 362, 1997.
Onsager, T. G. and Lockwood, M.: High-latitude particle precipita-tion and its relaprecipita-tionship to magnetospheric source regions, Space Sci. Rev., 80, 77–107, 1997.
Onsager, T. G., Chang, S.-W., Perez, J. D., Austin, J. B., and Janoo, L. X.: Low-altitude observations and modeling of quasi-steady magnetopause reconnection, J. Geophys. Res., 100, 11 831– 11 843, 1995.
Onsager, T. G., Scudder, J. D., Lockwood, M., and Russell, C. T.: Reconnection at the high-latitude magnetopause during north-ward interplanetary magnetic field conditions, J. Geophys. Res., 106, 25 467–25 488, 2001.
Pinnock, M., Rodger, A. S., Dudeney, J. R., Rich, F., and Baker, K. B.: High spatial and temporal resolution observations of the ionospheric cusp, Ann. Geophys., 13, 919–925, 1995.
Provan, G., Yeoman, T. K., and Milan, S. E.: CUTLASS Finland radar observations of the ionospheric signatures of flux transfer events and the resulting plasma flows, Ann. Geophys., 16, 1411– 1422, 1998.
Provan, G., Lester, M., Cowley, S. W. H., Grocott, A., Milan, S. E., Hubert, B., and Khan, H.: Modulation of dayside recon-nection during northward IMF, J. Geophys. Res., 110, A10211, doi:10.1029/2004JA010980, 2005.
Reiff, P. H. and Burch, J. L.: IMF By -dependent plasma flow
and Birkland currents in the dayside magnetosphere, 2. A global model for northward and southward IMF, J. Geophys. Res., 90, 1595–1609, 1985.
Reiff, P. H.: Sunward convection in both polar caps, J. Geophys. Res., 87, 5976–5980, 1982.
Ruohoniemi, J. M. and Greenwald, R. A.: Statistical patterns of high-latitude convection obtained from Goose Bay HF radar ob-servations, J. Geophys. Res., 101, 21 743–21 763, 1996. Russell, C. T. and Elphic, R. C.: Initial ISEE magnetometer results:
Magnetopause observations, Space Sci. Rev., 22, 681–715, 1978. Ruohoniemi, J. M., Greenwald, R. A., Baker, K. B., Villain, J. P., and McCready, M. A.: Drift motions of small-scale irregularities in the high-latitude F region: an experimental comparison with plasma drift motions, J. Geophys. Res., 92, 4553–4564, 1987. Ruohoniemi, J. M. and Baker, K. B.: Large-scale imaging of
high-latitude convection with Super Dual Auroral Radar Network HF radar observations, J. Geophys. Res., 103, 20 797–20 811, 1998. Russell, C. T.: The configuration of the magnetosphere, in: Critical Problems of Magnetospheric Physics, edited by: Dyer, R., Nat. Acad. of Sci., Washington, D.C., 1–16, 1972.
Sandholt, P. E., Farrugia, C. J., Cowley, S.W. H., Lester, M., Denig, W. F., Cerisier, J.-C., Milan, S. E., Moen, J., Trondsen, E., and Lybekk, B.: Dynamic cusp aurora and associated pulsed re-verse convection during northward interplanetary magnetic field, J. Geophys. Res., 105, 12 869–12 894, 2000.
Sandholt, P. E., Farrugia, C. J., Cowley, S. W. H., and Lester, M.: Dayside auroral bifurcation sequence during By-dominated
in-terplanetary magnetic field: Relationship with merging and lobe convection cells, J. Geophys. Res., 106, 15 429–15 444, 2001. Sandholt, P. E., Farrugia, C. J., Moen, J., and Cowley, S. W.
H.: Dayside auroral configurations: Response to southward and northward rotations of the interplanetary magnetic field, J. Geo-phys. Res., 103, 20 279–20 295, 1998.
Sandholt, P. E., Moen, J., Farrugia, C. J., Cowley, S. W. H., Lester, M., Milan, S. E., Valladares, C., Denig, W. F., and Eriksson, S.: Multi-site observations of the association between aurora and plasma convection in the cusp/polar cap during a southeastward (By≈|Bz|) IMF orientation, Ann. Geophys., 21, 539–558, 2003.
Siscoe, G. L. and Huang, T. S.: Polar cap inflation and deflation, J. Geophys. Res., 90, 543–547, 1985.
Smith, C. W., Acu˜na, M. H., Burlaga, L. F., L’Heureux, J., Ness, N. F., and Scheifele, J.: The ACE Magnetic Field Experiment, Space Sci. Rev., 86, 613–622, 1999.
Stone, E. C., Frandsen, A. M., Mewaldt, R. A., Christian, E. R., Margolies, D., Ormes, J. F., and Snow, F.: The Advanced Com-position Explorer, Space Sci. Rev., 86, 1–22, 1998.
Tsyganenko, N. A.: An empirical model of the substorm current wedge, J.Geophys.Res., 102, 19 935–19 942, 1997.
Troshichev, O. A., Shishkina, E. M., Meng, C.-I., and Newell, P. T.: Identification of the poleward boundary of the auroral oval using characteristics of ion precipitation, J. Geophys. Res., 101, 5035–5046, 1996.
Van Eyken, A. P., Risbeth, H., and Saunders, M. A.: Initial EISCAT observations of plasma convection at invariant latitudes of 70– 77◦, J. Atmos. Terr. Phys., 46, 635–641, 1984.
Wygant, J. R., Torbert, R. B., and Mozer, F. S.: Comparison of S3-2 polar cap potential drops with the interplanetary magnetic field and models of magnetopause reconnection, J. Geophys. Res., 88, 5727–5735, 1983.
Wild, J. A., Cowley, S. W. H., Davies, J. A., Khan, H., Lester, M., Milan, S. E., Provan, G., Yeoman, T. K., Balogh, A., Dunlop, M., Fornac¸on, K.-H., and Georgescu, E.: First simultaneous obser-vations of flux transfer events at the high-latitude magnetopause by the Cluster spacecraft and pulsed radar signatures in the con-jugate ionosphere by the CUTLASS and EISCAT radars, Ann. Geophys., 19, 1491–1508, 2001.
Woch, J. and Lundin, R.: Magnetosheath plasma precipitation in the polar cusp and its control by the interplanetary magnetic field, J. Geophys. Res., 97, 1421–1430, 1992.
Yeoman, T. K., Lester, M., Cowley, S. W. H., Milan, S. E., Moen, J., and Sandholt, P. E.: Simultaneous observations of the cusp in optical, DMSP and HF radar data, Geophys. Res. Lett., 24, 2251–2254, 1997.