HAL Id: hal-01842470
https://hal.umontpellier.fr/hal-01842470
Submitted on 11 Jun 2021
HAL is a multi-disciplinary open access
archive for the deposit and dissemination of
sci-entific research documents, whether they are
pub-lished or not. The documents may come from
teaching and research institutions in France or
abroad, or from public or private research centers.
L’archive ouverte pluridisciplinaire HAL, est
destinée au dépôt et à la diffusion de documents
scientifiques de niveau recherche, publiés ou non,
émanant des établissements d’enseignement et de
recherche français ou étrangers, des laboratoires
publics ou privés.
Antibody-free quantification of seven tau peptides in
human CSF using targeted mass spectrometry
Pauline Bros, Jérôme Vialaret, Nicolas Barthelemy, Vincent Delatour, Audrey
Gabelle, Sylvain Lehmann, Christophe Hirtz
To cite this version:
Pauline Bros, Jérôme Vialaret, Nicolas Barthelemy, Vincent Delatour, Audrey Gabelle, et al..
Antibody-free quantification of seven tau peptides in human CSF using targeted mass
spectrome-try. Frontiers in Neuroscience, Frontiers, 2015, 9, �10.3389/fnins.2015.00302�. �hal-01842470�
Edited by: Raymond Scott Turner, Georgetown University, USA Reviewed by: Michal Novak, Slovak Academy of Sciences, Slovakia Nicole Leclerc, Université de Montréal, Canada *Correspondence: Sylvain Lehmann and Christophe Hirtz, Laboratory of Biochemistry and Clinical Proteomics, Institute of Regenerative Medicine - Biotherapy, Centre Hospitalier Universitaire de Montpellier - Hôpital St. Eloi, 80, Av. A. Fliche, 34295 Montpellier Cedex 5, France [email protected]; [email protected] †
These authors have contributed equally to this work.
Specialty section: This article was submitted to Neurodegeneration, a section of the journal Frontiers in Neuroscience Received: 07 May 2015 Accepted: 10 August 2015 Published: 01 September 2015 Citation: Bros P, Vialaret J, Barthelemy N, Delatour V, Gabelle A, Lehmann S and Hirtz C (2015) Antibody-free quantification of seven tau peptides in human CSF using targeted mass spectrometry. Front. Neurosci. 9:302. doi: 10.3389/fnins.2015.00302
Antibody-free quantification of seven
tau peptides in human CSF using
targeted mass spectrometry
Pauline Bros1, 2 †, Jérôme Vialaret1 †, Nicolas Barthelemy1, Vincent Delatour2,
Audrey Gabelle1, 3, Sylvain Lehmann1* and Christophe Hirtz1*
1Laboratoire de Biochimie et de Protéomique Clinique - Institut de Médecine Régénérative et Biothérapies, Centre
Hospitalier Universitaire de Montpellier, Montpellier, France,2Laboratoire National de Métrologie et d’Essais (LNE), Paris,
France,3Centre Mémoire Ressources Recherche, Centre Hospitalier Universitaire de Montpellier, Hôpital Gui de Chauliac,
Université Montpellier I, Montpellier, France
Tau protein concentration in cerebrospinal fluid (CSF) is currently used as a sensitive and specific biomarker for Alzheimer’s disease. Its detection currently relies on ELISA but the perspective of using mass spectrometry (MS) to detect its different proteoforms represents an interesting alternative. This is however an analytical challenge because of its low concentration in the CSF, a biological fluid collected in small volume by lumbar puncture, and with a high structural heterogeneity. To overcome these issues, instead of using immunocapture as previously done, we rather relied on an original two steps pre-fractionation technique of CSF: perchloric acid (PCA) followed by micro solid phase extraction (µSPE). We could then measure seven tau trypsic peptides by Multiple Reaction Monitoring (MRM) on a triple quadrupole mass spectrometer. Quantification was performed using isotopically labeled 15N- recombinant tau protein as internal
standard and validated using CSF pools with low, medium, or high tau concentrations (HTCs). Repeatability, intermediate precision, linearity, limit of quantification (LOQ), and recovery were calculated for the different peptides. This new MRM assay, which allowed for the first time CSF tau protein quantification without immunocapture, has important potential application to follow tau metabolism in both diagnostic and therapeutic research.
Keywords: Alzheimer’s disease, tau protein, human cerebrospinal fluid, LC-MS/MS, quantitative proteomic, triple quadrupole
Introduction
Alzheimer’s disease (AD) is the most common form of dementia, a general term encompassing loss of memory and cognitive functions interfering therefore with activities of daily living. With 35 million of patients worldwide, AD represents 50–80% of cases of dementia and is reaching epidemic proportions in industrialized countries mainly because of the aging of the population.
Abbreviations: AD, Alzheimer Disease; CAV, Cell Accelerator Voltage; CE, Collision Energy; CSF, CerebroSpinal Fluid; ELISA, Enzyme Linked ImmunoAssay; FA, Formic Acid; HLB, Hydrophilic-Lipophilic-Balanced; LOQ, Limit of Quantification; MAPT, Microtubule-Associated Protein Tau; PCA, Perchloric Acid; TCA, Trifluoroacetic Acid; SPE, Solid Phase Extraction; MRM-MS, Multiple Reaction Monitoring Mass Spectrometry; PTM, Post Translational Modifications.
Bros et al. Tau quantification by LC-MS/MS
At neuro-pathological level, AD is characterized by the presence in the brain parenchyma of amyloid plaques and hyperphosphorylated tau (p-tau) proteins aggregated into neurofibrillary tangles (Gabelle et al., 2010). Tau protein is synthesized by a single microtubule-associated protein tau (MAPT) gene (chromosome 17q21) in humans (James et al., 2015) mainly expressed in neurons (Perrin et al., 2009). Tau protein is known to bind neuronal microtubules, promote their assembly, and stabilize them (Drechsel et al., 1992). The hyperphosphorylation occurring in case of AD caused its release from microtubules, destabilizing the axons, and triggering neuronal death (Sergeant et al., 2005). Quantification of tau in cerebrospinal fluid (CSF) is currently used as a sensitive and specific biomarker for AD diagnosis (Andreasen and Blennow, 2005). However, the full quantification of tau in CSF remained an analytical challenge. In fact, this protein has 6 different isoforms (ranging from 352 to 441 amino acids), and is subject to many different post-translational modifications like phosphorylation, glycosylation, and oxidation (Hernandez and Avila, 2007). Moreover, tau is present at very low concentration (Sjögren et al., 2001; Blennow and Vanmechelen, 2003) in CSF which is a highly complex matrix.
Currently, CSF tau quantification is performed in clinical daily routine by immunoassays (ELISA). If immunoassays are sensitive enough to detect low CSF tau concentrations, they present some boundaries: poor linearity, lack of specificity in regards to multiple tau proteoforms and no multiplexing. This is the reason why mass spectrometry (MS) is an interesting alternative in this context. In 2014, McAvoy et al. (2014) has published a quantitative LC-MS/MS method to measure tau in CSF with a sample preparation based on a immunoaffinity. Barthelemy et al. recently quantified 22 tau peptides by high resolution MS (Barthelemy, under review). Since this equipment is very rarely available in clinical laboratories, we used the same sample preparation protocol but quantification was performed on a triple quadrupole mass spectrometer. In this work, we describe the set-up of the first multiplex targeted MS quantification of tau in CSF without the need of immunocapture. The workflow includes a CSF protein precipitation and a solid phase extraction followed by a trypsic digestion. Seven tau proteotypic peptides located in different positions of the protein could be quantified by Selected Reaction Monitoring. This new method has important potential applications to follow tau metabolism in both diagnostic and therapeutic research.
Materials and Methods
Reagents
Perchloric acid (PCA), trifluoroacetic acid (TCA), and hydrogen peroxide (H2O2) were purchased from Sigma Aldrich (Saint
Quentin Fallavier, France). Ammonium bicarbonate and trypsin were obtained from Fluka-Sigma Aldrich (Saint Quentin Fallavier, France) and Promega (Charbonnieres, France), respectively. Water, formic acid (FA), methanol (MeOH) were all ULC-MS grade and purchased from Biosolve (Dieuze, France). Normal Goat serum was obtained from Clinisciences (Nanterre, France). Protein LoBind tube 1.5 mL and Deepwell
plate 96/500 µl Protein LoBind were purchased Eppendorf (Le Pecq, France). Oasis HLB µElution Plate 30 µm, was obtained from Waters (Guyancourt, France). Polypropylene vials and Zorbax 300 SB-C18 1 × 150 mm 3.5 µm were both purchased from Agilent Technologies (Santa Clara, CA, USA).
Human CSF Samples and ELISA CSF Tau Quantification
CSF samples were obtained from patients followed-up by the Montpellier neurological and Clinical Research Memory Centers (CMRR) for cognitive or behavioral disorders. They gave their informed consent for research and for the storage of their sample in an officially registered biological collection (#DC-2008-417) of the certified NFS 96-900 biobank of the CHRU of Montpellier (Ref: BB-0033-00031, www.biobanques.eu). CSF was collected in polypropylene tubes under standardized conditions, preferably between 9:00 a.m. and 1:00 p.m., to minimize the influence of diurnal variation. Each CSF sample was sent to the local laboratory within 4 h after collection and was centrifuged at 1000 g for 10 min at 4◦C. CSF was aliquoted in polypropylene
tubes of 1.5 mL and stored at −80◦C until further analysis.
Tau quantification was performed by ELISA InnoTest Tau from Fujirebio diagnostics following manufacturer’s instructions. Standards and Samples Preparation
Preparation of14N and15N recombinant tau protein
(441) standards
14N and 15N recombinant tau protein (441) were obtained
from Dr. Guy Lippens (UMR 8525, Lille Pasteur Institute, France). Lyophilized standards were resuspended at 1 mg/mL with ammonium bicarbonate 50 mmol/L. The solution was then aliquoted into 50 µL in LoBind tubes and stored at −80◦C until
use. Concentration of14N and15N tau primary calibrators was determined by amino acid analysis. Ten calibration standards were prepared gravimetrically using an analytical balance model Sartorius CPA224S-OCE (Sartorius Goettingen, Germany) by adding a fixed amount of15N tau to variable amounts of14N tau.
Standards were diluted with 50 mmol/L ammonium bicarbonate and 1 mmol/L BSA and then further diluted in 0.5% goat serum so as to reach final concentration of 5 ng/mL for15N tau while that of14N tau ranged from 0.3 to 32.1 ng/mL.
Series of 8–10 human CSF samples with tau concentrations determined by ELISA were mixed to obtain 3 CSF pools with Low Tau Concentration (LTC), Medium Tau Concentration (MTC), and High Tau Concentration (HTC).
Precipitation, µSPE extraction and protein digestion
Sample extraction of tau peptides were performed according to Barthelemy et al. (Barthelemy, under review). Briefly, 450 µL of CSF or 0.5% serum samples were mixed with 50 µL of
15N-tau-441 (50 ng/mL) in a LoBind tube. Protein precipitation
was performed by adding 25 µL of 70% PCA. Samples were then vortexed, kept on ice for 15 min before centrifugation at 17,000 g at 4◦C during 15 min to obtain a clear supernatant.
Supernatants were acidified with 50 µL of 1% trifluoroacetic acid (TFA). SPE with a hydrophilic-lipophilic balance SPE 96-well plate was conditioned with 300 µL of MeOH and equilibrated with 500 µL of 0.1% TFA. Samples were loaded
and washed with 500 µL of 0.1% TFA. For protein oxidation, 500 µL of 3% FA and 3% H2O2 solution in water was loaded
on cartridge and kept 12 h at 4◦C. Thereafter, cartridge was
washed with 500 µL of 0.1%TFA. Oxidized tau proteins were eluted with 100 µL of 35% acetonitrile 0.1% TFA. Extracts were evaporated to dryness with a Speedvac instrument from LabConco (Kansas City, MO, USA) and resuspended with 40 µL of 1 ng/µL trypsin solution in 50 mM ammonium bicarbonate. The digestion was performed for 24 h at 37◦C on a Thermomixer
R from Eppendorf (Hambourg, Germany) and stopped with 5 µL of 10% FA and stored at −20◦C prior to LC-MS/MS analysis
(Figure 1). LC-MS/MS
Liquid chromatography (LC) separation
LC separation was carried out on a 1290 LC system (Agilent technologies). Separation was performed with a reversed-phase Zorbax 300 SB-C18 column maintained at 60◦C. The mobile
phases consisted in (A) 0.1% FA in water and (B) 0.1% FA in MeOH. After an isocratic step of 2 min at 2% B, a linear gradient from 10 to 70% B was run over the next 13 min with a flow rate of 50 µL/min. The column was then washed for 1 min with 90% B and re-equilibrated during 5 min with 2% B. Eluent flow before 2 min and after 15 min was discarded with a divert valve to reduce contamination of the mass spectrometer.
MS/MS analysis
Mass spectrometric detection was performed using a 6490 triple quadrupole with an ESI source operating in positive mode and in dynamic MRM mode (Agilent technologies, Waldbronn, Germany). The control of the LC-MS/MS was done with MassHunter Software (Agilent technologies, Waldbronn, Germany). The ESI spray was set up according to the following settings: capillary tension 2500 V, gas flow 16 L/min with temperature of 140◦C, sheath gas flow 7 L/min with temperature
of 250◦C, nebulizer 40 psi. Precursor ions were transferred inside
the first quadrupole with high pressure ion funnel RF set to 150 V and low pressure in funnel RF set to 110 V. Collision energies (CE) and cell accelerator voltages (CA) were optimized for the peptide transitions of interest. The Skyline 2.6 version was used to conduct data treatment. All transitions per peptide were used as quantifiers and were automatically detected on specific retention time windows. LC-MS/MS were repeated 5 times for analytical validation.
Method Validation
The calibration curve was established by linear regression and its linearity was validated according to the criterion of a Pearson correlation r2 > 0.99. The Limit of Quantification (LOQ) was
defined as the concentration of the lowest calibration point with the relative standard deviation (RSD) of the area ratios14N tau peptide/15N tau peptide was less than 20%. Absence of memory effects was tested by re-analyzing the calibrator point without adding any 14N recombinant tau protein in the end of the
analytical sequence.
The intermediate precision of the entire protocol was evaluated by preparing and measuring the 20 ng/mL calibration
standard over 6 different days. LC-MS repeatability was tested on the 20 ng/mL calibration standard by injecting it 4 times in a row. RSD was calculated from the area ratios14N tau peptide/15N tau peptide.
Recovery was evaluated by analyzing human CSF sample with LTC spiked to a final concentration of 6.6 ng/mL of 14N tau.
Recovery was calculated by applying the following equation: Recovery (%) = (Measured added concentration/Theoretical added concentration) × 100.
Results
Method Development, Linearity, and Recovery
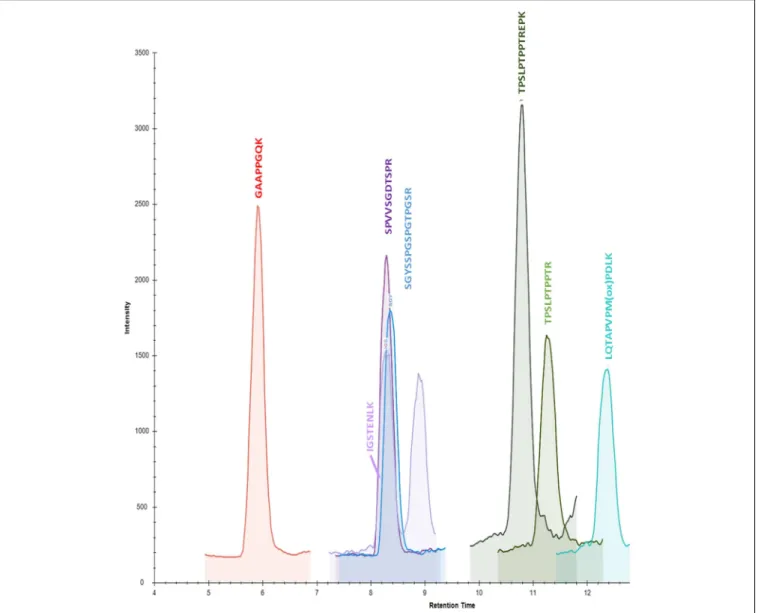
Starting from 22 validated peptides of CSF tau protein obtained with high resolution MS in PRM mode (Barthelemy, under review), 7 peptides (GAAPPGQK, SGYSSPGSPGTPGSR, TPSLPTPPTREPK, TPSLPTPPTR, LQTPVPMPDLK, IGSTENLK, SPVVSGDTSPR) were validated using triple quadrupole in MRM mode (Table 1). One precursor ion and 2 products ion transitions were selected for the 22 peptides previously validated in PRM. We kept the most intense precursor ions (doubly charged) after optimization of the CE. Each transition was verified using Skyline Software. For the selection, three parameters were considered: signal intensities, presence of interferences and concentration in CSF pools (Table 1). The seven validated peptides (Figure 2) in human CSF had repeatable retention times with a mean RSD of 1.53% (Table 2).
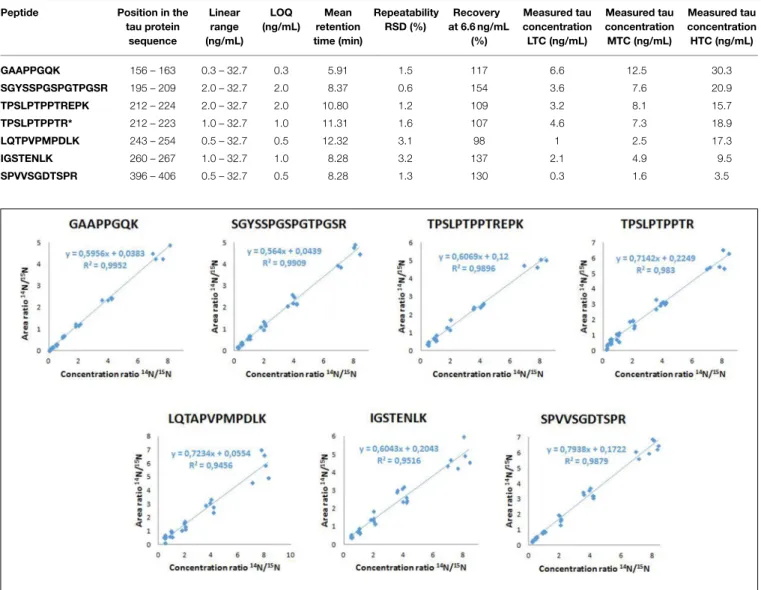
Between successive LC-MS/MS analysis, no memory effect phenomenon was observed. The calibration linearity was assessed using 10 point calibration curves of14N tau standard spiked in normal goat serum 0.5%. MRM results showed linearity over 2–32.7 ng/mL concentration range (Table 2). Calibration curves were generated by linear regression analysis by plotting the peak area ratios (14N tau/15N tau) vs. concentration
ratios for all measured peptides. The regression coefficients were calculated above 0.98 for the 7 considered peptides. Typical calibration curves are shown in Figure 3. The LOQs were determined over 0.3–2 ng/mL range depending on the peptide (Table 2). Calculated recovery rates were 121 ± 19% for the 7 tau peptides and using the 6.6 ng/mL calibration standard (n = 3). For the TPSLPTPPTR corresponding to the epitope of the ELISA capture antibody, a recovery of 107% was measured.
Precision Studies
Precision of the entire protocol (including both sample preparation and LC-MS/MS analysis) was evaluated using these samples. The RSD of the CSF pools processing was below 6% for the 7 targeted peptides. LC-MS/MS analysis was repeatable with RSD of less than 4% (n = 4).
Quantification of Tau Protein in CSF Pools
Tau concentrations measured in the 3 CSF pools (LTC, MTC, and HTC) displayed different results for the 7 peptides (Table 2). For the LTC, depending on the targeted peptide, MRM-calculated concentrations ranged from 0.3 to 6.6 ng/mL, for
Bros et al. Tau quantification by LC-MS/MS
FIGURE 1 | Sample extraction:15N recombinant tau was spiked on CSF and proteins were then precipitated. Remaining proteins including tau in the supernatant were extracted on HLB cartridges. During extraction, an oxidation step was performed to oxidize methionine. Extracts were dried and then enzymatically digested by trypsin. Proteotypic peptides of tau protein were then quantified in the sample by LC-MS/MS.
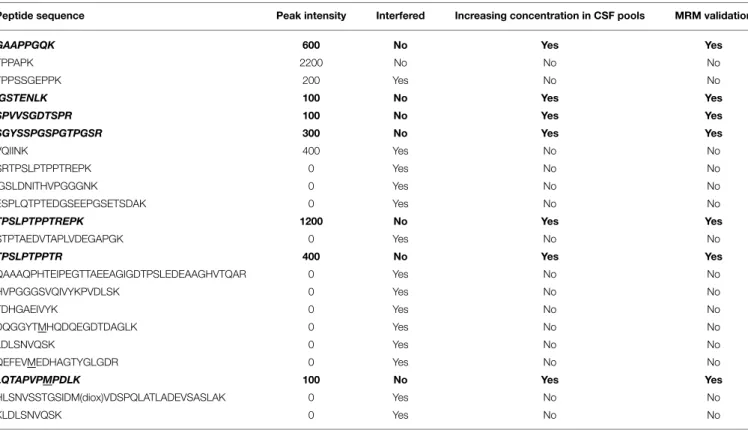
TABLE 1 | Peptide selection: starting from 22 validated peptides of CSF tau protein obtained with high resolution mass spectrometry in PRM mode (Barthelemy, under review), the 7 quantifed peptides (GAAPPGQK, SGYSSPGSPGTPGSR, TPSLPTPPTREPK, TPSLPTPPTR, LQTPVPMPDLK, IGSTENLK, SPVVSGDTSPR) were selected by taking into account the three following parameters: signal intensities, presence of interferences, and concentration in CSF pools.
Peptide sequence Peak intensity Interfered Increasing concentration in CSF pools MRM validation
GAAPPGQK 600 No Yes Yes
TPPAPK 2200 No No No
TPPSSGEPPK 200 Yes No No
IGSTENLK 100 No Yes Yes
SPVVSGDTSPR 100 No Yes Yes
SGYSSPGSPGTPGSR 300 No Yes Yes
VQIINK 400 Yes No No
SRTPSLPTPPTREPK 0 Yes No No
IGSLDNITHVPGGGNK 0 Yes No No
ESPLQTPTEDGSEEPGSETSDAK 0 Yes No No
TPSLPTPPTREPK 1200 No Yes Yes
STPTAEDVTAPLVDEGAPGK 0 Yes No No TPSLPTPPTR 400 No Yes Yes QAAAQPHTEIPEGTTAEEAGIGDTPSLEDEAAGHVTQAR 0 Yes No No HVPGGGSVQIVYKPVDLSK 0 Yes No No TDHGAEIVYK 0 Yes No No DQGGYTMHQDQEGDTDAGLK 0 Yes No No LDLSNVQSK 0 Yes No No QEFEVMEDHAGTYGLGDR 0 Yes No No
LQTAPVPMPDLK 100 No Yes Yes
HLSNVSSTGSIDM(diox)VDSPQLATLADEVSASLAK 0 Yes No No
KLDLSNVQSK 0 Yes No No
Bold and italics correspond to the 7 chosen tau peptides. Underline characters (M) correspond to oxidized methionine.
the MTC from 1.6 to 12.5 ng/mL and for the HTC from 3.5 to 30.3 ng/mL. Calculated ratio between endogenous tau (14N) and tau standard (15N) are presented in Figure 4, showing the
different concentrations obtained for each peptide in the three CSF pools. For the peptide TPSLPTPPTR corresponding to the epitope of the ELISA capture antibody, concentrations of 4.6 ng/mL for the LTC, 7.3 ng/mL for the MTC and 18.9 ng/mL for the HTC were obtained.
ELISA Quantitation and Correlation with MRM
Tau concentration determined in the LTC, MTC, and HTC pools using ELISA were 184 pg/mL, 399 pg/mL, and 1096 pg/mL, respectively. For the 7 peptides, concentrations obtained using MRM were highly correlated with those measured by ELISA (r2 above 0.99) (see Figure 5 for the TPSLPTPPTR peptide as an example). However, ELISA concentrations were 17–25 times lower than those measured by MRM.
FIGURE 2 | Chromatogram of calibration standard at 32.1 ng/mL in 0.5% normal goat serum after sample preparation.
Discussion
In this work, we presented for the first time an MRM based multiplex assay for tau in the CSF that did not necessitate any immuno-capture. Thanks to an adaptation of the “protein standard for absolute quantification” (PSAQ) approach (Picard et al., 2012), to an original two step purification protocol, and to the latest generation of triple quadrupole MS analyzers, we realized the tour-de-force of quantifying in parallel 7 proteotypic peptides of the tau protein. Previous MS attempts to measure tau in the CSF of patients were in fact limited to a few peptides and/or rely on immuno-precipitation procedures that are potentially subject to cross-reactivity and difficulty to obtain reproducible results when using different batches of antibodies (Portelius et al., 2008; McAvoy et al., 2014). Our method was successfully applied to the analysis of CSF pools with different levels of tau protein. Based on previous data obtained using the same sample
preparation workflow but using targeted high resolution mass spectrometry (PRM), we validated 7 peptides using our triple quadrupole (MRM) compared to the 22 beforehand validated by PRM on a high resolution mass spectrometer. If MRM can be considered to be less performing in terms of resolution, it has multiple advantages compared to PRM. Mainly, the method development is much easier, data amount generated are lighter and the data processing is highly facilitated thanks to the Skyline software. Additionally, our method can be much more easily be transferred in a clinical environment where most popular mass spectrometers are triple quadrupoles.
The MRM technology also provides several analytical advantages compared with standard ELISA methods (Lehmann et al., 2013). MRM is known to be highly selective and specific (Lehmann et al., 2013) allowing to determine the absolute concentration of the targeted protein, provided that appropriate calibration standards are available. The MRM
Bros et al. Tau quantification by LC-MS/MS
TABLE 2 | Method validation summary.
Peptide Position in the tau protein sequence Linear range (ng/mL) LOQ (ng/mL) Mean retention time (min) Repeatability RSD (%) Recovery at 6.6 ng/mL (%) Measured tau concentration LTC (ng/mL) Measured tau concentration MTC (ng/mL) Measured tau concentration HTC (ng/mL) GAAPPGQK 156 – 163 0.3 – 32.7 0.3 5.91 1.5 117 6.6 12.5 30.3 SGYSSPGSPGTPGSR 195 – 209 2.0 – 32.7 2.0 8.37 0.6 154 3.6 7.6 20.9 TPSLPTPPTREPK 212 – 224 2.0 – 32.7 2.0 10.80 1.2 109 3.2 8.1 15.7 TPSLPTPPTR* 212 – 223 1.0 – 32.7 1.0 11.31 1.6 107 4.6 7.3 18.9 LQTPVPMPDLK 243 – 254 0.5 – 32.7 0.5 12.32 3.1 98 1 2.5 17.3 IGSTENLK 260 – 267 1.0 – 32.7 1.0 8.28 3.2 137 2.1 4.9 9.5 SPVVSGDTSPR 396 – 406 0.5 – 32.7 0.5 8.28 1.3 130 0.3 1.6 3.5
FIGURE 3 | Calibration curves of the 7 tau peptides.
absolute quantitation of the target protein takes benefit of the advantages of isotope dilution MS (Huillet et al., 2012). Adding a known amount of an isotopically labeled internal standard at the beginning of sample preparation protocol makes it possible to account for potential material non-recovery during sample preparation, which results in better accuracy and precision. MRM assay thus showed robust pre-analytical and analytical precision, matching current clinical needs.
Interestingly, the value obtained for the quantification of tau between the two approaches (MRM vs. ELISA) showed that the concentration measured with our MRM-MS assay with the TPSLPTPPTR peptide was around 17–25 times higher than that with the ELISA test. This result is in modest agreement with the work ofMcAvoy et al. (2014)who had found a correlation slope of 1.8 between MSD and their IA-MS method using the same peptide. The differences between the two LC-MS/MS approaches are probably due to the different sample preparation techniques (protein precipitation followed by SPE vs. immunoaffinity)
and the different standards used to establish the calibration curves. The striking difference observed between LC-MS/MS and ELISA results raises the question of what method is the most accurate. However, a first evidence in favor of LC-MS/MS is that our results were in pretty good agreement with those published in McAvoy et al.: despite different sample preparation procedures and different calibration standards were used, the 2 studies shown that for Tau concentrations below 500 pg/mL, immunoassays are negatively biased against LC/MS. Another evidence that immunoassays underestimated tau concentration is that the concentration of our protein standard was 20 ng/mL when measured by amino acid analysis, 21.4 ng/mL by LC-MS/MS and around 2 ng/mL by ELISA (data not shown). However, we didn’t check that the buffer in which standards were dissolved (ammonium bicarbonate 50 mM) is compatible with Innogenetics ELISA. It can’t be ruled out that standards and even our 3 CSF pools were not commutable for ELISA tests, thereby introducing matrix effects that could explain
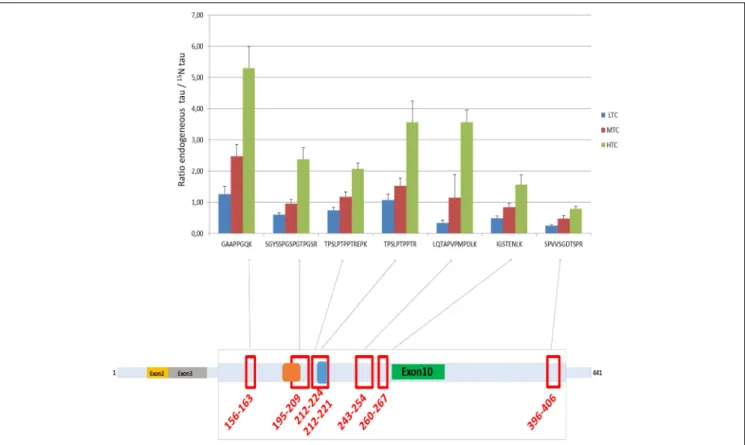
FIGURE 4 | Ratio endogenous tau/15N tau in the three CSF pools (LTC, MTC, and HTC) for the 7 peptides. The scheme represents the localization of the 7 peptides on the tau protein.
FIGURE 5 | Correlation between MRM and ELISA results.
the very large discrepancy between LC-MS/MS and ELISA results. In contrary, an argument in favor of ELISA is that there were important differences in the relative levels of the 7 measured tau peptides measured by LC-MS/MS, depending on their localization on the protein sequences; as illustrated in the
Figure 4. This was observed with small variations in the different pools analyzed. This result can be explained by the strong structural heterogeneity of the tau protein. Indeed, it has many proteoforms (Smith and Kelleher, 2013): six isoforms (ranging from 352 to 441 amino acids), truncated forms and forms
widely modified post-translationally by glycosylation, oxidation, and phosphorylation at more than 80 sites (Iqbal et al., 2010; Hanger et al., 2014). As phosphorylation and any other post-translational modification of tau peptides induce a mass shift that results in an underestimation of total tau concentration measured by LC-MS/MS, it could be suspected that LC-MS/MS results should have been even higher. This explains why total tau concentrations measured using different peptides were not in good agreement and suggests that total tau concentration can only be measured using peptides that are neither subject to any truncation nor post-translational modification. In this sense, the peptide GAAPPGQK appears to be the best candidate because it is short enough and it can’t be phosphorylated. This hypothesis is supported by the fact that among the 7 considered peptides, total tau concentration was the highest when estimated with this peptide (see Table 2). Despite total tau concentrations estimated using all the 7 peptides are in insufficient agreement to support the use of peptides that can be phosphorylated, the results obtained with the 6 other peptides also show an excellent correlation between ELISA and LC-MS/MS, which suggest that they can have a clinical relevancy as independent biomarkers. However, to do the comparison with the 7 peptides, all phosphorylated forms should have been measured. The objective of measuring 7 peptides is not really to measure total tau concentration but rather to use the 7 peptides as independent biomarkers. As suggested in Höglund et al. (Höglund et al., 2015), having insights into tau structural characterization and
Bros et al. Tau quantification by LC-MS/MS
providing the opportunity to simultaneously quantify several peptides whose concentration is directly proportional to that of given tau proteoforms will make it possible to discover potentially more predictive biomarkers of AD. A good example is P-Tau (181), that is known to be the most relevant and predictive proteoform of tau. This work thus illustrates the need but also the future perspectives associated with the quantification of a larger number of peptides. Especially, additional investigation using in particular MRM methods designed for phosphopeptides detection (e.g., prefractionation using titanium columns) will be needed to fully interpret our results and provide the analytical methods needed to determine which proteoforms of the tau protein are the most predictive of AD. Even if tau protein is considered as a major biomarker of AD, the protein is also increased when measured by ELISA in other tauopathies like Creutzfeldt–Jakob Disease or Fronto Temporal Dementia (Green et al., 1999; Wang et al., 2010). It will be interesting to use our new method to determine whether the multiplex quantification
of the 7 tau peptides described in our study could help better differentiating pathologies with increased tau in the CSF. In any case, our MRM workflow realized without immunocapture in a clinical laboratory environment represents a major improvement to the state of the art and an interesting alternative and addition to classical ELISA. Further work on large clinical cohorts will be however needed to assess the clinical interest of this new approach.
Acknowledgments
This work was supported by the 2010 National PHRC “ProMara”: Use of targeted quantitative proteomics and metabolic labeling with stable isotopes for the diagnosis and the investigation of neurological disorders and in particular Alzheimer Disease” and through the National French Alzheimer effort (“Plan Alzheimer”). The authors declare no potential conflicts of interest with respect to the authorship and/or publication of this article.
References
Andreasen, N., and Blennow, K. (2005). CSF biomarkers for mild cognitive impairment and early Alzheimer’s disease. Clin. Neurol. Neurosurg. 107, 165–173. doi: 10.1016/j.clineuro.2004.10.011
Blennow, K., and Vanmechelen, E. (2003). CSF markers for pathogenic processes in Alzheimer’s disease: diagnostic implications and use in clinical neurochemistry. Brain Res. Bull. 61, 235–242. doi: 10.1016/S0361-9230(03)00086-8
Drechsel, D. N., Hyman, A. A., Cobb, M. H., and Kirschner, M. W. (1992). Modulation of the dynamic instability of tubulin assembly by the microtubule-associated protein tau. Mol. Biol. Cell 3, 1141–1154. doi: 10.1091/mbc.3.10.1141 Gabelle, A., Roche, S., Geny, C., Bennys, K., Labauge, P., Tholance, Y., et al. (2010). Correlations between soluble alpha/beta forms of amyloid precursor protein and Abeta38, 40, and 42 in human cerebrospinal fluid. Brain Res. 1357, 175–183. doi: 10.1016/j.brainres.2010.08.022
Green, A. J., Harvey, R. J., Thompson, E. J., and Rossor, M. N. (1999). Increased tau in the cerebrospinal fluid of patients with frontotemporal dementia and Alzheimer’s disease. Neurosci. Lett. 259, 133–135. doi: 10.1016/S0304-3940(98)00904-5
Hanger, D. P., Lau, D. H., Phillips, E. C., Bondulich, M. K., Guo, T., Woodward, B. W., et al. (2014). Intracellular and extracellular roles for tau in neurodegenerative disease. J. Alzheimers. Dis. 40(Suppl. 1), S37–S45. doi: 10.3233/JAD-132054
Hernandez, F., and Avila, J. (2007). Tauopathies. Cell. Mol. Life Sci. 64, 2219–2233. doi: 10.1007/s00018-007-7220-x
Höglund, K., Fourier, A., Perret-Liaudet, A., Zetterberg, H., Blennow, K., and Portelius, E. (2015). Alzheimer’s disease - recent biomarker developments in relation to updated diagnostic criteria. Clin. Chim. Acta. doi: 10.1016/j.cca.2015.01.041. [Epub ahead of print].
Huillet, C., Adrait, A., Lebert, D., Picard, G., Trauchessec, M., Louwagie, M., et al. (2012). Accurate quantification of cardiovascular biomarkers in serum using Protein Standard Absolute Quantification (PSAQ) and selected reaction monitoring. Mol. Cell. Proteomics 11:M111.008235. doi: 10.1074/mcp.M111.008235
Iqbal, K., Liu, F., Gong, C. X., and Grundke-Iqbal, I. (2010). Tau in Alzheimer disease and related tauopathies. Curr. Alzheimer Res. 7, 656–664. doi: 10.2174/156720510793611592
James, O. G., Doraiswamy, P. M., and Borges-Neto, S. (2015). PET imaging of tau pathology in Alzheimer’s disease and tauopathies. Front. Neurol. 6:38. doi: 10.3389/fneur.2015.00038
Lehmann, S., Hoofnagle, A., Hochstrasser, D., Brede, C., Glueckmann, M., Cocho, J. A., et al. (2013). Quantitative Clinical Chemistry Proteomics (qCCP) using
mass spectrometry: general characteristics and application. Clin. Chem. Lab. Med. 51, 919–935. doi: 10.1515/cclm-2012-0723
McAvoy, T., Lassman, M. E., Spellman, D. S., Ke, Z., Howell, B. J., Wong, O., et al. (2014). Quantification of tau in cerebrospinal fluid by immunoaffinity enrichment and tandem mass spectrometry. Clin. Chem. 60, 683–689. doi: 10.1373/clinchem.2013.216515
Perrin, R. J., Fagan, A. M., and Holtzman, D. M. (2009). Multimodal techniques for diagnosis and prognosis of Alzheimer’s disease. Nature 461, 916–922. doi: 10.1038/nature08538
Picard, G., Lebert, D., Louwagie, M., Adrait, A., Huillet, C., Vandenesch, F., et al. (2012). PSAQ standards for accurate MS-based quantification of proteins: from the concept to biomedical applications. J. Mass Spectrom. 47, 1353–1363. doi: 10.1002/jms.3106
Portelius, E., Hansson, S. F., Tran, A. J., Zetterberg, H., Grognet, P., Vanmechelen, E., et al. (2008). Characterization of tau in cerebrospinal fluid using mass spectrometry. J. Proteome Res. 7, 2114–2120. doi: 10.1021/pr7008669 Sergeant, N., Delacourte, A., and Buee, L. (2005). Tau protein as a differential
biomarker of tauopathies. Biochim. Biophys. Acta 1739, 179–197. doi: 10.1016/j.bbadis.2004.06.020
Sjögren, M., Davidsson, P., Gottfries, J., Vanderstichele, H., Edman, A., Vanmechelen, E., et al. (2001). The cerebrospinal fluid levels of tau, growth-associated protein-43 and soluble amyloid precursor protein correlate in Alzheimer’s disease, reflecting a common pathophysiological process. Dement. Geriatr. Cogn. Disord. 12, 257–264. doi: 10.1159/000051268
Smith, L. M., and Kelleher, N. L. (2013). Proteoform: a single term describing protein complexity. Nat. Methods 10, 186–187. doi: 10.1038/nmeth.2369 Wang, G. R., Gao, C., Shi, Q., Zhou, W., Chen, J. M., Dong, C. F., et al.
(2010). Elevated levels of tau protein in cerebrospinal fluid of patients with probable Creutzfeldt-Jakob disease. Am. J. Med. Sci. 340, 291–295. doi: 10.1097/MAJ.0b013e3181e92a1f
Conflict of Interest Statement: The authors declare that the research was conducted in the absence of any commercial or financial relationships that could be construed as a potential conflict of interest.
Copyright © 2015 Bros, Vialaret, Barthelemy, Delatour, Gabelle, Lehmann and Hirtz. This is an open-access article distributed under the terms of the Creative Commons Attribution License (CC BY). The use, distribution or reproduction in other forums is permitted, provided the original author(s) or licensor are credited and that the original publication in this journal is cited, in accordance with accepted academic practice. No use, distribution or reproduction is permitted which does not comply with these terms.