HAL Id: hal-01797971
https://hal.archives-ouvertes.fr/hal-01797971
Submitted on 23 May 2018
HAL is a multi-disciplinary open access archive for the deposit and dissemination of sci-entific research documents, whether they are pub-lished or not. The documents may come from teaching and research institutions in France or abroad, or from public or private research centers.
L’archive ouverte pluridisciplinaire HAL, est destinée au dépôt et à la diffusion de documents scientifiques de niveau recherche, publiés ou non, émanant des établissements d’enseignement et de recherche français ou étrangers, des laboratoires publics ou privés.
Phase Equilibrium of Three Binary Mixtures Containing
NO and Components Present in Ambient Air
Fan Zhang, Elise El Ahmar, Alain Valtz, Eric Boonaert, Christophe Coquelet,
Antonin Chapoy
To cite this version:
Fan Zhang, Elise El Ahmar, Alain Valtz, Eric Boonaert, Christophe Coquelet, et al.. Phase Equilib-rium of Three Binary Mixtures Containing NO and Components Present in Ambient Air. Jour-nal of Chemical and Engineering Data, American Chemical Society, 2018, 63 (4), pp.1021-1026. �10.1021/acs.jced.7b00782�. �hal-01797971�
1
Phase Equilibrium of Three Binary Mixtures Containing NO and
Components Present in Ambient Air.
Fan Zhang †, Elise El Ahmar †*, Alain Valtz†, Eric Boonaert†, Christophe
Coquelet† Antonin Chapoy †, ‡
†MINES ParisTech, PSL - Research University, CTP – Centre of Thermodynamics of Processes, 35 rue Saint Honoré, 77300 Fontainebleau, France
††Hydrates, Flow Assurance & Phase Equilibria, Institute of petroleum engineering, Heriot-Watt University Edinburgh EH14 4AS, Scotland, United Kingdom
2
Abstract
Air contains impurities, which must be removed before its transformation and utilization. In the present work, new isothermal Vapor-Liquid Equilibrium (VLE) data are reported for three binary systems containing NO with (CO, N2 or Ar) at different temperatures (between 105
and 146 K) and pressures up to 4 MPa. The compositions of the coexisting phases were experimentally determined using an apparatus based on the “static-analytic” method. The Peng-Robinson Equation of State combined with different mixing rules (classical, Wong-Sandler and Huron-Vidal) were used to represent the phase diagram (P, x, y).
Keywords: Vapor –Liquid Equilibrium, low temperature, thermodynamic models, measurements, phase
behavior
1. Introduction
Air is indispensable to life and an important resource at the same time. It is approximately a ternary mixture of nitrogen, oxygen, and argon. Nevertheless, it contains variable quantities of many other substances like rare gases, COx, hydrogen, methane, oxides of nitrogen, NOx, and of sulfur, SOx. To illustrate, Table 1 gives an example of an average volumetric distribution of the substances in the air mixture. In Table 1, distinction is made between fixed components and impurities1.
Air contains large amounts of nitrogen and oxygen. Cryogenic distillation of air is the oldest but most highly developed separation technology for the industrial production of oxygen and nitrogen. This technology has not changed fundamentally from that initially developed by Carl von Linde and Claude-Delorme at the beginning of the 20th century. The core of a conventional Air Separation Unit (ASU) is a system of two distillation columns and a reboiler-condenser in between working at about 100 K. The importance of this process depends heavily on its capability in providing extremely pure nitrogen (10 ppb of impurities) and oxygen (purity from 85% up to 99.7%) in both the liquid and vapor states. Cryogenic air separation is based on the principle of fractional distillation. This process involves liquid and vapor phases and air components are separated on the basis of differences in boiling point and of relative volatility. Consequently, the whole process is related to the VLE occurring within the distillation column, thus important information for the plant design are saturation lines of the main air components and the thermodynamics and phase equilibria of mixtures of
3
nitrogen, oxygen, and argon. There are currently few data available in the open literature on the thermodynamic behavior of mixtures composed of fixed components+ impurities as well as mixtures composed of two impurities.
Since 1990’s, the Centre of Thermodynamics of Processes has been involved in the study of the thermodynamic behavior (experimental measurements and thermodynamic calculation) of such mixtures. As examples of results obtained, we can mention the study of phase equilibria of several binary systems, O2-N2,O2-Ar and Ar-N2 (VLE, Baba-Ahmed et al.2, O2-CO2, O2
-N2O (solid solubility in liquid oxygen, De Stefani et al.3), O2-propane (VLLE,
Houssin-Agbomson et al.4) and N2-propane (VLLE, Houssin-Agbomson et al. 5). NO, CO and Ar are
also impurities present with CO2 after the process of CO2 capture. Development of
thermodynamic model to design CO2 transportation process requires binary interaction
parameters (Coquelet et al.6). These parameters are obtained from experimental data. In this work, VLE measurements of three binary mixtures composed of some impurities (Ar-NO, CO-NO and N2-NO,) will be presented at low temperature conditions. The Peng-Robinson
Equation of State, commonly used in industry, is used to model the above systems.
2. Experimental set-up
2.1. Chemicals
Chemicals (nitrogen, argon, carbon monoxide and nitric oxide) were purchased from Air Liquide (France) and presented in Table 2. The chemicals were used without further purification.
2.2. Apparatus description
The set-up is based on the ‘static-analytic’ method, for measurements at temperatures down to the normal nitrogen boiling temperature. The measured properties are: pressure, temperature and vapor and liquid compositions. A Hastelloy C276 cell (43 cm3) is placed inside a cryostat partially filled with liquid nitrogen. If the desired temperature is the normal nitrogen boiling temperature, the cell is completely immersed in liquid nitrogen. Above this temperature, the level of liquid nitrogen is maintained below the bottom of the cell. In this way, liquid nitrogen acts as the cold reservoir while a rounded heating resistance connected to a PID thermal regulator is used to achieve temperature stability within 0.1 K. Two capillary samplers Rapid On-Line Sampler-Injector (ROLSI®) 7 are fixed on the top of the cell, one for the liquid phase and one for the vapor phase, and allowing direct injection of samples into the carrier gas
4
circuit of a gas chromatograph. Efficient stirring of mixtures inside the cell is achieved using a magnetic rod driven by an external rotating magnetic field. Its rotation speed is selected through a variable speed motor.
A detail description of the setup can be found in Baba-Ahmed et al.2 and Houssin-Agbomson et al.4.
2.3. Calibrations and uncertainty estimation
Calibration of pressure transducer is performed against a dead weight pressure balance (Desgranges & Huot 5202S, CP 0.3–40 MPa, Aubervilliers, France). Accuracies are estimated to be within 0.005 MPa. The two platinum resistance thermometer probes (100 Ω) are calibrated by measuring the oxygen vapor pressure at low temperatures and comparing this value to the one found in the open literature. These probes are coupled to a Hewlett Packard multi-meter. Accuracies are estimated to be within 0.1 K for both probes. The signals from the probes (temperatures and pressures) are transmitted to a data acquisition system (DAS) which is connected to a PC. The thermal conductivity detector (TCD) of a Perichrom gas chromatograph (PR-2100) is calibrated using known amounts of compounds introduced through syringes. The column used for this analytical work is a packed column molecular sieve 5A (60/80) (Restek, France).
To estimate the uncertainties in temperature, pressure and composition, we have followed the guidelines of NIST 8. The uncertainty estimation procedure is fully described by Zhang et al.9. Both measurements repeatability and calibration uncertainties are taken into account. All the expanded uncertainties U(x), U(y) with coverage factor, k=2) for experimental data are reported in section 4.
2.4. Experimental procedure
At room temperature, the equilibrium cell and its loading lines are vacuumed. The cell is first loaded with the component having the lowest vapor pressure (NO in our study). The temperature is then set to the desired point and the system is left to reach thermodynamic equilibrium. After recording the vapor pressure of this component, the second component is introduced step by step, leading to successive equilibrium mixtures of increasing overall compositions. The two-phase (liquid and vapor) envelopes are measured with about 6 to 10 liquid and vapor points. Phase equilibrium is assumed to be achieved while temperature and pressure readings stabilized for at least 30 min. For each equilibrium condition, several samples of each phase (vapor and liquid) are withdrawn using the capillary samplers ROLSI®
5
and analyzed in order to determine the mole fraction of each phase and check for repeatability of measurements which must be closed or better than ± 1 %.
3. Modelling
For binary mixtures modelling, the critical parameters (temperature (TC) and pressure (PC)),
and acentric factor () for each of the pure components are provided in Table 310. The experimental VLE data were correlated using the Peng-Robinson cubic Equation of State (PR EoS) 11 with different mixing rules. These models were chosen in order to produce reliable correlation of the experimental data with reasonable accuracy comparable with experimental uncertainties and to represent at the best the both phases. - PR EoS incorporating the the Mathias-Copeman alpha function12, combined with the classical mixing rules13 (PR-EoS) as implemented in in-house software developed at CTP. - PR EoS incorporating the Mathias-Copeman alpha function, with the Wong-Sandler mixing rules14 involving NRTL activity coefficient model15 (PR-WS-NRTL EoS) (with non-randomness parameter =0.3).
- PR EoS incorporating the Mathias-Copeman alpha function, with the Huron-Vidal mixing rules16 with a Wilson activity coefficient model17 (PR-HV-Wilson EoS)
The Mathias-Copeman alpha function coefficients for all components are listed in Table 310. Binary Interaction Parameters (BIP, kij) were determined directly from the VLE data by minimizing the following objective function (eq.1):
2 exp exp 100 P P P N OF cal (eq.1)Where P corresponds to bubble pressure, exp corresponds to experimental and cal corresponds
to calculated.
4. Results and discussion
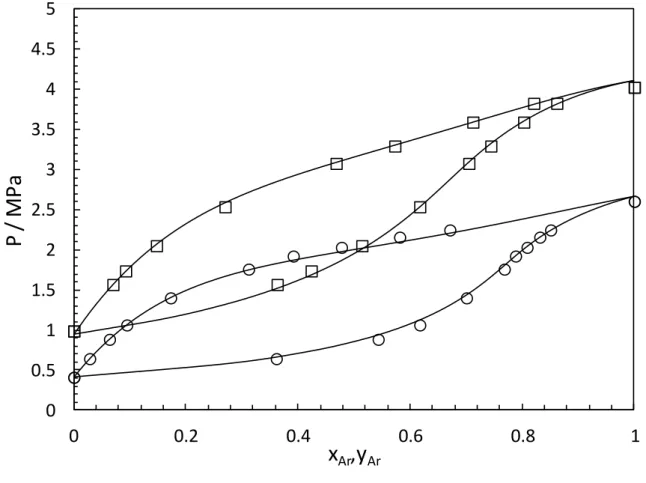
4.1 VLE data for Ar-NOsystem
The experimental VLE data were determined at 135.80 and 146.22 K (see Table 4) and are plotted in Figure 1. The PR-EoS using the classical mixing rules is used to represent the phase diagram (P,x,y). The adjusted BIP (kij) with and without a temperature dependency are
6
In order to quantify the fit of the models to the experimental data, the average absolute deviation (AADU) is calculated for the pressure and the vapor phase mole fractions. The deviation is defined by:
100/N Uexp U /Uexp
AADU cal (eq.2)
Where N is the number of data points, cal corresponds to calculated value, exp corresponds
experimental value and U = P1 or y1.
These indicators, which give information about the agreement between model and experimental results, are presented in Table 5. Regarding these indicators, taking into account a temperature dependent BIP does not improve significantly the calculated data obtained. In Figure 1, kij values used for our calculations with the PR are those obtained with a
temperature dependency. PR The AADU is less than 2.3%.
Figure 1. Phase diagrams (P-x-y) for Ar (1) - NO (2) mixture (symbols: this work, □: 146.42 K, ○: 135.80 K,
Black lines: PR-EoS with a temperature dependent BIP).
0 0.5 1 1.5 2 2.5 3 3.5 4 4.5 5 0 0.2 0.4 0.6 0.8 1
P
/
M
P
a
x
Ar,y
Ar7
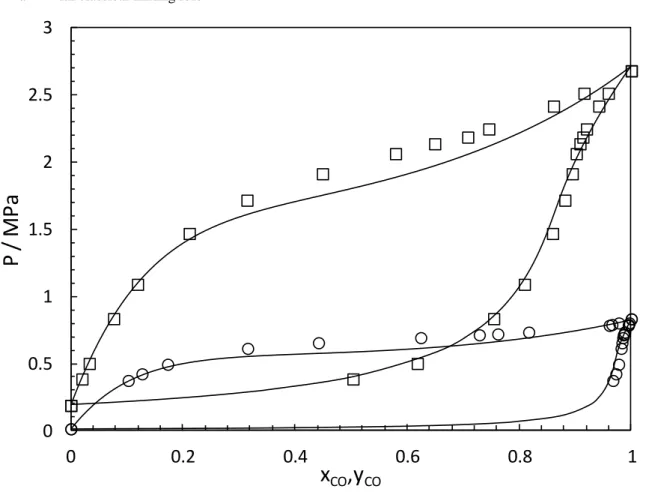
4.2 VLE data for CO-NO system
Table 6 and Figure 2 present the VLE data obtained at 105.89 and 127.32 K. A temperature dependent BIP to represent the experimental data was considered. (Table 7). At higher temperature the PR-EoS with the classical mixing rules have some difficulties representing the liquid composition (see Figure 2.a). In order to display a decent match with the experimental data (particularly for the liquid phase), the PR-WS-NRTL EoS (with non-randomness parameter =0.3) was used. This model has 3 BIPs which give more flexibility to represent correctly the phase diagram of the system. With this mixing rule, the PR-EoS handles the representation of both phases (liquid and vapor) reasonably well. The AADU is less than 1.4%.
Figure 2. Phase diagrams (P-x-y) for CO (1) - NO (2) mixture (symbols: this work, □: 127.32 K, ○: 105.89 K,
Black lines: PR-EoS with a temperature dependent BIP. a- With classical mixing rule
0 0.5 1 1.5 2 2.5 3 0 0.2 0.4 0.6 0.8 1
P
/
M
P
a
x
CO,y
CO8 b-With Wong-Sandler mixing rule and NRTL activity coefficient model
0 0.5 1 1.5 2 2.5 3 0 0.2 0.4 0.6 0.8 1
P
/
M
P
a
x
CO,y
CO9
4.3 VLE data for N2-NOsystem
This system has been studied by Scheunemann et al., (1985)18 at 113.85 and 119.55 K. Our new experimental data were measured at 105.69 and 127.14 K (see Table 8). Table 9 presents the BIP obtained at each temperature. For this system, the PR-EoS with classical mixing rule have some difficulties in representing the liquid composition, particularly for N2 rich mixtures
(Figure 3.a). A vapor-liquid-liquid-equilibrium is predicted when using the PR-WS-NRTL EoS, for the lowest temperature (Figure 3.b). To overcome this problem, the PR-HV-Wilson EoS was used. The Wilson activity coefficient model is well known not to predict liquid-liquid equilibria. The PR HV-Wilson EoS model handles the representation of both phases (liquid and vapor) reasonably well (Figure 3.c). The BIP values except at 119.55 K are an increasing function of the temperature and follow a linear behavior (Figure 4).
0 0.5 1 1.5 2 2.5 3 0 0.2 0.4 0.6 0.8 1
P
/
M
P
a
x
CO,y
CO10
Figure 3. Phase diagrams (P-x-y) for N2 (1) - NO (2) mixture (symbols: experimental work, □: data measured in
this work at 127.14 K, ○: data measured in this work at 105.69 K, ×: Data from Scheunemann and Wagner measured at 119.55K18, +: Data from Scheunemann and Wagner measured at 113.85K18, Black lines: PR-EoS with a temperature dependent BIP).
a-With classical mixing rule
0 0.5 1 1.5 2 2.5 3 3.5 0 0.2 0.4 0.6 0.8 1
P
/
M
P
a
x
N2,y
N211 b-With Wong-Sandler mixing rule and NRTL activity coefficient model
0 0.5 1 1.5 2 2.5 3 3.5 0 0.2 0.4 0.6 0.8 1
P
/
M
P
a
x
N2,y
N212 c-With Huron-Vidal mixing rule and Wilson activity coefficient model
0 0.5 1 1.5 2 2.5 3 3.5 0 0.2 0.4 0.6 0.8 1
P
/
M
P
a
x
N2,y
N213
Figure 4. BIP’s values with PR-WS-Wilson EoS as function of temperature. (symbols: ○: 12 , □: 21) for N2
(1) - NO (2) mixture. 0 0.05 0.1 0.15 0.2 0.25 0.3 0.35 100 105 110 115 120 125 130
B
IP
's
va
lu
e
s
T(K)
5. ConclusionsPhase equilibrium of binary mixtures NO with (CO, N2 or Ar) for cryogenic air separation in
this paper. New experimental VLE data for these three binary systems are presented at different temperatures. Experimental data for these systems have not been previously reported in the open literature at the studied temperature. The experimental setup using a ‘static-analytic’ method is described and the uncertainties concerning the calibrations of pressure, temperature and gas chromatography detector are also given. The measured data were correlated using the PR-EoS with different mixing rules (classical, Wong-Sandler and Huron-Vidal) in function of the system studied. The new experimental data obtained in this work were used to adjust the binary interaction parameters and the chosen models seems to be adequate to fit these types of component and mixtures at these temperature conditions. As future work, we will be focusing on the improvement of PR-EoS in order to represent the thermodynamic behavior of air components.
14
Acknowledgments
This work was funded by Chevron, Linde, GALP, OMV, PETEX, Statoil, TOTAL and UK National Grid, whose support is gratefully acknowledged.
15
List of figures
Figure 1. Phase diagrams (P-x-y) for Ar (1) - NO (2) mixture (symbols: this work, □: 146.42
K, ○: 135.80 K, Black lines: PR-EoS with a temperature dependent BIP).
Figure 2. Phase diagrams (P-x-y) for CO (1) - NO (2) mixture (symbols: this work, □: 127.32
K, ○: 105.89 K, Black lines: PR-EoS with a temperature dependent BIP).
Figure 3. Phase diagrams (P-x-y) for N2 (1) - NO (2) mixture (symbols: experimental work, □: data measured in this work at 127.14 K, ○: data measured in this work at 105.69 K, ×: Data from Scheunemann and Wagner measured at 119.55K18, +: Data from Scheunemann and Wagner measured at 113.85K18, Black lines: PR- EoS with a temperature dependent BIP).
Figure 4. BIP’s values with PR-WS-Wilson EoS as function of temperature. (symbols:
experimental work, ○: 12 , □: 21) for N2 (1) - NO (2) mixture.
List of tables
Table 1: Example of Air composition from Arpentinier et al.1.
Table 2: Details of the chemicals.
Table 3. Critical parameters, acentric factor and Mathias-Copeman Coefficients for the PR10.
Table 4. Vapor–liquid equilibrium pressures and phase compositions for Ar (1) - NO (2)
mixture (composition: y for Vapor phase and x for liquid phase, n: samples number).
Table 5. BIP values and deviations obtained in fitting experimental VLE data with PR-EoS
(bubble pressure calculation) for Ar (1) - NO (2) mixture.
Table 6. Vapor–liquid equilibrium pressures and phase compositions for CO (1) - NO (2)
mixture (composition: y for Vapor phase and x for liquid phase, n: samples number).
Table 7. BIP values and deviations obtained in fitting experimental VLE data with PR-EoS
(bubble pressure calculation), PR-WS-NRTL EoS (with non-randomness parameter =0.3) and PR-HV-Wilson EoS for CO(1) - NO (2) mixture.
Table 8. Vapor–liquid equilibrium pressures and phase compositions for N2 (1) - NO (2)
mixture (composition: y for Vapor phase and x for liquid phase, n: samples number).
Table 9. BIP values and deviations obtained in fitting experimental VLE data with PR-EoS
(bubble pressure calculation), PR-WS-NRTL EoS (with non-randomness parameter =0.3) and PR-HV-Wilson EoS for N2 (1) - NO (2) mixture.
16
Table 1: Example of Air composition from Arpentinier et al. 1.
Component Volumetric composition
Fixed components N2 78.084 ± 0.004% O2 20.964 ± 0.002% Ar 0.934 ± 0.001% CO2 0.033 ± 0.003% Ne 1.8 ± 0.04 ppm He 5.2 ± 0.05 ppm Kr 1.14 ± 0.01 ppm Xe 0.086 ± 0.001 ppm H2 0.05 ppm
Impurities (In ambient air, including dust, pollen and local pollutants.) H2O 0.1–2.8% CH4 1–6 ppm CO 0.06–1 ppm SOx 0.1–1.0% NOx 0.52 ppm O3 0.01–1 ppm Rn 6 × 10⁻³ ppq
17
Table 2: Details of the chemicals.
Chemical Symbol CAS number Purity/volume% (by weighing)
Argon Ar 7440-37-1 99.999
Nitrogen N2 7727-37-9 99.995
Carbon dioxide CO 630-8-0 99.995
18
Table 3. Critical parameters, acentric factors and Mathias-Copeman Coefficients for the PR-EoS10.
Chemical Tc/K Pc/MPa MC1 MC2 MC3
Ar 150.86 4.8980 0 0.397483 -0.282393 0.796288 N2 126.20 3.4000 0.0377 0.448322 -0.156813 0.468652
CO 132.92 3.4990 0.0481 0.451344 -0.0791691 0.464029 NO 180.15 6.4800 0.5829 1.153810 0.243750 -0.043201
19
Table 4. Vapor–liquid equilibrium pressures and phase compositions for Ar (1) - NO (2) mixture (composition:
y for vapor phase and x for liquid phase, n: samples number). U(T)= 0.1 K, U(P)=0.005 MPa.
T/K = 135.80 P/MPa y1 x1 U (y1) U(x1) ny1 ; nx1 0.4109 0 0 0.6432 0.3613 0.0282 2E-04 1E-04 4;6 0.8844 0.5431 0.0636 2E-04 1E-04 6;5 1.0634 0.6173 0.0944 3E-04 1E-04 5;7 1.4012 0.7006 0.173 2E-04 2E-03 6;7 1.7597 0.768 0.312 1E-03 1E-04 6;8 1.9230 0.788 0.392 1E-03 4E-03 4;4 2.0315 0.809 0.478 1E-03 4E-04 6;6 2.1587 0.831 0.581 1E-03 5E-04 5;4 2.2484 0.851 0.671 1E-03 2E-04 6;6 2.6056 1 1 T/K = 146.22 0.9878 0 0 1.5678 0.36283 0.0698 3E-05 9E-04 6;4 1.7377 0.4235 0.0924 1E-04 2E-03 6;5 2.0521 0.51394 0.1475 7E-05 1E-03 7;5 2.5374 0.61724 0.2698 4E-05 3E-03 6;7 3.0786 0.70481 0.4680 3E-05 4E-03 6;6 3.2953 0.74408 0.5728 2E-05 3E-03 4;5 3.5934 0.8028 0.7120 1E-04 1E-03 6;5 3.8280 0.8617 0.8206 1E-04 2E-03 5;4 4.0289 1 1
20
Table 5. BIP values and deviations obtained in fitting experimental VLE data with PR-EoS (bubble pressure
calculation) for Ar (1) - NO (2) mixture.
PR-EoS with classical mixing rules
T/ K kij AAD P (%) AAD y1 (%)
135.80 0.1144 1.68 2.20
146.22 0.1247 1.05 1.74
21
Table 6. Vapor–liquid equilibrium pressures and phase compositions for CO (1) - NO (2) mixture (composition:
y for vapor phase and x for liquid phase, n: samples number). U(T)= 0.1 K, U(P)=0.005 MPa.
T/K = 105.89
P/MPa y1 x1 U(y1) U(x1) ny1 ; nx1
0.0136 0 0 0.7847 0.99460 0.9607 4E-05 1E-04 4;4 0.8026 0.99632 0.9776 4E-05 2E-04 4;5 0.7905 0.99508 0.9653 2E-05 3E-04 4;4 0.3739 0.9671 0.10236 7E-04 6E-05 4;5 0.4236 0.97249 0.1270 1E-05 5E-04 4;5 0.4947 0.97742 0.1727 3E-05 9E-04 4;6 0.6552 0.98341 0.442 7E-05 1E-03 5;5 0.6930 0.98489 0.624 4E-05 3E-03 4;5 0.7141 0.98588 0.729 3E-05 4E-03 4;5 0.7200 0.98707 0.762 2E-05 3E-03 3;5 0.7300 0.9881 0.817 1E-04 1E-03 4;5 0.8300 1 1 T/K = 127.32 0.1883 0 0 0.3852 0.5034 0.0198 5E-04 4E-04 5;4 0.5011 0.618 0.0329 1E-03 2E-04 4;6 0.8348 0.754 0.0763 2E-03 5E-04 6;5 1.0907 0.8092 0.1190 7E-04 2E-04 4;5 1.4696 0.85953 0.211 3E-05 1E-03 4;5 1.7178 0.8815 0.314 2E-04 1E-03 5;5 1.9145 0.8946 0.449 3E-04 1E-03 5;9 2.0645 0.9018 0.5794 2E-04 2E-04 4;4 2.1381 0.9084 0.6493 2E-04 2E-04 4;4 2.1879 0.9137 0.7082 5E-04 2E-04 4;4 2.2484 0.92010 0.74575 7E-05 9E-05 4;5 2.4190 0.9421 0.86122 2E-04 4E-05 4;5 2.5146 0.9590 0.9157 3E-04 5E-04 4;8 2.6820 1 1
22
Table 7. BIP values and deviations obtained in fitting experimental VLE data with PR-EoS (bubble pressure
calculation), PR-WS-NRTL EoS (with non-randomness parameter =0.3) and PR-HV-Wilson EoS for CO (1) - NO (2) mixture.
PR-EoS with classical mixing rule PR-WS-NRTL EoS
T/ K kij AAD P (%) AAD y1(%) kij 12 / J.mol-1 21 / J.mol-1 AAD P (%) AAD y1 (%)
105.89 -0.0081 4.89 0.49 -0.34795 3178.80 1235.00 1.60 0.53
127.32 0.0374 4.52 0.93 0.24814 61.69 1304.80 1.35 0.73
PR-HV-Wilson EoS
T/ K 12 21 AAD P (%) AAD y1(%)
105.89 0.30286 0.14462 1.0 0.32
23
Table 8. Vapor–liquid equilibrium pressures and phase compositions for N2 (1) - NO (2) mixture (composition:
y for vapor phase and x for liquid phase, n: samples number). U(T)= 0.1 K, U(P)=0.005 MPa.
T/K = 105.69
P/MPa y1 x1 U(y1) U(x1) ny1 ; nx1
0.3008 0.9713 0.0328 3E-04 4E-04 5;4 0.3558 0.9751 3E-04 4 0.4653 0.9794 2E-04 5 0.5379 0.9828 0.0774 2E-04 8E-04 4;5 0.6207 0.9845 0.0912 2E-04 9E-04 5;5 0.7078 0.9893 0.105 1E-04 1E-03 3;4 0.8226 0.99222 0.147 9E-05 1E-03 4;4 0.8555 0.99244 0.159 9E-05 2E-03 4;5 0.8922 0.99410 0.180 7E-05 2E-03 3;4 0.9474 0.99447 0.225 6E-05 2E-03 3;5 0.9791 0.99304 0.259 8E-05 2E-03 3;4 T/K = 127.14 0.5568 0.667 0.0236 3E-03 3E-04 5;6 0.8751 0.783 0.0474 2E-03 5E-04 5;6 1.1304 0.829 0.0695 2E-03 7E-04 5;9 1.4500 0.862 0.104 1E-03 1E-03 5;6 1.7464 0.879 0.141 1E-03 1E-03 5;5 1.9861 0.891 0.184 1E-03 2E-03 5;5 2.3211 0.906 0.282 1E-03 2E-03 6;5 2.5660 0.9130 0.450 9E-04 3E-03 5;7 2.6573 0.9151 0.561 9E-04 3E-03 3;5 2.7213 0.9185 0.632 8E-04 3E-03 4;9 2.7482 0.9206 0.644 8E-04 3E-03 3;4 2.7944 0.9221 0.703 8E-04 2E-03 3;5
24
Table 9. BIP values and deviations obtained in fitting experimental VLE data with PR-EoS (bubble pressure
calculation), PR-WS-NRTL EoS (with non-randomness parameter =0.3) and PR-HV-Wilson EoS for N2 (1) -
NO (2) mixture.
PR-EoS with classical mixing rule PR-WS-NRTL EoS
T/ K kij AAD P (%) AAD y1(%) kij 12 / J.mol-1 21 / J.mol-1 AAD P (%) AAD y1 (%)
105.69 -0.0004 8.02 1.31 0.0803 974.50 1244.80 1.67 1.01
113.83 0.0241 6.81 0.63 0.2368 403.22 1307.00 1.77 0.08
119.56 0.0307 7.25 0.90 0.2198 644.32 1034.50 1.75 0.09
127.14 0.0430 5.52 2.74 0.2780 -138.28 1843.70 0.29 0.78
PR-HV-Wilson EoS
T/ K 12 21 AAD P (%) AAD y1(%)
105.69 0.2233 0.0186 3.30 1.14
113.83 0.2413 0.0598 1.69 0.58
119.56 0.3051 0.0619 3.07 1.08
25
6. References
(1) Arpentinier, P., Cavani F., Trifirò, F. The technology of catalytic oxidations, Paris: Editions Technip, 2001.
(2) Baba-Ahmed A., Guilbot P., Richon, D. New equipment using a static analytic method for the study of vapour–liquid equilibria at temperatures down to 77 K, Fluid Phase Equilib. 1999, 166, 225–236.
(3) De Stefani, V., Baba-Ahmed, A., Valtz, A., Meneses, D., Richon, D. Solubility measurements for carbon dioxide and nitrous oxide in liquid oxygen at temperatures down to 90 K. Fluid Phase Equilib. 2002, 200, 19–30.
(4) Houssin-Agbomson, D., Coquelet, C., Richon, D., Arpentinier, P. Equipment using a “static-analytic” method for solubility measurements in potentially hazardous binary mixtures under cryogenic temperatures, Cryogenics 2010, 50, 248–256.
(5) Houssin-Agbomson, D., Coquelet, C., Arpentinier, P., Delcorso, F., Richon. D. Equilibrium data for the oxygen + propane binary system at temperatures of (110.22, 120.13, 130.58 and 139.95) K. J. Chem. Eng. Data 2010, 55, 4412–4415.
(6) Coquelet, C., Stringari, P., Hajiw, M., Gonzalez, A., Pereira, L., Nazeri, M., Burgass, R., Chapoy, A. Transport of CO2: Presentation of New Thermophysical Property Measurements
and Phase Diagrams, Energy Procedia 2017, 114, 6844–6859.
(7) French patent deposed by Armines 2003, Procédé et dispositif pour prélever des micro-échantillons d’un fluide sous pression contenu dans un container.
(8) Taylor, B.N., Kuyatt, C.E. Guidelines for evaluating and expressing the uncertainty of NIST measurement results, National Institute of Standards and Technology, Gaithersburg, MD, 1994
(9) Zhang, F., Théveneau, P., El Ahmar, E., Canet, X., Soo, C.-B., Coquelet, C. An improved static–analytic apparatus for vapor–liquid equilibrium (PTxy) measurement using modified in-situ samplers, Fluid Phase Equilib. 2016, 409, 425–433.
(10) Component plus software, version, 3.0.0.0, Prosim SA, France, 1999.
(11) Peng, D.Y., Robinson, D.B. A new two constant equation of state. Ind. Eng. Chem. Fundam. 1976, 15, 59–64.
(12) Mathias, P. M., Copeman, T. W. Extension of the Peng-Robinson Equation of State to Complex Mixtures: Evaluation of Various Forms of the Local Composition Concept. Fluid Phase Equilib. 1983, 13, 91–108.
(13) Van Der Waals, J. D. On the continuity of the gaseous and liquid state. Ph.D. Thesis, Leiden University, Leiden, The Netherlands, 1873.
(14) Wong, D. S. H., Sandler, S. I. A Theoretically Correct Mixing Rules for Cubic Equations of State. AIChE J. 1992, 38, 671–680.
(15) Renon, H., Prausnitz, J. M. Local Composition in Thermodynamic Excess Function for Liquid Mixtures. AIChE J. 1968, 14,135–144.
(16) Huron, M. J., Vidal, J. New Mixing Rules in Simple Equations of State for Representing Vapor-Liquid Equilibria of Strongly non-ideal Mixtures, Fluid Phase Equilib. 1979, 3, 255–
271.
(17) Wilson, G. M. Vapor-Liquid Equilibrium. XI. A New Expression for the Excess Free Energy of Mixing, J. Am. Chem. Soc. 1964, 127–130.
(18) Scheunemann, U., Wagner, H. G. Eine Apparatur zur Bestimmung von Tieftemperatur-Flüssigkeits-Dampf-Gleichgewichten und Messungen im System N2-NO, Berichte der
26 For Table of Contents Only:
0 0.5 1 1.5 2 2.5 3 3.5 0 0.2 0.4 0.6 0.8 1 P / M P a xN2,yN2