DOI 10.1007/s00221-013-3423-6
RESEARCH ARTICLE
Eye position dependency of nystagmus during constant vestibular
stimulation
Christopher J. Bockisch · Elham Khojasteh · Dominik Straumann · Stefan C. A. Hegemann
Received: 8 November 2012 / Accepted: 15 January 2013 / Published online: 6 February 2013 © Springer-Verlag Berlin Heidelberg 2013
average velocity of 31°/s was unchanged over the final 35 s of the acceleration period. In all 10 healthy human subjects, we found a large and stable Alexander’s law, with an aver-age velocity-versus-position slope of −0.366 in the first half that was not significantly different in the second half, −0.347. These slopes correspond to integrator time con-stants of <3 s, are much less than normal time concon-stants (~25 s), and are similar to those observed in patients with peripheral vestibular lesions. Alexander’s law also devel-oped, on average, in 10 s. We conclude that Alexander’s law is not simply a consequence of non-reciprocal vestibular stimulation.
Keywords VOR · Nystagmus · Vestibular · Adaptation ·
Alexander’s law
Introduction
Spontaneous nystagmus in patients with vestibular lesions often has a dependency on eye position, first described in 1912 (Alexander 1912) and called Alexander’s law, where the slow-phase velocity is highest with gaze in the fast-phase direction. Modern measurements have further quantified Alexander’s law in patients (Hegemann et al. 2007; Bockisch and Hegemann 2008), and caloric stimulation has been used to simulate peripheral vestibular disorders in healthy subjects and evoke similar patterns of eye position dependency as have been described in patients (Doslak et al. 1982; Robinson et al. 1984; Jeffcoat et al. 2008; Bockisch et al. 2012).
Hess (1982), and shortly thereafter Robinson et al. (1984), proposed that Alexander’s law arose from changes in the brainstem/cerebellar velocity-to-position neural integra-tor, such that the integrator produces a smaller-than-normal command to compensate for elastic forces produced by
Abstract Alexander’s law, the eye position dependency
of nystagmus due to peripheral vestibular lesions, has been hypothesized to occur due to adaptive changes in the brainstem velocity-to-position neural integrator in response to non-reciprocal vestibular stimulation. We investigated whether it develops during passive head rotations that pro-duce constant nystagmus for >35 s. The yaw rotation stimu-lus consisted of a 1-s acceleration (100°/s2), followed by a lower acceleration ramp (starting at 7.3°/s2 and increas-ing at 0.04°/s2/s) until 400°/s was reached after 38 s. This stimulus was designed to offset the ~15 s vestibular ocular reflex time constant (and the 150 s adaptation time constant) and produce constant velocity slow phases. In contrast to peripheral lesions, this vestibular stimulation is the result of real head turns and has the push–pull characteristics of natural movements. The procedure was successful, as the
Electronic supplementary material The online version of this article (doi:10.1007/s00221-013-3423-6) contains supplementary material, which is available to authorized users.
C. J. Bockisch (*) · D. Straumann
Department of Neurology, University Hospital Zürich, Frauenklinikstrasse 26, 8091 Zurich, Switzerland e-mail: [email protected]
C. J. Bockisch
Department of Ophthalmology, University Hospital Zürich, Zurich, Switzerland
C. J. Bockisch · E. Khojasteh · S. C. A. Hegemann
Department of Otorhinolaryngology, Head and Neck Surgery, University Hospital Zürich, Zurich, Switzerland
C. J. Bockisch · D. Straumann · S. C. A. Hegemann Zürich Centre for Integrative Human Physiology (ZIHP), University Hospital Zürich, University of Zürich, Zurich, Switzerland
the extraocular tissues that pull the eye back to a central position. This would then result in centripetal drift of the eyes, which when added to the constant velocity signal from the vestibular system produces the eye position dependency of velocity.
The oculomotor velocity-to-position neural integra-tor has been localized to the brainstem [nucleus preposi-tus hypoglossi (Cannon and Robinson 1987; Cheron and Godaux 1987) and medial vestibular nucleus (McFarland and Fuchs 1992; McConville et al. 1994) for horizontal eye position, and the interstitial nucleus of Cajal for vertical and torsional position (King et al. 1981; Crawford et al. 1991; Crawford and Vilis 1993; Crawford 1994; Helmchen et al. 1998; Farshadmanesh et al. 2007)] and cerebellum (Takemori and Cohen 1974; Zee et al. 1981; Waespe et al. 1983). Typically, the brainstem is modeled as a positive position feedback system that increases the neural inte-grator time constant to around 12 s, and the cerebellum is modeled as a negative velocity feedback system that further increases the time constant to ~25 s (Optican and Zee 1984; Glasauer 2006).
Robinson et al. (1984) suggested that the process pro-ducing Alexander’s law is an adaptive response to the ves-tibular lesion. Centripetal drift caused by a leaky integrator, when added to the constant velocity drift produced by the vestibular lesion, will reduce eye velocity in the direction of the slow phase, thus aiding vision for some gaze directions. Robinson et al. (1984) also performed several experiments to support the adaptation hypothesis. First, they reported that Alexander’s law is not seen during 0.5-Hz sinusoidal head oscillations in normal humans, concluding it is not due to the normal vestibular ocular reflex (VOR). Second, they reported during caloric stimulation the emergence of Alexander’s law is delayed by about 25 s relative to the onset of nystagmus, thus giving it the appearance of an adaptive response to non-reciprocal (unilateral) vestibular stimulation (which Robinson et al. called ‘unnatural’). Uni-lateral caloric stimulation, as well as peripheral vestibular lesions, produces non-reciprocal stimulation in the sense that vestibular input from one side is not accompanied by the opposite change from the other side. Finally, during low constant head acceleration on a turntable (2.1°/s2 after a velocity step of 30°/s), Alexander’s law was found but was reported to be weak and constant during the 60 s of stimulation. They interpreted this as meaning that a natural head rotation signal does not evoke Alexander’s law; rather, a non-reciprocal pattern of stimulation (unilateral caloric or peripheral lesions) is necessary to provoke the adaptive mechanism.
We recently observed Alexander’s law with bilateral bithermal stimulation (cold on one side, warm on the other) (Bockisch et al. 2012), which preserves the normal push– pull pattern of stimulation from real head movements,
which suggests Robinson et al.’s (1984) hypothesis should be re-evaluated. Peripheral vestibular disorders and caloric stimulation contain frequencies that are much lower than those produced by natural head movements and could help explain why Alexander’s law has not been observed with higher-frequency head rotations (Robinson et al. 1984; Anagnostou et al. 2011). We therefore sought a stronger test of Robinson et al.’s (1984) hypothesis that only non-reciprocal patterns of stimulation produce Alexander’s law. We chose a variant of their constant stimulation experi-ment, but did so with a paradigm that produces higher lev-els of nystagmus (simply by using higher velocities and accelerations), because our work in patients found that the strength of Alexander’s law increased with higher levels of slow-phase velocity (Hegemann et al. 2007; Bockisch and Hegemann 2008), thus opening the possibility that Alexander’s law was low in Robinson et al.’s (1984) con-stant stimulation experiments because the stimulus was too weak.
Methods
Subjects and equipment
Ten subjects with no reported visual or vestibular problems were studied. The experiments conformed to the princi-ples of the Declaration of Helsinki and were approved by the local ethics committee. Subjects gave informed, writ-ten consent after the experimental procedure had been explained.
Subjects sat on a rotatable chair controlled with three motor-driven axes (Acutronic, Jona, Switzerland). Only the earth-vertical axis was used in these experiments. Subjects were secured in the chair with safety belts, and the head was fixed to the chair with individually adjusted masks (Sinmed BV, Reeuwijk, the Netherlands). The mask, made of a ther-moplastic material (Posicast), was molded to the contour of the head. The center of the head was positioned in or near the chair rotation axis.
Search coils, produced by Skalar (Delft, the Netherlands) or Universal Trading Ventures, Inc (Cleveland, USA), were used to record the three-dimensional movements of both eyes. Orthogonal magnetic fields with frequencies of 80, 96, and 120 Hz were produced by a head-fixed coil frame (0.5 m3). A fast Fourier transform was computed in real time by a digital signal processor to determine the voltage induced by each magnetic field (Primelec, Regensdorf, Switzerland). Eye position signals were digitized with 12-bit accuracy and sampled at 1,000 Hz using National Instruments (Austin, Texas) hardware and Labview software. Data were analyzed off-line with MatLab software (The MathWorks, Boston, MA). Coils were calibrated in vivo by having subjects fixate
targets from 0° to ±25°, horizontally and vertically, in 5° increments.
A laser spot (~0.25° diameter) controlled by two mirror galvanometers was projected onto a chair-fixed screen posi-tioned 80 cm in front of the subject for visual targets.
We first collected data for control trials to measure hori-zontal gaze evoked nystagmus. In darkness, subjects looked at a pulsed target that moved every 2 s from 20° right to straight ahead, and 20° left, for 1 min. We will refer to each consecutive period of right, center, and left fixations as a fix-ation sequence. The laser was pulsed (20 ms every second) so that we could direct the subject’s gaze direction without visually suppressing nystagmus. Subjects were instructed to look in the direction where they last saw the flashed target and to attempt to keep looking in that direction until they saw a flashed target in a different position.
The goal of the acceleration trials was to produce a vestibular stimulus that would create a constant rotational velocity signal for a long period. The stimulus consisted of an initial velocity step, followed by a period of accel-eration that increased slowly with time. We used estimated properties of the vestibular system (yaw time constant of 15 s and adaptation time constant of 150 s) to determine the required rotation profile to produce a constant veloc-ity signal of 100°/s. (The existence of the adaptation time constant has been determined from studies of long-lasting vestibular stimulation (Leigh et al. 1981; Boumans et al. 1983; Furman et al. 1989). A plausible explanation of such a mechanism is to null small tonic imbalances between the left- and right-side canals.) The stimulus consisted of a 1-s acceleration ramp from 100°/s2 to 107°/s2, followed by a lower acceleration ramp starting at 7.3°/s2 and increasing at 0.04°/s2/s (Fig. 1). We approximated the initial accel-eration period by a 1-s period of constant accelaccel-eration of 100°/s2, and thereafter, the acceleration stepped to 7.3°/s2 and increased once a second by 0.04°/s2 (in other words, we approximated the continuous function by changing the acceleration once per second). The acceleration con-tinued until the velocity reached 400°/s. After a delay to allow nystagmus to decline, we used the same accelera-tion sequence, but in the opposite direcaccelera-tion to change the rotation speed from 400°/s to −400°/s. Figure 1a, b shows the acceleration and velocity profiles. Figure 1c shows the expected response from a system consisting of dominant time constants of 10, 15, or 20 s, an adaptation time con-stant of 150 s, and a gain of 0.5. The initial period of a nearly constant response lasts approximately 38 s. When the acceleration stops, the vestibular response decays and reverses direction due to the adaptation component. During the experiment we monitored eye velocity and did not start the second acceleration period until nystagmus appeared to stop (typically about 4 min). The second acceleration period, during the change from 400°/s to −400°/s, lasted
about 78 s. Finally, the chair decelerated to zero using the same profile as the initial acceleration.
The initial rotation direction was to the right in half the subjects and to the left in the other half.
Analysis
Data were first filtered with a zero-phase distortion 200-Hz butterworth lowpass filter (butter.m and filtfilt.m, Math-works). Only horizontal position and velocity were ana-lyzed, and positive rotations are to the left. Since the results for the left and right eyes were similar, we only report the results of the movements of the right eye. Saccades were identified and removed with an interactive computer pro-gram that automatically detected saccades when velocity exceeded a threshold (typically 20–30°/s, depending upon the noise level) above the median eye velocity calculated over a 1-s window. The automatically marked saccades could be manually adjusted and blink artifacts removed. To ensure that saccadic components were not included in the slow phases, in particular the initial portion which can be
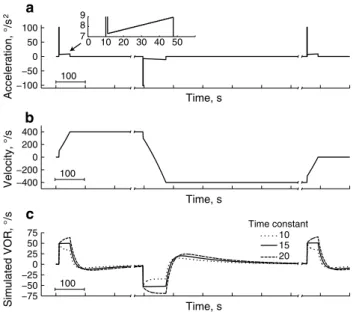
−100 −50 0 50 100 Acceleration, °/s 2 Time, s −400 −200 0 200 400 Velocity, °/s −75 −50 −250 25 50 75 Simulated VOR, °/ s 10 15 20 0 10 20 30 40 50 7 8 9 Time, s Time, s Time constant 100 100 100 a b c
Fig. 1 The top and middle panels show the stimulus used in the experiments, with head acceleration in a and velocity in b. The stim-ulus was an initial step of velocity to about 100°/s, followed by a slowly increasing acceleration (see inset of a that shows an expanded view of the initial 50 s, and “Methods” for details). After the rotation reached 400°/s, the acceleration stopped, and the velocity remained constant until the subject’s nystagmus stopped. The acceleration pro-file was then inverted, so that there was an initial velocity step from 400°/s to 300°/s, followed by a slow change in acceleration until the chair reached −400°/s. In c, the simulated responses to the stimulus from a system consisting of dominant time constants of 10, 15, or 20 s, and an adaptation time constant of 150 s, and a gain of 0.5 are shown. The velocity response is nearly constant during the accelera-tion phase, and then during the constant velocity phase, the response declines and reverses direction, before returning toward zero before the next acceleration phase
influenced by the more gradual end of saccades, the first 10 and final five samples of each slow phase were discarded.
Nystagmus slow phases shorter than 50 ms were dis-carded, and slow phases longer than 100 ms were split into two or more parts of at least 50 ms, to ensure, for unbiased statistical analysis, that roughly the same number of data points occurred in each gaze direction. For each of these slow phases (or parts thereof), we calculated the median position and velocity.
Estimates of the change of nystagmus velocity with eye position were made by fitting second-order equations with linear regression to the velocity-versus-position data: where β0 is the intercept (with units of °/s), or velocity at gaze straight ahead, β1 (s−1) is the slope parameter that
describes how velocity changes with horizontal position,
H, and β2 (1/°s) is the second-order component. Inspection of the data showed that velocity generally built up for 3 s following the onset of the change in acceleration and then was fairly constant. So, we discarded the first 3 s of data before further analysis. We did fits to the entire acceleration period (excluding the first 3 s), as well as doing fits to the first and second half of the period, and tested whether the fit-ted parameters changed using a dummy variable to code for the two time periods (Kleinbaum et al. 1988). Finally, we did linear fits to each fixation sequence, so we could analyze the change in nystagmus in more temporal detail. In order to determine when the slope during the acceleration period first became significantly different from control values, we used Bonferroni-corrected p values.
When combining data across different rotation direc-tions, we first took the absolute value of the fitted intercepts.
Results
We first measured gaze holding prior to stimulation. The average best-fit, second-order parameters were −0.2°/s, −0.031 1 s−1, and 3.7 × 10⁻⁶ 1/°s. The average intercepts
and second-order terms were not significantly different from zero (t test, ps > 0.3), but the average slope term was less than 0 (t = 2.9, p < 0.05). A leaky velocity-to-position neural integrator with time constant τ will produce velocity that varies with horizontal position H according to the fol-lowing equation:
where bias is the velocity produced by the vestibular stimu-lation. So, an integrator time constant can be inferred from the fitted equations by −1/slope. The average time constant was 32 s.
Velocity = β0+β1H + β2H2,
Velocity = −H τ +bias
Development of Alexander’s law
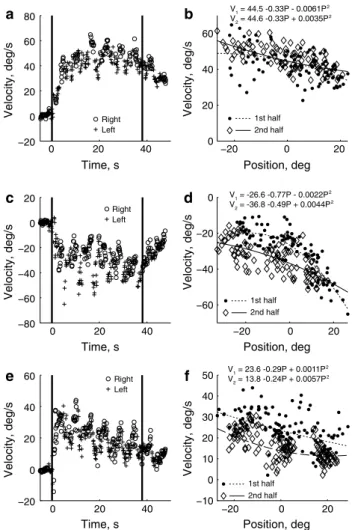
Eye velocity increased rapidly in the first several seconds after the onset of acceleration. Figure 2 shows examples from three subjects (see also Online resource 1). For the sub-ject in the top row, after the initial increase in eye velocity at the start, the velocity was fairly constant for the remainder of the acceleration period. The fitted second-order equations for the first and second halves are shown in Fig. 2b and are nearly identical, indicating that the eye velocity was very stable. For the subject shown in panels C and D, eye veloc-ity increased from the first to the second halves, whereas
0 20 40 −80 −60 −40 −20 0 20 Time, s Velocity, deg/s Right Left −20 0 20 −60 −40 −20 0 Position, deg 0 20 40 −20 0 20 40 60 80 Time, s Velocity, deg/s Right
Left −20 0 20 0 20 40 60 Position, deg 1st half 2nd half Velocity, deg/s 0 20 40 −20 0 20 40 60 Time, s Velocity, deg/s Right Left −20 0 20 −10 0 10 20 30 40 50 Position, deg Velocity, deg/s Velocity, deg/s V1 = 44.5 -0.33P - 0.0061P 2 V2 = 44.6 -0.33P + 0.0035P 2 V1 = -26.6 -0.77P - 0.0022P 2 V2 = -36.8 -0.49P + 0.0044P 2 V1 = 23.6 -0.29P + 0.0011P 2 V2 = 13.8 -0.24P + 0.0057P 2 b a d c f e 1st half 2nd half 1st half 2nd half
Fig. 2 Example data, with different subjects shown in each row. The
left column shows the eye velocity of individual slow phases plotted as a function of time, with different symbols to indicate whether the subject was looking left or right of straight ahead. Vertical lines mark the start and end of the acceleration period. The right column shows eye velocity of individual slow phases plotted against horizontal posi-tion for the acceleraposi-tion period, excluding the first 3 s. Different sym-bols indicate when the data point was from the first or second half of the experiment. The best-fit, second-order equations for the first and second half of the data are shown at the top (V velocity, with the sub-script indicating the first or second half, P is position)
eye velocity decreased over time for the subject in panels E and F.
The second-order fits to the entire acceleration period found that while the average slope term was significantly different from zero (−0.38, t = 9.6, p < 0.001), the aver-age quadratic term was not (−0.001, t = 0.3, p = 0.76) (Table 1). In addition, the slope term was significant in all 10 subjects, whereas the quadratic term was significant in only three.
Overall, there was little change in the best-fit, second-order equations between the first and second periods (Fig. 3). The average magnitudes of the intercepts were 30.8°/s and 30.4°/s for the first and second halves, respectively, and were not significantly different (t = 0.2, p = 0.84). Likewise, the
best-fit slopes (−0.366 and −0.347) were not significantly different (t = 0.4, p = 0.68), nor were the second-order terms different (0.0013 and −0.0017; t = 0.92, p = 0.38).
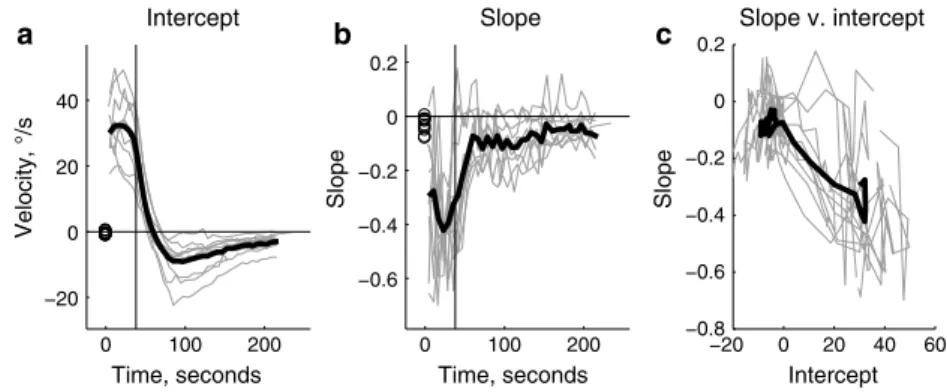
To analyze how nystagmus evolved over time in more detail, we did linear fits (since the second-order terms in the previous analysis were not significantly different from zero overall) to each fixation sequence (Fig. 4), including the 3 min after the acceleration in order to analyze the decay of nystagmus. For the first fixation sequence, six of the ten sub-jects showed slopes that were significantly different from control trials during the first fixation sequence (mean inter-cept = 30°/s, mean slope = −0.3). The first significant slope occurred, on average, 10 s after the start of the acceleration. Eye velocity declined rapidly after the acceleration ended and then reversed direction (Fig. 4a). The average maxi-mum reversal velocity (intercept) was −9°/s and occurred 59 s after the end of the acceleration. The slopes declined rapidly, but did not reverse (Fig. 4b); rather, they declined to a value of about −0.1 and then decayed with a time course similar to that of the intercept. Figure 4c shows an apparent relationship between the slope and the intercept, as higher intercepts tend to be associated with steeper slopes.
The results for the second and third acceleration periods were similar (see Table 1). The mean slopes were significantly different from control in all periods, whereas the average quadratic term was not. Recall that the sec-ond acceleration period was 78 s long, compared to 38 s for the first and third periods, which could have increased the ability to detect changes in the parameters over time. Nonetheless, the fitted parameters were very stable, with only a small reduction in the slope in the third acceleration period.
Discussion
We found an eye position dependency of the slow phase of nystagmus during constant vestibular stimulation similar to Alexander’s law. Like Robinson et al. (1984), we found it was mostly stable during the entire period of stimulation, as
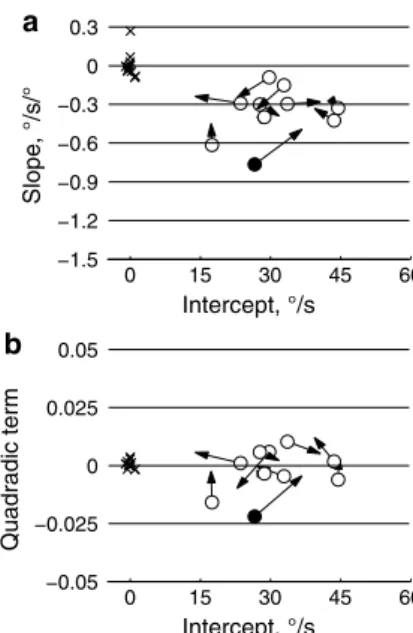
0 15 30 45 60 a Intercept, °/s Slope, °/s/° −1.5 −1.2 −0.9 −0.6 −0.3 0 0.3 0 15 30 45 60 Intercept, °/s Quadradic term b −0.05 −0.025 0 0.025 0.05
Fig. 3 The parameters of the best-fit, second-order equations to velocity-versus-position data are shown for the first acceleration period. Panel a plots the slope versus the intercept, and b plots the quadratic term versus the intercept. Circles show the fits to the first half of the acceleration period, and the arrows end at the values for the second half of the acceleration period. Filled circles indicate the change in slope (a) or quadratic (b) terms were significant. The X’s show control data
Table 1 The average parameters from the best-fit, second-order equations for the control and each acceleration period
The column marked “Δ” provides the difference between the first and the second halves (2nd − 1st) of each acceleration period t test results: *** p < 0.001, ** p < 0.01, * p < 0.05
Acceleration period Intercept (°/s) Slope (s−1) Quadratic (1/°s)
Mean Δ Mean Δ Mean Δ
Control −0.245 −0.031* 3.7 × 10−6
1st 30.39*** −0.41 −0.380*** −0.074 −0.0007 −0.0030
2nd 31.09*** −1.17 −0.331* −0.058 −0.0049 −0.0037
the magnitude was similar in the first and second halves of the acceleration period. Alexander’s law was also apparent in 6/10 subjects in the first fixation sequence and occurred on average 10 s after the onset of acceleration. Unlike the results of Robinson et al. (1984), however, the size of the effect was large and similar to what occurs in patients. Here, we found slopes of about −0.4 for nystagmus velocities of 30°/s, which are comparable to our patient studies where we found slopes of about −0.3 to −0.4 for velocities around 25°/s (Hegemann et al. 2007; Bockisch and Hegemann 2008).
Robinson et al. (1984) concluded that the eye position dependency found during constant acceleration (natural stimulation, in the sense that normal push–pull stimulation pattern is maintained, albeit for an unusual duration) was different from that observed in patients and with caloric stimulation (non-reciprocal and therefore unnatural stimu-lation, because a change in vestibular input from one side is not accompanied by the opposite change from the other side), because (1) the magnitude was small and (2) it did not evolve over time. This led Robinson et al. to conclude that Alexander’s law was an adaptive response, as it reduced eye velocity in some gaze directions, to non-reciprocal stimulation. We suggest this is incorrect for three reasons. First, the small magnitude was likely because the velocity and acceleration were lower than what we used (a 30°/s velocity step followed by 2.1°/s2, compared to a 107°/s step followed by an acceleration ramp that began at 7.1°/s2), since the magnitude of Alexander’s law increases with increasing nystagmus. Second, in their caloric stimulation study of three subjects, they report that the peak of Alex-ander’s law was delayed, on average, 25 s from the peak of nystagmus velocity, and from this they concluded that Alexander’s law needs 25 s of non-reciprocal stimulation to develop. However, in their data a clear eye position depend-ency is apparent before the peak nystagmus; the fact that the peak position dependency was delayed cannot be used to conclude that Alexander’s law was not developing earlier. In our experiment, Alexander’s law was found on average 10 s after the onset of stimulation. Third, in our recent study
with caloric stimulation, we observed Alexander’s law with bilateral bithermal stimulation (cold on one side, warm on the other) (Bockisch et al. 2012). This stimulus preserves the push–pull pattern of natural stimulation and is further evidence against the Robinson et al.’s (1984) hypothesis.
Doslak (Doslak et al. 1979, 1982) proposed that Alex-ander’s law occurs because of an eye position dependency within the VOR pathway. According to the model, when-ever the difference between the right and left canal signals exceeds a threshold, an eye velocity signal is added that depends upon eye position. Our finding that Alexander’s law occurs with constant vestibular stimulation, with very little change over time, supports the Doslak model. However, the Doslak model also predicts that the velocity-versus-position slope should be independent of nystagmus speed (above a threshold), but that is not the case in our study (Fig. 4c), nor with caloric stimulation (Bockisch et al. 2012). The model of Doslak et al. also predicts Alexander’s law should occur with the normal VOR, yet it is not found with 0.5-Hz sinu-soidal head rotations on a turntable (Robinson et al. 1984) or head impulses (Anagnostou et al. 2011; Anastasopoulos and Anagnostou 2012).
Jeffcoat et al. (2008) proposed a different account of Alex-ander’s law, where the gain of extraocular motor neurons varies with position and whether the velocity inputs come from increased or decreased canal activity. This hypothesis was based on the findings that eye movements and abducens neuron responses to short duration auditory stimuli depend upon eye position (Zhou et al. 2004, 2007). Jeffcoat et al. (Jeffcoat et al. 2008) proposed that with decreased canal activity, the abducens neuron gain decreases with adduct-ing eye position, thus producadduct-ing Alexander’s law in patients with vestibular lesions and unilateral cold caloric stimula-tion. With increased canal activity, abducens neuron gain
increases with adducting eye position. This model thus predicts a reversed Alexander’s law with unilateral warm caloric stimulation, which they reported (Jeffcoat et al. 2008). With normal, reciprocal stimulation of the canals, the gain changes with eye position cancel, producing a VOR that does not depend on eye position. Thus, this model does
0 100 200 −20 0 20 40 Time, seconds Velocity, °/s Intercept 0 100 200 −0.6 −0.4 −0.2 0 0.2 Time, seconds Slope Slope −20 0 20 40 60 −0.8 −0.6 −0.4 −0.2 0 0.2 Intercept Slope Slope v. intercept a b c
Fig. 4 The time course of linear fits to each fixation sequence. Thin lines are indi-vidual subjects, and the thick black line is the mean. Circles at time = 0 are control data. a Intercepts. b Slopes. c The slopes are plotted relative to the intercepts
not predict Alexander’s law during constant acceleration protocols, as we observed here, nor with bilateral bithermal caloric stimulation (Bockisch et al. 2012).
Constant acceleration and caloric stimulation protocols that show Alexander’s law produce very low-frequency stimulation, whereas the VOR studies that do not show Alexander’s law use higher-frequency stimuli. Alexander’s law then may be a consequence of the velocity-to-position neural integrator being insensitive to very low-frequency signals. One reason for this could be that natural head move-ments contain mainly high-frequency components. Another reason could be to make the integrator insensitive to small imbalances in the tonic stimulation from the left and right vestibular canals. While another mechanism to compensate for such imbalances exists [up-regulation of tonic inputs following peripheral lesion (Smith and Curthoys 1989)], this mechanism operates on a timescale of hours or days (Ris and Godaux 1998).
If Alexander’s law is a consequence of low-frequency stimulation, then it is tempting to speculate on the role of the velocity-storage mechanism, which enhances the low- frequency canal response in order to correctly interpret linear acceleration signals from the otoliths (Laurens and Angelaki 2011). While the linear VOR is highly eye posi-tion dependent, to produce Alexander’s law would require target distance to change with eye position, being nearer when in the fast-phase direction. The flashed targets in our setup were presented on a flat screen, with no distance difference for left and right targets. Thus, there is not an obvious functional connection between the velocity-storage mechanism and Alexander’s law.
A different explanation of Alexander’s Law in acute unilateral vestibular deficit has recently been proposed by Khojasteh et al. (2012). Due to the vestibular lesion and insufficient tonic activity on the ipsilesional primary afferents, the ipsilesional vestibular nucleus is silenced, while the contralesional vestibular nucleus becomes hyperactive (Smith and Curthoys 1989). Khojasteh et al. (2012) suggested that this asymmetry in the response of the bilateral vestibular nuclei reduces the linear operat-ing range of the central VOR circuits, which perform the integration of velocity signals. The gain of the brainstem positive feedback loop thus becomes dependent on the merging neural activity, making the integration process dependent on eye movement signals. They hence propose that in the slow-phase direction (side of the lesion) inte-gration of eye signals is insufficient (leaky), while in the fast-phase direction the integrator could become unstable. Khojasteh et al. (2012) further speculated that the persis-tent stimulation of the primary vestibular afferents by very low-frequency stimuli could in the same manner saturate the vestibular nucleus on one side, while pushing the other vestibular nucleus into inhibitory cutoff, thus producing
eye position–dependent integration similar to unilateral vestibular lesions.
Patients suffering from spontaneous nystagmus due to an acute vestibular tone asymmetry show velocity that varies with position in a nonlinear fashion (Hegemann et al. 2007; Bockisch and Hegemann 2008). We did not find similar effects here, or in our experiments with caloric stimulation (Bockisch et al. 2012). Perhaps, in patients there are adaptive mechanisms to suppress nystagmus which cause the nonlin-ear behavior, since these patients typically had nystagmus for several days before being measured. In their model of the velocity-to-position neural integrator, which was developed to describe congenital nystagmus, Optican and Zee (1984) proposed that eye position–dependent nonlinearities were necessary to account for changes in nystagmus waveforms with eye position that occur in these patients. Perhaps, mod-ifications to such mechanisms require either more time than was available in the protocol used here (patients were typi-cally measured hours or days after the onset of symptoms) or the presence of retinal slip information that was excluded in our experiments by performing them in the dark.
Clinicians often treat the presence of Alexander’s law in spontaneous nystagmus as a sign of a peripheral vestibular lesion, though we suggest it is not conclusive. If Alexan-der’s law is in fact a consequence of low-frequency velocity inputs to the velocity-to-position neural integrator, from any source, then Alexander’s law ought to occur. One example of this is pursuit after-nystagmus (Marti et al. 2005). How-ever, with other forms of nystagmus, such as infantile nys-tagmus syndrome, the Alexander’s law mechanism might be invoked, but the variation in eye velocity with position would be difficult to detect due to the complex (and tempo-rally unstable) velocity inputs.
Acknowledgments We would like to thank Beckey Trihn for collect-ing data on preliminary experiments and Marco Penner for technical support. This study was financially supported by the Swiss National Science Foundation, the Betty and David Koetser Foundation for Brain Research, Zurich, Switzerland, and the Center of Integrative Human Physiology, University of Zurich, Switzerland. E. Khojasteh receives the FQRNT postdoctoral scholarship from Quebec, Canada.
References
Alexander G (1912) Die Ohrenkrankheiten im Kindesalter. In: Schlossmann A (ed) Handbuch der Kinderheilkunde. Vogel, Leip-zig, pp 84–96
Anagnostou E, Heimberger J, Sklavos S, Anastasopoulos D (2011) Alexander’s law during high-acceleration head rotations in humans. NeuroReport 22:239–243. doi:10.1097/WNR.0b0 13e3283451769
Anastasopoulos D, Anagnostou E (2012) Invariance of vestibulo-ocu-lar reflex gain to head impulses in pitch at different initial eye-in-orbit elevations: implications for Alexander’s law. Acta Otolaryn-gol 132:1066–1072. doi:10.3109/00016489.2012.682120
Bockisch CJ, Hegemann S (2008) Alexander’s law and the ocu-lomotor neural integrator: three-dimensional eye velocity in patients with an acute vestibular asymmetry. J Neurophysiol 100:3105–3116
Bockisch CJ, Khojasteh E, Straumann D, Hegemann S (2012) Devel-opment of eye position dependency of slow phase velocity during caloric stimulation. PLoS ONE 7:e51409. doi:10.1371/journal. pone.0051409
Boumans LJ, Rodenburg M, Maas AJ (1983) Response of the human vestibulo-ocular reflex system to constant angular acceleration. II. Experimental investigation. ORL J Otorhinolaryngol Relat Spec 45:130–142
Cannon SC, Robinson DA (1987) Loss of the neural integrator of the oculomotor system from brain stem lesions in monkey. J Neuro-physiol 57:1383–1409
Cheron G, Godaux E (1987) Disabling of the oculomotor neural integrator by kainic acid injections in the prepositus-vestibular complex of the cat. J Physiol 394:267–290
Crawford JD (1994) The oculomotor neural integrator uses a behavior-related coordinate system. J Neurosci 14:6911–6923
Crawford JD, Vilis T (1993) Modularity and parallel processing in the oculomotor integrator. Exp Brain Res 96:443–456
Crawford JD, Cadera W, Vilis T (1991) Generation of torsional and vertical eye position signals by the interstitial nucleus of Cajal. Science 252:1551–1553
Doslak MJ, Dell’ Osso LF, Daroff RB (1979) A model of Alexander’s law of vestibular nystagmus. Biol Cybern 34:181–186
Doslak MJ, Dell’Osso LF, Daroff RB (1982) Alexander’s law: a model and resulting study. Ann Otol Rhinol Laryngol 91:316–322 Farshadmanesh F, Klier EM, Chang P, Wang H, Crawford JD (2007)
Three-dimensional eye-head coordination after injection of mus-cimol into the interstitial nucleus of Cajal (INC). J Neurophysiol 97:2322–2338
Furman JM, Hain TC, Paige GD (1989) Central adaptation models of the vestibulo-ocular and optokinetic systems. Biol Cybern 61:255–264
Glasauer S (2006) Cerebellar contribution to saccades and gaze hold-ing: a modeling approach. Ann N Y Acad Sci 1004:206–219 Hegemann S, Straumann D, Bockisch C (2007) Alexander’s law in
patients with acute vestibular tone asymmetry—evidence for multiple horizontal neural integrators. J Assoc Res Otolaryngol 8:551–561. doi:10.1007/s10162-007-0095-6
Helmchen C, Rambold H, Fuhry L, Buttner U (1998) Deficits in verti-cal and torsional eye movements after uni- and bilateral muscimol inactivation of the interstitial nucleus of Cajal of the alert monkey. Exp Brain Res 119:436–452
Hess K (1982) Do peripheral-vestibular lesions in man affect the posi-tion integrator of the eyes? Neurosci Lett Suppl 10:242–243 Jeffcoat B, Shelukhin A, Fong A, Mustain W, Zhou W (2008)
Alexan-der’s law revisited. J Neurophysiol 100:154–159
Khojasteh E, Bockisch CJ, Straumann D, Hegemann SCA (2012) A dynamic model for eye-position-dependence of spontaneous nystagmus in acute unilateral vestibular deficit. Eur J Neurosci. doi:10.1111/ejn.12030
King WM, Fuchs AF, Magnin M (1981) Vertical eye movement-related responses of neurons in midbrain near intestinal nucleus of Cajal. J Neurophysiol 46:549–562
Kleinbaum DG, Kupper LL, Muller KE (1988) Applied regression analysis and other multivariable methods. PWS-Kent Publishing Company, Boston
Laurens J, Angelaki DE (2011) The functional significance of velocity storage and its dependence on gravity. Exp Brain Res 210:407– 422. doi:10.1007/s00221-011-2568-4
Leigh RJ, Robinson DA, Zee DS (1981) A hypothetical explanation for periodic alternating nystagmus: instability in the optokinetic-vestibular system. Ann N Y Acad Sci 374:619–635
Marti S, Bockisch CJ, Straumann D (2005) Prolonged asymmet-ric smooth-pursuit stimulation leads to downbeat nystagmus in healthy human subjects. Invest Opththalmol Vis Sci 46:143–149 McConville K, Tomlinson RD, King WM, Paige G, Na EQ (1994) Eye
position signals in the vestibular nuclei: consequences for models of integrator function. J Vestib Res 4:391–400
McFarland JL, Fuchs AF (1992) Discharge patterns in nucleus prep-ositus hypoglossi and adjacent medial vestibular nucleus during horizontal eye movement in behaving macaques. J Neurophysiol 68:319–332
Optican LM, Zee DS (1984) A hypothetical explanation of congenital nystagmus. Biol Cybern 50:119–134
Ris L, Godaux E (1998) Spike discharge regularity of vestibu-lar neurons in labyrinthectomized guinea pigs. Neurosci Lett 253:131–134
Robinson DA, Zee DS, Hain TC, Holmes A, Rosenberg LF (1984) Alexander’s law: its behavior and origin in the human vestibulo-ocular reflex. Ann Neurol 16:714–722
Smith PF, Curthoys IS (1989) Mechanisms of recovery following unilat-eral labyrinthectomy: a review. Brain Res Brain Res Rev 14:155–180 Takemori S, Cohen B (1974) Loss of visual suppression of vestibu-lar nystagmus after flocculus lesions. Brain Res 72:213–224. doi:10.1016/0006-8993(74)90860-9
Waespe W, Cohen B, Raphan T (1983) Role of the flocculus and para-flocculus in optokinetic nystagmus and visual-vestibular interac-tions: effects of lesions. Exp Brain Res 50:9–33
Zee DS, Yamazaki A, Butler PH, Gucer G (1981) Effects of ablation of flocculus and paraflocculus of eye movements in primate. J Neu-rophysiol 46:878–899
Zhou W, Mustain W, Simpson I (2004) Sound-evoked vestibulo-ocular reflexes (VOR) in trained monkeys. Exp Brain Res 156:129–134. doi:10.1007/s00221-003-1778-9
Zhou W, Xu Y, Simpson I, Cai Y (2007) Multiplicative computation in the vestibulo-ocular reflex (VOR). J Neurophysiol 2780–2789