Graphical representation of hydrogen bonding patterns in proteins
A.D.Factor1 and E.L.Mehler12
'Department of Physiology and Biophysics, Mount Sinai School of Medicine of the City University of New York, New York, NY 10029, USA and department of Structural Biology, Biocenter of the University of Basel, CH-4056 Basel, Switzerland
A graphical representation of the intramolecular hydrogen bonding in a protein is described, which provides a direct and easily interpretable display of its secondary and tertiary struc-tural elements. The representation is constructed by scanning the coordinate list for all potential proton donor (PD)-proton acceptor (PA) pairs, and any pair which satisfies certain preset distance and angle criteria is classified as being H-bonded. The resulting list of H-bonds is mapped onto an
N x N matrix, where N is the number of residues in the
protein, by assigning an element ij of the matrix to all the PA-PD pairs between atoms of residues i and,/. Subsequently graphical objects are generated for all elements which are labeled as representing one or more H-bonds, and which can then be plotted or displayed in a way analogous to the graphical representation of the distance matrix (DM). In contrast to the DM, the hydrogen bonding matrix (HBM) is sparse, which allows the patterns representing secondary and tertiary structural motifs to be quickly and clearly recognized. In addition, changes in structure are easily identifiable from changes in the H-bonding patterns. The analysis and inter-pretation of the HBM is discussed using aspartate amino-transferase and calmodulin as examples.
Key words: hydrogen bonding patterns/protein structure/hydrogen
bonding in proteins
Introduction and methods
Due to the intimate relationship between the structure and function of proteins, considerable effort has been invested in developing simplified representations of both secondary and tertiary structure derived from the atomic coordinates. At the qualitative level the cartoon representations of Richardson (1981, 1985) are particu-larly useful for gaining a global overview of the three-dimensional structure. Computer programs have been written to reproduce such cartoons, and a recent good example is Priestle (1988). However, for most analyses more quantitative representations are required, and the distance matrix (DM) (Phillips, 1970; Nishikawa et al., 1972; Kuntz, 1975) is a convenient way to display the organization of protein secondary, tertiary and super-tertiary structure. The method was shown to be useful for the comparison of protein structure of both homologous and nonhomologous systems (Liebman et al., 1985).
The DM for a protein consisting of N amino acid residues is constructed by using the coordinates of the a carbon atom of each residue to calculate the elements of an N x N square, symmetric matrix, where the yth element is given by the distance between a carbon (/) and a carbon (/). The DM can be displayed graphically by contouring or by generating graphical objects (symbols or colored spots) representing distances within certain
preset ranges. The matrix (or its graphical representation) highlights regions of contact in the three-dimensional structure where residues are close together even though they may be sequentially far apart. Such short separations between sequen-tially distant residues result from the tertiary folding of the protein. Analysis of a large number of proteins of known struc-ture has revealed characteristic shading patterns associated with well-defined structural motifs such as a helices, parallel and anti-parallel j3 sheets, and tertiary structural patterns resulting from the interactions of sheets, turns and helices (Liebman et al., 1985).
The main advantage of the DM is that the three-dimensional structure of the protein has been reduced to a two-dimensional representation which simplifies analysis. It should be noted, however, that the selection of distance ranges is arbitrary and has to be carefully chosen so that important structural features are properly exhibited. At the same time the graphical represen-tation of the DM can also become rather complex, obscuring some of the detail of the structural relationships. Moreover, the use of a carbon distances to construct the DM is not directly related to any of the intramolecular interactions which determine the observed structural patterns. A graphical representation of protein structure which would include both structural and energetic components might be useful, in that the relationship between them may become more apparent, and the analysis of structural changes may be more easily related to loss or gain of stabilizing interactions. Here we suggest one such combined representation based on an analysis of the hydrogen bonding patterns observed in proteins.
It is well known that secondary structural motifs, e.g. a helices, /3 sheets and bends, are characterized by unique hydrogen bonding patterns (Kabsch and Sander, 1983). It is, however, less obvious whether the more global tertiary structural features can also be identified from an analysis of the intramolecular H-bonding. An easily interpretable representation of such patterns is obtained by recasting them in a matrix form, which can be displayed graphically in a way similar to the DM. As will be seen below, the graphical representation of this H-bonding matrix (HBM) is much sparser than the DM. Nevertheless, the HBM allows a full analysis of both secondary and tertiary structure to be carried out and can show structural details not easily identified in the DM. Finally, since the geometric requirements for defining an H-bond are well established, the degree of arbitrariness inherent in the HBM is much less than in the DM.
The algorithm for constructing the HBM is based on a list of all the potential proton donor (PD)-proton acceptor (PA) pairs in the protein. PD—PA pairs are classified as being hydrogen bonded if their separation falls within a preassigned threshold. For the H-bonds between main chain nitrogen-oxygen pairs the bond angle (PA-H-PD) is also estimated and a threshold is assigned for an acceptable H-bond angle. Reasonable values for these two parameters are bond length <3.3 A and bond angle > 120° respectively. For H-bonds between other P A - P D pairs only the distance criterion is used. Although this may lead to a slight overestimation of the occurrence of such H-bonds, our
experience to date has shown this not to be a serious problem. Finally, intraresidue H-bonds and nearest-neighbor (/,;'+1) H-bonds between main-chain PAs and PDs are excluded from the list.
For a protein consisting of A' residues the list of H-bonded pairs is converted into a graphical representation by mapping the list onto an /V'-dimensional matrix in two steps. In the first step each pair, PA, —PD,-, where i and y refer to the atoms' residue numbers, is associated with the j/th element of the N'-dimensional matrix, i.e. the HBM. Usually N' is set equal to N, but for homologous families which have been given a common residue assignment consisting of N' residues (N' >N), the mapping can be effected onto the latter. Naturally, this will only be sensible if, for the particular structure being plotted, the residue numbering has been modified to reflect the deletions/insertions relative to the common assignment. Each element of the HBM represents none, one, or more H-bonds between residues / andy, which can be classified as main main chain (m-m), main chain-side chain (m-s), chain-side chain—chain-side chain (s-s) or combinations of these yielding eight different classes. The second step consists of generating graphical objects, one for each element, and assigning a different color or symbol to each class. The graphical objects corresponding to residue pairs which are not H-bonded are usually left blank and assume the background color. As with the DM, the HBM is a square, symmetric matrix. Moreover the diagonal elements of the HBM are not needed and can be used to exhibit solvent-residue H-bonds or other intermolecular interactions.
Results and discussion
To demonstrate the utility of the HBM we present it for two proteins: chicken mitochondrial aspartate aminotransferase (mAAT) and calmodulin. The former is a dimer with each subunit consisting of 401 amino acid residues. We consider the subunit only and compare the HBM with the DM. The crystallographic structure of mAAT has been determined to a resolution of 1.9 A (Jansonius et al., 1987; C.A.McPhalen et al., in preparation). Calmodulin, which consists of 148 residues, has recently been the subject of computer simulation studies (E.L.Mehler and H.Weinstein, unpublished results) and we present here a comparative analysis between the X-ray structure (Babu et al., 1988) and the structure resulting from one of the dynamics runs.
Analysis and interpretation of the HBM
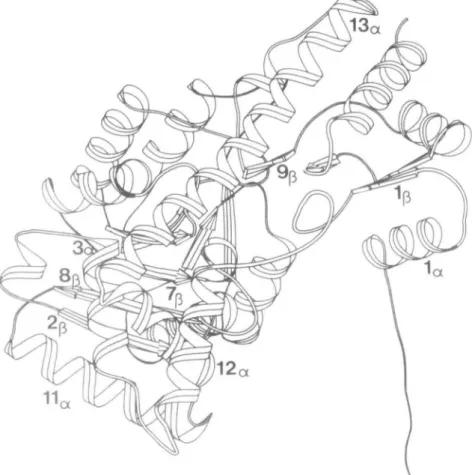
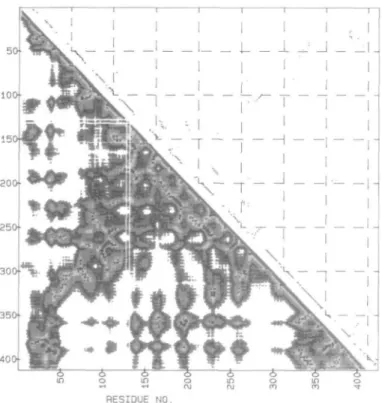
Two structural forms of mAAT have been observed by X-ray crystallography, i.e. an 'open' and a 'closed' form. For detailed discussion of the structure of mAAT see Ford et al. (1980); Kirsch et al. (1984); Picot et al. (1991). Figure 1 presents a computer-generated ribbon drawing (Priestle, 1988) of one subunit of the open form of mAAT. The DM and HBM of mAAT presented in Figure 2 have been mapped onto the pig cytosolic AATase sequence (Ovchinnikov et al., 1973) with N' = 412, and 11 deletions have been inserted to maximize sequence homology (Ford et al., 1980). This protein includes a number of secondary and tertiary structural motifs, and thus is well suited for analyzing the general and detailed features of the HBM. Comparison of the two representations clearly illustrates the
11
a
sparseness of the HBM relative to the DM. This feature helps simplify its analysis and allows inter-residue interactions to be easily identified. It is clear, however, that the two representa-tions are complementary since the DM directly exhibits the global architecture of the protein, whereas the HBM provides a more detailed picture of specific structural elements.
a-Helical structures are characterized by m-m H-bonds between the z'th and i+4th residues, and are represented in the HBM by marking the corresponding positions in the graphical representation. For segments which are close to ideal a-helical structure the corresponding consecutive i,i+4 positions form continuous rows which are shifted four positions from the main diagonal and run parallel to it as shown in Figure 2. Large devia-tions from ideality within an a helix are indicated by gaps of one or a few residues in the row. Stretches of 3,0 helix are
similarly depicted, except that they appear in the i,i+3 positions of the HBM. Isolated m-m i,i+3 or i,i+4 H-bonds indicate turns, bends or sometimes very short stretches of helix. In parallel (3 sheets the ith residue of the first strand is H-bonded to the yth and 7+1st residue of the second strand. Therefore one observes two adjacent rows of shaded elements in the HBM, and since the chains run in the same direction the rows are oriented parallel to the main diagonal (see Figure 2). In contrast, for anti-parallel /3 sheets ith residue of the first chain and the yth residue of the second form two m-m H-bonds with each other. Since the two strands run in opposite directions, the anti-parallel sheet is represented by a single row of elements perpendicular to the main diagonal.
The formal assignments of secondary structure (C.A.McPhalen
et al., in preparation) using the program of Kabsch and Sander
(1983), and the assignments taken from the HBM are given in
400
RESIDUE NO.
Fig. 2. DM (lower triangle) and HBM (upper triangle) of one subunit of the
open conformation (Jansonius et al., 1987) of mAAT. DM code: 0.0-8.0 A, blue; 8.0-15.0 A, yellow; 15.0-22.0 A, red; 22.0-30.0 A, green. HBM code: m-m, blue; m-s, yellow; s-s, red; m-m + m-s, green; m-m + s-s, purple; m-s + s-s, orange; m-m + m-s + s-s, brown.
Table I. Comparison of the positions and lengths of the indivi-dual segments shows nearly perfect agreement, so that the HBM can be used as a simple device to obtain an assignment of secon-dary structure in proteins. Figure 2 also shows that a number of the /3-sheet segments have common strands, which are listed in Table I with two assignments. These shared strands are parts of more extensive )3-sheet structure. In the ensuing discussion we use the notation Ia and Ip where a and /3 refer to a helix
or /3 sheet respectively, and / denotes the strand number given in Table I.
To interpret the HBM's rendering of tertiary structure it is essential to realize that it is symmetric. Thus for residues i and
j belonging to, say, secondary structural group IpJp, interactions
occur with any other group KQL$ containing elements i,k; k,i;
j,l; or l,j where k and / have values 1,2,...,N. For example, in
Figure 2 consider the anti-parallel /3 sheets 2Q8$ (residues 9 9 - 1 0 5 ; 268-274) and 708e (residues 250-256; 267-273)
have the common strand J = L = 8 and are exhibited in the HBM by the positions of the two anti-parallel /3 strands in the plot. These data identify part of a j3 sheet with strand 8p between and anti-parallel to strands 2$ and 7^. These elements are also identified in the ribbon drawing given in Figure 1 and belong to the a/0 fold that is part of the coenzyme's binding domain (Ford et al., 1980) which runs from about residue 95 to 270. The entire fold includes a helices 4 — 10 and /3 strands 2 — 8 and is represented in the HBM by the alternating /3 strand—a helix H-bonding configuration between residues 95 and 270, The a-helical H-bonding pattern of segment 256—260 is only observed if the H-bond cutoff length is increased to 3.35 A. This segment was assigned a helical structure by Ford et al. (1980) but not by C.A.McPhalen et al. (in preparation). In addition to the H-bond between residues 256 and 260, a 31 0 helix-like
H-bond was detected between residues 258 and 261.
While m-m H-bonding primarily denotes elements of
secon2 0 4 0 -5 0 - — 8 0 - 100- 120-140- — — I — — RESIDUE NO.
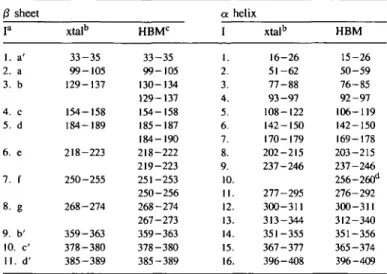
Fig. 3. HBM of calmodulin: upper triangle from X-ray structure (Babu et al., 1989); lower triangle from molecular dynamics simulation (E.L.Mehler and H.Weinstein, unpublished); color code as in Figure 2.
Table I. 0 sheet P 1. a' 2. a 3. b 4. c 5. d 6. e 7. f 8- g 9. b' 10. c' 11. d' Secondary xtalb 33-35 99-105 129-137 154-158 184-189 218-223 250-255 268-274 359-363 378-380 385-389 structural assignments HBMC 33-35 99-105 130-134 129-137 154-158 185-187 184-190 218-222 219-223 251-253 250-256 268-274 267-273 359-363 378-380 385-389 in a I 1. 2. 3. 4. 5. 6. 7. 8. 9. 10 11 12 13 14 15 16 mAAT helix xtalb 16-26 51-62 77-88 93-97 108-122 142-150 170-179 202-215 237-246 277-295 300-311 313-344 351-355 367-377 396-408 HBM 15-26 50-59 76-85 92-97 106-119 142-150 169-178 203-215 237-246 256-260d 276-292 300-311 312-340 351-356 365-374 396-409
aLetter code corresponds to assignment labeling in Jansonius and Vincent (1987).
bCrystallographic (xtal) secondary structural assignments taken from C.A.McPhalen et al. (in preparation).
cSegments assigned from first and last element in HBM; strands with two assignments are common to more than one /3-sheet element.
dThis short a-helical segment only appears if the distance threshold is set to
3.35 A.
dary structure, and their positional relationships can be used to deduce tertiary structural components, m-s and s-s H-bonds indicate additional interactions resulting from the protein's tertiary structure. For example Figure 1 shows the /3 strand 9p juxtaposed near the long a helix (13a). The HBM shows m-s
interactions at 358,334 and 360,334 denoting H-bonds between Q-» and 13a. Other examples include m-m 29,32, m-s 29,31 and
m-s 29,30 which stabilize the turn between la and \0 (Figure
1) and is denoted as a type I turn by C.A.McPhalen et al. (in preparation); m-s 254,83 and s-s 256,83 which are H-bonds between 7^ and 3a and m-m 297,295 which stabilizes the turn
between l la and 12a. From these examples it is clear that the
HBM can be used for a fairly complete analysis of both secondary and tertiary structure.
Comparison of hydrogen bonding patterns from different conformations
The HBM is particularly convenient for comparing different conformations of a given protein. Here we consider the Ca-binding protein calmodulin and compare the X-ray structure with a structure resulting from a molecular dynamics study of this system. Calmodulin is an ubiquitous intracellular protein which binds 4 moles of Ca2+ per mole of protein and regulates
the activity of a wide variety of enzymes (Cox et al., 1988; Wnuk 1988). The crystallographic structure (Babu et al., 1988) has revealed that it contains two homologous globular domains which are connected by a long, solvent-exposed helix. Each domain contains two Ca2+-binding motifs, denoted as EF hands
(Kret-singer, 1982) and consisting of two a helices flanking a Ca2+
-binding segment of 12 residues. The central helix connects the two domains via a helical tether consisting of the nine residue segment 7 5 - 8 4 .
triangle) and of the structure resulting from a computer simula-tion study (lower triangle). The former was generated directly from the X-ray coordinates (Babu et al., 1988), while the latter was produced from the coordinates of a molecular dynamics study
of this molecule (E.L.Mehler and H.Weinstein, unpublished results). The a helices observed in the X-ray structure are at residues 5-20, 2 8 - 3 9 , 4 4 - 5 2 , 64-93, 101-112, 117-129 and 137-146. The single, isolated m-m H-bonds between residues 27 and 63 and residues 82 and 139 are (3-sheet interactions between the neighboring Ca2+ binding loops in each domain.
There are no interdomain H-bonds, but a few intradomain s-s H-bonds due to the folding of each domain in the protein. These include an H-bond between the segment linking the two EF hands in the N-domain and the second helix in the N-terminal EF hand (residues 42,29); an H-bond between the tether helix and the last Ca-binding loop (132,82); another H-bond linking the two helices of the C-terminal EF hand (148,128); and finally two H-bonds between the Ca-binding loop of the second EF hand in the N-domain and its C-terminal a helix (67,58 and 67,59).
The changes in secondary and tertiary structure of the dynamics structure are evident upon comparison of the two HBMs. The computer-simulation structure (which is the result of a molecular dynamics run carried out on calmodulin in vacuum with an effec-tive dielectric constant of unity) shows a large reduction in the
a helical structure of the protein. Specifically, helix 1 (residues
5 - 2 0 in the X-ray structure) is reduced to a segment of only eight residues (11 — 19) and helix 3 (residues 44-52) is completely lost. The central helix exhibits many deformations with a loss of eight m-m H-bonds from a total of 15 in the X-ray structure. The /3-sheet interactions between the Ca2+ binding
domains are still present, but additional m-s and s-s H-bonds have formed between residues 27,63 and 29,61 in the N-domain, and residues 100,136 and 102,134 in the C-domain.
There are numerous s-s H-bonds formed in the dynamics structure which are not observed in the X-ray conformation. Such H-bonds often are artifacts of in vacuo molecular dynamics simulations where the solvent-exposed charged and polar residues tend to form intramolecular H-bonds in the absence of explicit or model solvent. The s-s H-bond between residues 29 and 45 in the X-ray conformation has been replaced by one between residues 29 and 30 while the s-s H-bond between residues 82 and 139 has been broken and indicates a major change in the tertiary structure of the protein. In fact the a carbons of these residues have moved from a separation of 10.75 to 22.0 A. Several H-bonds appear in the simulation structure between strands 1-11 and 7 5 - 8 4 indicating large movements of these segments in the protein. For example the a carbons of residues 6 and 81 are 24.5 A apart in the X-ray and 5.7 A apart in the simulation structure. The two globular domains of calmodulin have undergone large shifts during the simulation and as a result they interact more closely with a distorted central helix. Conclusions
The matrix representation of the hydrogen bonding patterns in proteins which has been proposed in this note is useful for the analysis of both secondary and tertiary structure, and exhibits how the intramolecular hydrogen bonding is related to these struc-tural elements. Moreover, this graphical representation allows changes due to structural modification to be easily identified and interpreted and a qualitative analysis of the relationship between H-bonding and structural changes can be effectuated. An alter-native way to exhibit changes in H-bonding patterns between two structures would be the direct graphical representation of the difference HBM (DHBM), i.e. the difference between the upper and lower triangle in Figure 3. Although most of the structural information contained in the HBM would be lost, in conjunction
with the latter the DHBM would highlight regions where exten-sive changes in H-bonding have occurred, and may be useful for complex structures. A program for the graphical display of the HBM (and DHBM) on the SG IRIS is available on request. The program (and a modified VAX version) can also prepare files which can be plotted on an HP plotter.
Acknowledgements
The authors thank Drs J.N.Jansonius and C.A.McPhalen for making their results available prior to publication. The authors gratefully acknowledge partial support of NIH grant GM-41373, by an NIH senior Fellowship (F33) GM-13103 (to E.L.M.), and Swiss National Science Foundation Grant 31-8840.86 (to E.L.M.). Computations were performed at the Pittsburgh Supercomputer Center (spon-sored by the National Science Foundation), the Cornell National Supercomputer Facility (sponsored by the National Science Foundation and IBM) and the Univer-sity Computer Centers of the City UniverUniver-sity of New York and the UniverUniver-sity of Basel, Switzerland.
References
Babu,Y.S. Bugg,C.E. and Cook,W.J. (1988) J. Mol. Biol., 204, 191-204. Cox.J.A., Corote.M., Mamar-Buchi.A., Milos.M. and Schear.J.-I. (1988) In
Gerday.C, Bulis.L. and Gilles.R. (eds), Calcium and Calcium Binding Proteins. Springer Verlag, New York, pp. 141-162.
Ford.G.C, Eichele,G. and Jansonius,J.N. (1980) Proc. Natl Acad. Sci. USA,
77, 2559-2563.
Jansonius,J.N. and Vincent.M.G. (1987) In Jumak.F.A. and McPherson,A. (eds), Biological Macromolecules and Assemblies. J. Wiley & Sons, New York, Vol. 3, pp. 187-285.
JonsoniusJ.N., Vincent,M.G., McPhalen.C.A. and Picot,D. (1987) In KorpeUa.T. and Christen,P. (eds), Biochemistry of Vitamin B6. Birkauser Verlag AG, Basel, pp. 8 9 - 9 8 .
Kabsch.W. and Sander,C. (1983) Biopolymers, 22, 2577-2637.
Kirsch,J.F., Eichele,G., Ford,G.C, Vincent.M.G., Jansonius.J.N., Gehring,H. and Christen,P. (1984) J. Mol. Biol., 174, 497-525.
Kretsinger,R.H. (1982) CRC Crit. Rev. Biochem., 8, 118-174. Kuntz,I.D. (1975) J. Am. Chem. Soc, 97, 4362-4366.
Liebman.M.N., Venanzi.C.A. and Weinstein,H. (1985) Biopolymers, 24, 1721-1758.
Nishikawa.K., Ooi.T., Isogai.Y. and Saito,N. (1972) J. Phys. Soc. Jap., 32, 1331-1337.
Ovchinnikov.Y.A., Egorov,C.A., Aldanova.N.A., Feigina,M.Y., Lipkin.V.M., Abdulaev,N.G., Grishin,E.V., Kiselev.A.P., Modyanov,N.N., Braun-stein.A.E., Polyanovski.O.L. and Nosikov,V.V. (1973) FEBS Lett., 29, 3 1 - 3 4 .
Phillips,D.C. (1970) In Goodwin,T.W. (ed.), British Biochemistry, Past and Present. Academic Press, pp. 11-28.
Picot.D., Sandmeier,E., Thaller.C, Vincent.M.G., Christen,P. and Jansonius, J.N. (1991) Eur. J. Biochem., in press.
Priestle,J.P. (1988) J. Appl. Cryst., 21, 572-576. Richardson,J.S. (1981) Adv. Protein Chem., 34, 167-339. Richardson.J.S. (1985) Methods Enzymoi, 115, 359-380.
Wnuk,W. (1988) In Gerday,C, Bolis,L. and Gilles.R. (eds) Calcium and Calcium Binding Proteins. Springer Verlag, New York, pp. 4 4 - 6 8 .