HAL Id: hal-03084031
https://hal.archives-ouvertes.fr/hal-03084031
Submitted on 20 Dec 2020
HAL is a multi-disciplinary open access
archive for the deposit and dissemination of
sci-entific research documents, whether they are
pub-lished or not. The documents may come from
teaching and research institutions in France or
abroad, or from public or private research centers.
L’archive ouverte pluridisciplinaire HAL, est
destinée au dépôt et à la diffusion de documents
scientifiques de niveau recherche, publiés ou non,
émanant des établissements d’enseignement et de
recherche français ou étrangers, des laboratoires
publics ou privés.
change on European forests
Paloma Ruiz-Benito, Giorgio Vacchiano, Emily Lines, Christopher P.O. Reyer,
Sophia Ratcliffe, Xavier Morin, Florian Hartig, Annikki Mäkelä, Rasoul
Yousefpour, Jimena Chaves, et al.
To cite this version:
Paloma Ruiz-Benito, Giorgio Vacchiano, Emily Lines, Christopher P.O. Reyer, Sophia Ratcliffe, et
al.. Available and missing data to model impact of climate change on European forests. Ecological
Modelling, 2020, 416, pp.108870. �10.1016/j.ecolmodel.2019.108870�. �hal-03084031�
Contents lists available atScienceDirect
Ecological Modelling
journal homepage:www.elsevier.com/locate/ecolmodel
Available and missing data to model impact of climate change on European
forests
Paloma Ruiz-Benito
1,*
, Giorgio Vacchiano
2, Emily R. Lines
3, Christopher P.O. Reyer
4,
Sophia Ratcliffe
5, Xavier Morin
6, Florian Hartig
7, Annikki Mäkelä
8, Rasoul Yousefpour
9,
Jimena E. Chaves
10, Alicia Palacios-Orueta
11, Marta Benito-Garzón
12, Cesar Morales-Molino
13,
J. Julio Camarero
14, Alistair S. Jump
15, Jens Kattge
16, Aleksi Lehtonen
17, Andreas Ibrom
18,
Harry J.F. Owen
19, Miguel A. Zavala
201Grupo de Ecología y Restauración Forestal, Departamento de Ciencias de la Vida, Universidad de Alcalá, Edificio de Ciencias, Campus Universitario, 28805 Alcalá de Henares (Madrid), Departamento de Biología y Geología, Física y Química Inorgánica, Escuela Superior de Ciencias Experimentales y Tecnología, Universidad Rey Juan Carlos, C/ Tulipán s/n, 28933, Móstoles (Madrid), Spain
2Department of Agricultural and Environmental Sciences (DISAA), University of Milan, Via Celoria 2, 23100 Milan, Italy 3School of Geography, Queen Mary University of London, London, United Kingdom
4Potsdam Institute for Climate Impact Research (PIK), Member of the Leibniz Association, P.O. Box 601203, D-14412 Potsdam, Germany
5Department of Systematic Botany and Functional Biodiversity, Institute of Biology, University of Leipzig, Johannisallee 21-23, 04103 Leipzig, Germany; National Biodiversity Network (NBN) Trust, Unit F, 14-18 St. Mary’s Gate, Lace Market, Nottingham NG11PF, United Kingdom
6CEFE UMR 5175 (CNRS, Université de Montpellier, Université Paul-Valéry Montpellier, EPHE), 1919 Route de Mende, F-34293 Montpellier Cedex 5, France 7Theoretical Ecology, University of Regensburg, Universitätsstraße 31, 93053 Regensburg, Germany
8Department of Forest Sciences, University of Helsinki, Helsinki, Finland
9Chair of Forestry Economics and Forest Planning, Faculty of Environment and Natural Resources, University of Freiburg, Tennenbacherstr. 4, D-79106, Freiburg, Germany
10Facultad de Ciencias Exactas y Naturales, Universidad Nacional de Cuyo, Mendoza, Argentina
11Departamento de Sistemas y Recursos Naturales, E.T.S.I.M., Universidad Politécnica de Madrid, Spain; Research Center for the Management of Environmental and Agricultural Risks (CEIGRAM), Universidad Politécnica de Madrid, Spain
12UMR 1202 Biodiversité Gènes Ecosystémes (BioGeCo), Université de Bordeaux, 33170 Talence, France
13UMR CNRS 5805 EPOC Université de Bordeaux and EPHE Department of Palaeoclimatology and Marine Palaeoenvironments PSL Research University, Pessac, France. Institute of Plant Sciences and Oeschger Centre for Climate Change Research, University of Bern, Bern, Switzerland
14Instituto Pirenaico de Ecología (IPE-CSIC), Avda. Montañana 1005, 50192 Zaragoza, Spain
15Biological and Environmental Sciences, Faculty of Natural Sciences, University of Stirling, FK9 4LA Stirling; and CREAF, Campus de Bellaterra (UAB) Edifici C, 08193 Cerdanyola del Vallès, Spain
16Max Planck Institute for Biogeochemistry, Hans-Knöll-Straße 10, 07745 Jena and German Centre for Integrative Biodiversity Research (iDiv) Halle-Jena-Leipzig, Deutscher Platz 5E, 04103 Leipzig, Germany
17Natural Resources Institute Finland (Luke), Latokartanonkaari 9, 00710 Helsinki, Finland
18Dept. of Environmental Engineering, Technical University of Denmark (DTU), 2800 Kgs. Lyngby, Denmark 19School of Geography, Queen Mary University of London, London, United Kingdom
20Grupo de Ecología y Restauración Forestal, Departamento de Ciencias de la Vida, Universidad de Alcalá, Edificio de Ciencias, Campus Universitario, 28805 Alcalá de Henares (Madrid), Instituto Franklin, Universidad de Alcalá, Calle Trinidad 1, 28801 Alcalá de Henares, Madrid, Spain
A R T I C L E I N F O Keywords: climatic extremes data accessibility data integration drivers A B S T R A C T
Climate change is expected to cause major changes in forest ecosystems during the 21stcentury and beyond. To
assess forest impacts from climate change, the existing empirical information must be structured, harmonised and assimilated into a form suitable to develop and test state-of-the-art forest and ecosystem models. The combination of empirical data collected at large spatial and long temporal scales with suitable modelling ap-proaches is key to understand forest dynamics under climate change. To facilitate data and model integration,
https://doi.org/10.1016/j.ecolmodel.2019.108870
Received 29 March 2019; Received in revised form 28 October 2019; Accepted 30 October 2019
⁎Corresponding author.
E-mail addresses:[email protected](P. Ruiz-Benito),[email protected](G. Vacchiano),[email protected](E.R. Lines), [email protected](C.P.O. Reyer),[email protected](S. Ratcliffe),[email protected](X. Morin),
[email protected](F. Hartig),[email protected](A. Mäkelä),[email protected](R. Yousefpour), [email protected](J.E. Chaves),[email protected](A. Palacios-Orueta),[email protected](M. Benito-Garzón),
[email protected](C. Morales-Molino),[email protected](J.J. Camarero),[email protected](A.S. Jump),[email protected](J. Kattge), [email protected](A. Lehtonen),[email protected](A. Ibrom),[email protected](H.J.F. Owen),[email protected](M.A. Zavala).
0304-3800/ © 2019 The Author(s). Published by Elsevier B.V. This is an open access article under the CC BY license (http://creativecommons.org/licenses/BY/4.0/).
forest responses to climate change harmonisation
open access
we identified major climate change impacts observed on European forest functioning and summarised the data available for monitoring and predicting such impacts. Our analysis of c. 120 forest-related databases (including information from remote sensing, vegetation inventories, dendroecology, palaeoecology, eddy-flux sites, common garden experiments and genetic techniques) and 50 databases of environmental drivers highlights a substantial degree of data availability and accessibility. However, some critical variables relevant to predicting European forest responses to climate change are only available at relatively short time frames (up to 10-20 years), including intra-specific trait variability, defoliation patterns, tree mortality and recruitment. Moreover, we identified data gaps or lack of data integration particularly in variables related to local adaptation and phenotypic plasticity, dispersal capabilities and physiological responses. Overall, we conclude that forest data availability across Europe is improving, but further efforts are needed to integrate, harmonise and interpret this data (i.e. making data useable for non-experts). Continuation of existing monitoring and networks schemes together with the establishments of new networks to address data gaps is crucial to rigorously predict climate change impacts on European forests.
1. Introduction
Changes in mean and extreme climatic conditions are affecting forest functioning worldwide (Frank et al., 2015, EEA, 2017, Seidl et al., 2017). Understanding and predicting these impacts is necessary for science-based decisions, but challenging because climate change interacts with other drivers of global change, such as rising atmospheric CO2 (Cramer et al., 2001), atmospheric deposition (de Vries et al., 2014), land use change (Linares et al., 2009, García-Valdés et al., 2015), pests and invasive species (Krumm & Vitková, 2016,Liu et al., 2017), and management and legacy effects (Baudena et al., 2015,Motta et al., 2015,Morales-Molino et al., 2017a,Ruiz-Benito et al., 2017b). Moreover, ecosystems react to climate change in complex ways, for example through stabilizing processes (Lloret et al., 2012) such as po-sitive biotic interactions (Ruiz-Benito et al., 2017a) or local adaptation and phenotypic plasticity (Valladares et al., 2014,Benito-Garzón et al., 2019), but also with destabilizing non-linear responses and feedbacks that could trigger tipping points (Camarero et al., 2015,Reyer et al., 2015). To support the crucial role of forests in maintaining key eco-system services decision-makers must adapt forests for the future (Messier et al., 2013,IPCC, 2014). To aid this process, it is therefore critically important to rapidly increase our ability to predict forest re-sponses and vulnerability to climate change (Urban et al., 2016).
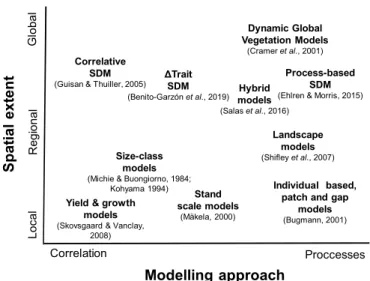
The use of empirical data at large spatial and/or long temporal extents in combination with suitable models is one of the most powerful tools for better understanding forest function, predicting vulnerability to climate change and assessing options for mitigation and adaptation (see e.g.Mouquet et al., 2015). During the last few decades there has been a steady development in modelling techniques (Franklin et al., 2016), aimed at better understanding and/or predicting species oc-currence and abundance (e.g. Dormann et al., 2012) or forests dy-namics and functioning (e.g. gap models or Dynamic Global Vegetation Models –DGVMs–, see e.g. Bugmann et al., 2001,Cramer et al., 2001). Available models range from empirical to process-based approaches and from modelling local processes and dynamics up to global vege-tation and general ecosystem models (Fig. 1).
While there is a general agreement about the importance of asses-sing and predicting ecosystem responses to climate change (IPCC, 2014), there are multiple modelling approaches available to understand and predict climate change impacts quantitatively, designed to answer specific questions at different scales and using different data (Fig. 1). The mechanisms and processes limiting model predictions at large geographical scales are under particularly intense debate (see e.g. Mouquet et al., 2015,Franklin et al., 2016,Seidl, 2017). Furthermore, forests are complex socio-ecological systems and predictions can be theory-limited because forest functioning depends on multiple spatial and temporal responses and scales that depend on species composition (García-Valdés et al., 2018, Morin et al., 2018) and may include thresholds or tipping points (Camarero et al., 2015,Reyer et al., 2015, Jump et al., 2017), interactive effects (Scheffer et al., 2001),
phenological responses (Chuine & Régnière, 2017) and adaptation or time-dependent processes (Lloret et al., 2012). A final challenge is the integration of models and data, and in particular the ability to ade-quately parameterise and test models at large spatial scales (Hartig et al., 2012).
A key component to understand and predict forest responses to climate change is the extent, resolution and quality of associated en-vironmental data such as climate, soils or nitrogen deposition. For ex-ample, environmental drivers are often themselves based on model outputs, not only of future predictions but also of past levels. Uncertainty about the future trajectory of the climate system, which largely depends on socio-economic development, can further impact prediction accuracy (Purves & Pacala, 2008,García-Valdés et al., 2018). Moreover, much of the available data on observed impacts is not yet integrated and understood in the wider context of whole-ecosystem functioning. For example, climate change effects on shifting the time of flowering (but seeChuine et al., 2016,Ascoli et al., 2017b), tree mor-tality episodes (Greenwood et al., 2017) or large wildfires (Pausas et al., 2008) have been quantified but they are generally not included in many forest vulnerability assessments.
Impacts of climate change across European forests are occurring at all biological levels of organisation. At the tree level, decreased water availability or temperature stress might induce functional adjustments
Sp
at
ial
ext
en
t
Modelling approach
Correlation Proccesses Lo ca l G loba l R eg iona l Dynamic Global Vegetation Models (Cramer et al., 2001) Correlative SDM(Guisan & Thuiller, 2005)
Yield & growth models
(Skovsgaard & Vanclay, 2008)
Process-based SDM
(Ehlren & Morris, 2015)
Stand scale models (Mäkela, 2000) Landscape models (Shifley et al., 2007) Hybrid models (Salas et al., 2016) ΔTrait SDM (Benito-Garzón et al., 2019) Size-class models
(Michie & Buongiorno, 1984;
Kohyama 1994) Individual based,
patch and gap models
(Bugmann, 2001)
Fig. 1. Existing model approaches to improve our understanding and prediction
of climate change impacts. The models are classified according to spatial scale (local to global) and model type (correlative to process-based), with the posi-tion representing a relative ranking of the model types. SDM: Species Distribution Models. For each model type a review paper is associated if pos-sible (Ehrlén and Morris, 2015;Guisan and Thuiller, 2005;Kohyama, 1994; Michie and Buongiorno, 1984; Salas et al., 2016; Shifley et al., 2017; Skovsgaard and Vanclay, 2007).
in respiration, water-use efficiency, hydraulic conductivity, resource allocation, reproductive efforts or phenology, and root-to-shoot allo-cation patterns (Penuelas et al., 2011,Keenan et al., 2013), which can ultimately influence reproduction, growth and mortality (Lambers et al., 2008). At the population level, plant demography drives forest responses to climate change (Martínez-Vilalta & Lloret, 2016, Ruiz-Benito et al., 2017b) depending on local adaptation to climate (Pedlar & McKenney, 2017;Fréjaville et al., In review). Changes in tree growth and productivity are contingent on ecosystem-type and water avail-ability (e.g. Vayreda et al., 2012, Ruiz-Benito et al., 2014) and in-dividual responses to drought have been linked to long-term species composition changes (Galiano et al., 2013, Martínez-Vilalta & Lloret, 2016). At the ecosystem level heat waves have been shown to have an overall depressing effect on net primary productivity (Ciais et al., 2005, Reichstein et al., 2013). The combination of increased atmospheric CO2, nitrogen deposition, pollution and climate change is also con-sidered a key factor in tree decline and ecosystem level responses (e.g. de Vries et al., 2014). Furthermore, several studies indicate altitudinal and latitudinal shifts in species distribution and functional types across Europe (see Appendix A), attributable in many cases not to climate change alone, but with substantial interactions with herbivory release, secondary succession or forest management (Peñuelas & Boada, 2003, Ruiz-Benito et al., 2017b).
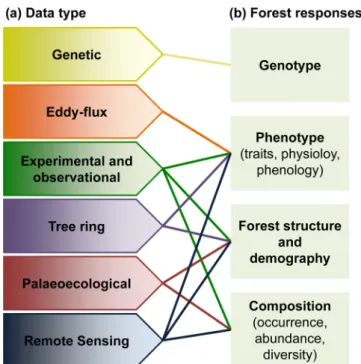
To adequately identify potential risks and to establish future re-search and management priorities the scientific community, govern-ments and other interested parties need well-structured, easily acces-sible and usable empirical data, often at large temporal and spatial scales. Multiple types, levels and sources of data are currently available, which can be harmonised to make compatible and comparable data-bases (GTOS, 1998), and prepare them to be suitable for model-based analyses. The aim of this paper is to support studies predicting forest responses and vulnerability to climate change by assessing the avail-ability and accessibility of harmonised databases of forest functioning and underlying environmental drivers at the European scale. Firstly, based on a literature review, we identified the main types of forest response to climate change and the underlying interacting drivers. Then, based on expert knowledge, we researched the different data types available (genetic, eddy-flux measurement, experimental or ob-servational field-techniques, tree-ring, palaeoecological and remote sensing techniques) to assess their ability to inform about climate change impacts (Fig. 2). Additionally, we highlight the main data gaps and biases to predict climate change impacts on forests across Europe.
2. Availability of data indicating forest responses to climate change
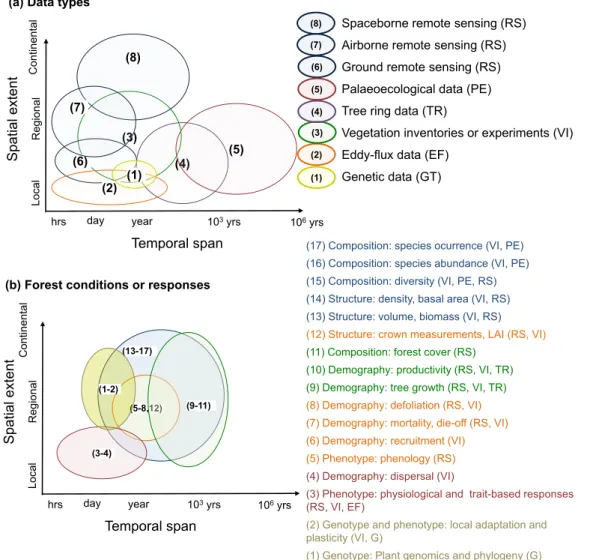
Forest responses to climate change are measured with different survey techniques that cover a range of spatial and temporal scales (see Fig. 3and Appendix B): genetic data show local adaptation to climate over generations; eddy flux measurements provide continuous data on local productivity at 0.5-1 hour resolution up to more than 20 years, vegetation inventories from local to regional scales cover show one -10 year changes across decadal to 100 year time-scale; den-drochronological data at local scales show yearly growth data over up to 5000 years; palaeoecological techniques at local scale cover long temporal scales (millennial data); and remote sensing data (RS) with high temporal and spatial resolution (continental for space-borne re-mote sensing, regional for airborne rere-mote sensing and local for ground based remote sensing,Table 1), over a few years to multiple decades. The availability of these data varies from fully open-access to restricted-access (i.e. where the data is completely available for users or it is only available under request or a licence for a particular project, see Table 1).
2.1. Genetic and phylogenetic diversity, local adaptation and plasticity The capacity for genetic and phylogenetic tree diversity estima-tion is progressing rapidly thanks to ecological genomics (Holliday et al., 2017). The increase in genomic data allow us to understand the association between allelic frequencies and environmental gradients (Fitzpatrick & Keller, 2015). Plant phylogenies are available for a large number of species (see e.g. (Zanne et al., 2014), Appendix B) and it is being used to further estimate phylogenetic diversity at the European scale (van der Plas et al., 2018). In Europe, adaptive genetic responses to climate using SNPs data are only available for a few species (Jaramillo-Correa et al., 2015).
Local adaptation and plasticity are the main sources of
in-traspecific variation and should be considered when evaluating species responses to climate change because within-species ecological re-sponses (abundance, biomass, community composition) are often greater than across species (Des Roches et al., 2018) and predictions of species responses due to climate change can differ when intra-specific variability is taken into account (Moran et al., 2016,Sánchez-Salguero et al., 2018,Benito-Garzón et al., 2019). Phenotypic measurements of fitness-related traits, such as tree diameter, height, phenology, growth and/or survival, from known genotypes at different locations can in-form models about the amount of phenotypic trait variation attribu-table to local adaptation or phenotypic plasticity of populations (Moran et al., 2016). Phenotypic variation has been traditionally measured in common gardens (i.e. genetic trials or provenance tests, see Appendix B) and has been established for most commercial tree species. It pro-vides information about plasticity (i.e. one provenance planted in sev-eral common gardens with different environments) and local adapta-tion of populaadapta-tions (i.e. several provenances planted in one common garden,Savolainen et al., 2013).
2.2. Plant phenotype: physiology, traits and phenology
Physiological parameters have traditionally been measured either
in experimentally controlled conditions or in observational studies where the physiological outputs are highly dependent on environ-mental conditions, species interactions and adaptation mechanisms.
Fig. 2. Relationships between (a) the data that can be used to detect and inform
on (b) the biological levels at which forests may respond as a result of climate change.
Eddy flux measurements and new remote sensing products have the potential to further elucidate plant physiological responses. The Eddy covariance networks are particularly important for quantifying the spatial differences and temporal dynamics in CO2and water vapour exchange across large abiotic and biotic gradients. Estimates of water-use efficiency at large spatial extents and gross primary productivity (GPP) (e.g.Lasslop et al., 2012,Wohlfahrt & Galvagno, 2017) can both be derived from eddy flux data. Meanwhile in many flux observation sites other important biometric measurements, such as soil respiration rates are reported as so-called ancillary data. These additional data allow for a more analytical view on the net fluxes and their partitioning into individual components of the forest carbon cycle, enabling the portioning of ecosystem respiration into heterotrophic and autotrophic components (see e.g. Rodeghiero & Cescatti, 2006, Brændholt et al., 2018). The availability of new space-borne instruments enable mea-suring Sun Induced Chlorophyll Fluorescence (SIF), which offers a more direct link to plant physiology (Dobrowski et al., 2005) and a promising way to quantify gross primary production from space (Grace et al., 2007).
Global phenology and model parameterisation have long been es-timated through Earth Observation methods (e.g.Justice et al., 1985, Ahl et al., 2006,Hmimina et al., 2013,White et al., 2014). Long-term passive optical data from programmes such as AVHRR, Landsat and MODIS (NASA) have been used to quantify decadal forest cover change on a near global scale (e.g.Hansen et al., 2013). Such data have also
been combined with ground measurements to detect climate-driven changes in temperate forest phenology over long time scales (Piao et al., 2006,Keenan et al., 2014) and phenological changes associated with the spread of invasive species (Ramsey et al., 2005). However, data availability about phenological changes is scarce (see Appendix B), and a good understanding or predictive models of phenological responses are critical to further understand climate change consequences (Delpierre et al., 2019).
2.3. Forest demography and structure
Forest demography can be assessed using vegetation inventories,
tree ring data or remote sensing data. Regional, national and con-tinental inventories (see Appendix B) are useful tools to estimate forest demographic processes such as tree growth, mortality and recruitment at the individual tree (Kunstler et al., 2016,Neumann et al., 2017) or plot level (Carnicer et al., 2014,Ruiz-Benito et al., 2017a) at regular intervals (often each c. 10 years). Recruitment data in systematic in-ventories have been successfully harmonised for saplings (height be-tween 30 and 130 cm) across single censuses in Europe (Ruiz-Benito et al., 2017a;van der Plas et al., 2018), but recruitment data contain differential information about tree seedlings. In addition, recruitment data rarely contain time series records, dispersion information or in-dividual tree information required to understand forest responses to climate change. Tree and site level radial growth at longer time spans (13-17)
(3) (6) (a) Data types
Spatial
extent
Temporal span
day year 103yrs 106yrs
Loca l Cont in ental Regi on al (8) hrs (2) (4) (7) (5)
(b) Forest conditions or responses
Spatial
extent
Temporal span
day year 103yrs 106yrs
Loca l Cont in ental Regi on al hrs
Spaceborne remote sensing (RS) Airborne remote sensing (RS) Ground remote sensing (RS) Palaeoecological data (PE) Tree ring data (TR)
Vegetation inventories or experiments (VI) Eddy-flux data (EF)
Genetic data (GT) (8) (7) (6) (2) (3)
(17) Composition: species ocurrence (VI, PE) (16) Composition: species abundance (VI, PE) (15) Composition: diversity (VI, PE, RS) (14) Structure: density, basal area (VI, RS) (13) Structure: volume, biomass (VI, RS)
(12) Structure: crown measurements, LAI (RS, VI)
(11) Composition: forest cover (RS) (10) Demography: productivity (RS, VI, TR) (9) Demography: tree growth (RS, VI, TR)
(8) Demography: defoliation (RS, VI) (7) Demography: mortality, die-off (RS, VI) (6) Demography: recruitment (VI) (5) Phenotype: phenology (RS) (4) Demography: dispersal (VI)
(3) Phenotype: physiological and trait-based responses (RS, VI, EF)
(2) Genotype and phenotype: local adaptation and plasticity (VI, G)
(1) Genotype: Plant genomics and phylogeny (G)
(1) (4) (5) (1) (5-8,12) (9-11) (3-4) (1-2)
Fig. 3. Harmonised picture of (a) data types and (b) forest conditions or responses to climate change depending on the spatial extent at which it is generally gathered
(from local to regional and continental) and temporal span (i.e. from days up to 106years), modified fromHartig et al. (2012). The position of the data type and forest
and annual time steps can be obtained from tree ring and remote sen-sing data, which allow retrospective and prospective characterisations of forest responses, including forest resistance and resilience to short-and long-term climatic changes (Briffa et al., 1998, Anderegg et al., 2015, Gazol et al., 2018). Re-surveyed plots from airborne remote sensing allow for monitoring of structural dynamics such as forest growth (Yu et al., 2004) and large surveys can determine stand suc-cessional stage (Falkowski et al., 2009). At stand level remote sensing allow also capturing long-term canopy defoliation and tree mortality (Senf et al., 2018) (Table 1).
Forest structure can be characterised by density, basal area, volume, biomass or crown metrics at tree or plot level, obtained from
vegetation inventories or remote sensing data (Fig. 3,Table 1). Sys-tematic vegetation inventories generally measure tree level diameter / height, allowing a direct calculation of plot level basal area or tree density and indirect volume or biomass estimates through the appli-cation of species-specific allometric equations (Montero et al., 2005, Zianis et al., 2005,Annighöfer et al., 2016). Some National Forest In-ventories measure the position of each tree within a plot enabling the calculation of distance-dependent competition indices and tree-to-tree interactions (Gómez-Aparicio et al., 2011, Kunstler et al., 2016), al-though small plots can lead to biased predictions (Hynynen & Ojansuu, 2003). Tree height and diameter are common inventory variables that can also be obtained from airborne LiDAR and ground-based remote
sensing with higher accuracy than inventory based calculations (Zolkos et al., 2013). LiDAR can provide sub-metre accuracy of surface heights (Lefsky et al., 2002,Lee et al., 2010), although accuracy can vary with canopy height and distribution (Hopkinson & Chasmer, 2009), ground slope (Breidenbach et al., 2008) and sampling intensity (Hyyppä et al., 2000). Low point density data can be used to calculate stem density, vertical foliage profile (Coops et al., 2007) and basal area (Lee & Lucas, 2007), and is a promising method for above ground biomass mea-surement (Lefsky et al., 2002,Mascaro et al., 2011,Simonson et al., 2016). There is enormous potential to develop large spatial and tem-poral scale datasets when combining these different data types, e.g. the spatially continuous height, age, biomass and carbon information de-rived from NFI and MODIS data (Mäkisara et al., 2016,Moreno et al., 2017).
Biomass or wood volume can be estimated at the global scale from
space-borne remote sensing as passive microwave data (Liu et al., 2015), passive optical data (e.g. from Landsat:Avitabile et al., 2012), and SAR data from L-band (Mitchard et al., 2011) and C-band instru-ments (Santoro et al., 2010), but the latter methods typically require calibration using ground data (Rodríguez-Veiga et al., 2017). SAR biomass estimates are calculated using backscatter coefficients related to wood volume scattering mechanisms and/or allometry using height estimates derived through polarimetric interferometry (PolInSAR; Mette et al., 2004; (Le Toan et al., 2011). Space borne LiDAR (ICESat Table 1
Data types available to inform about climate change impacts on forest functioning (see a complete list of each dataset including accessibility in Appendix B). Data type
(specific measurement methods or examples) Forest response type(indicator) Spatial & temporalresolution Extent (max. res) Span (step)
Availability & accessibility (strengths & challenges use)
Genetic data
(Genetic diversity and structure, common gardens and provenance trials, reciprocal transplant performance)
Genotype, phenotype and composition (genetic or phylogenetic diversity, local adaptation, plasticity)
Regional to global
(species ranges) From open- to restricted-access
Eddy flux data Phenotype and drivers
(carbon, water and energy fluxes; meteorological drivers and ecosystem state variables) Global (specific sites) Since 90s (hours) Open-access
(immediate forest responses to CC, inter-site comparison across vegetation types, sensitivity to climate factors, global synthesis studies)
Systematic vegetation inventories (Regional, national or continental forest inventories, Long-term Research Networks)
Demography, structure and composition (Tree demography and wood/defoliation, forest structure, species occurrence or abundance; species or functional diversity)
Regional-National-European (1 km or lower) Since 80 s (up to decadal)
From open- to restricted-access
(Data integration and management, no individual information of e.g. species-specific allometric equations or trait information)
Other vegetation inventories or experiments
(Field-based or experimental data)
Phenotype, demography, structure and composition
(traits, tree demography and wood/ defoliation, forest structure, species occurrence or abundance; species or functional diversity)
Regional-National-European (1 km or lower) Since 80 s (up to decadal)
From open- to restricted-access (Data integration and management)
Tree ring data
(Tree growth or wood density) Demography and phenotype(tree radial growth; wood density) Global (stand)50-1000 yrs (year-season)
Open-access
(No large-scale coverage, stand and/or tree characteristics often missing)
Palaeoecological data
(Pollen or Macrofossil data) Structure and composition (occurrence,species and functional group diversity, forest cover and change)
Global (stand) 21,000 yrs. ago-present (Multi-decadal to millennial) Open-access
(Insights into past periods of abrupt climate change; multi-centennial timescale relevant for forest ecosystems; uneven spatial occurrence, sometimes quite localised; no large-scale spatial coverage at high resolution, relatively low time resolution)
Ground RS
(Terrestrial laser scanning, leaf spestoscopy)
Structure
(height, dbh, biomass, fine-scale crown metrics and canopy gaps)
Local (cm - ha) Since 00 s (NA to decadal)
Restricted access, highly localised, no large-scale databases available
(Easy sampling of fine spatial explicit measurements, require fieldwork and data processing)
Airborne RS
(Photogaphy, optical, LiDAR SAR)
Structure
(canopy and sub-canopy including height, biomass, crown metrics)
Local-Regional-National (cm) Since 00 s (NA to decadal)
From open- to restricted access, highly localised (Detailed structural data, require data processing) Space-borne RS*
(Landsat, AVHR; MODIS, SPOT, RADARSAT,
ALOS PALSAR, SENTINEL)
Demography, structure and composition (forest cover/area, biomass, LAI, spectral diversity or phenology (NDVI, EVI), productivity)
Global-continental (30 - 10 m) Since 80-90s (day-month)
Open-access (Computational challenges in interpreting the data and integrating them with existing ground data at different scales)
GLAS) has been used to quantify biomass at the global scale (Simard et al., 2011) and Popescu et al. (2011) suggest close correlations to airborne equivalents. The use of SAR for forest monitoring is likely to increase with the missions expected over the next decade (e.g. BIO-MASS, NISAR and SAOCOM-1).
Space-borne remote sensing data provide long-term and large-scale information about crown structure as the leaf area index (LAI). LAI is the projected leaf area relative to ground area (m2m-2) and is a good proxy of plant response to water availability (Jump et al., 2017). Sa-tellite-derived LAI is generated with multispectral remote sensing re-flectance data (Garrigues et al., 2008). Long-term products are available at global scale with spatial resolution of 500 m or greater and temporal resolution from 8 days to 1 month (see Appendix B) as CYCLOPES (derived from SPOT,Baret et al., 2007), GlobCarbon (derived from ERS, ENVISAT and SPOT, Deng et al., 2006, Plummer et al., 2007), and MODIS Leaf Area Index product (Knyazikhin et al., 1998,Yang et al., 2006).
Crown metrics can be estimated using airborne LiDAR with
dis-crete return and high point density data (∼ 8-20 points m-2(Wu et al., 2016), as crown volume (Korhonen et al., 2013), vertical crown length (Lee et al., 2010), crown diameter (Morsdorf et al., 2004) and crown cover (Lee & Lucas, 2007). Full waveform LiDAR data can describe canopy vertical structural complexity (Nie et al., 2017), including un-derstory characterisation (Hancock et al., 2017), crown morphology (Lindberg et al., 2012) and height (Anderson-Teixeira et al., 2015). A key parameter in many vegetation models, LiDAR derived LAI may be calculated using metrics of canopy structure, percentage canopy hits (Riaño et al., 2004) and radiative transfer models (Tang et al., 2012). This approach avoids the saturation issue inherent in passive optical estimates (Peduzzi et al., 2012) and has been found to be more accurate than passive optical equivalents derived from MODIS data (Jensen et al., 2011) and the GLOBCARBON product (Zhao & Popescu, 2009). Airborne SAR systems have the capacity to measure similar structural properties as LiDAR given their sensitivity to complex forest structure (Lausch et al., 2017). Both correlative (Balzter et al., 2007) and phy-sically-based approaches (Ningthoujam et al., 2016a) have been used to extract wood volume and vegetation height through interferometry (Neumann et al., 2012). To date, SAR has quantified AGB, LAI (Peduzzi et al., 2012), forest cover (Ningthoujam et al., 2016b) and tree height (Ningthoujam et al., 2016a). Unfortunately, currently there is little open-access airborne SAR data available (see Appendix B).
Fine scale spatially explicit crown metrics of stems and branches,
as e.g. biomass or packing (Palace et al., 2016), are not captured by traditional vegetation inventories. Terrestrial laser scanning (TLS) of-fers an efficient and accurate alternative to measure fine-scale forest attributes (Seidel et al., 2015,Srinivasan et al., 2015) such as height (Srinivasan et al., 2015), diameter (Kankare et al., 2013), biomass (Yu et al., 2013, Calders et al., 2015), canopy characteristics including crown width (Metz et al., 2013,Srinivasan et al., 2015) and canopy gaps (Seidel et al., 2015). TLS is filling the gap between tree scale manual measurements and large-scale airborne LiDAR scanning (Srinivasan et al., 2015), allowing upscaling airborne LiDAR measure-ments (Hancock et al., 2017). However, TLS data is available locally because it requires specific fieldwork and the management of a high volume of data.
2.4. Species or functional occurrence, abundance and diversity
Species or functional type occurrence and abundance data can
be calculated from data generally available in vegetation inventories, palaeoecological or remote sensing data. Data on actual species dis-tribution in Europe tends to come from individual field-based ob-servations (e.g. the worldwide database GBIF) and current knowledge (e.g. EUFORGEN or European maps from JRC, see a complete list in
Appendix B). The systematic information from NFIs, gathered at re-gional or national level, and International Co-operative Programme on Assessment and Monitoring of Air Pollution Effects on Forests (ICP forests gathered at European level) provides large-scale and long-term information about the state of forests (Appendix B). Systematic vege-tation inventories provide detailed information on tree species occur-rence and abundance (generally through basal area or density mea-surements) with a good spatial coverage within Europe across biomes but over a relatively short time span (see Appendix B and (Mauri et al., 2017). Long-term changes in species occurrence and abundance in re-sponse to environmental variability can be assessed through fossil pollen and plant macrofossils data (Morales-Molino et al., 2017b). Despite the uneven spatial distribution and the relatively low taxo-nomic and spatial/temporal resolution of palaoecological data, the long time-span they usually cover allows to assess ecosystem dynamics during past periods of abrupt climate change (seeTable 1), like the Younger Dryas-Holocene transition (rapid and marked warming dated c. 11700 years ago) or the 8.2 ka event (abrupt cooling centered at c. 8200 years ago). For instance, fossil pollen data have been successfully used to document changes in the distribution and abundance of the main plant genera of European vegetation over the last 15,000 years (Giesecke et al., 2017). Similarly, plant macrofossils represent an in-teresting proxy to infer past distribution ranges as they often allow more precise plant identifications (even to species level) than pollen. Plant macrofossils are unequivocal indicators for past plant local pre-sence due to their limited dispersal and are often directly dated there-fore reducing uncertainty about their age (Birks & Birks, 2000). When reliable age estimates based on radiocarbon dates on terrestrial plant macrofossils and robust age-depth models are available, palaeoecolo-gical data allow accurate assessments on the responses of forest species to past climate changes, which can in turn be used to validate projected vegetation responses to future climate change.
Diversity metrics can be calculated from systematic vegetation
inventories including tree and shrub richness, functional types or even functional or phylogenetic measurements when merged with trait/ phylogenetic data (Ruiz-Benito et al., 2017a) or specific field-based trait measurements (Vilà-Cabrera et al., 2015). Plant trait information and plant phylogeny is available for a large number of plants (see e.g. the TRY database, try-db.org,Kattge et al., 2011orZanne et al., 2014, Appendix B) and it is being used to further estimate functional or phylogenetic diversity (Paquette & Messier, 2011).
Tree species diversity is not directly available from medium-re-solution open-access Earth Observation data such as Landsat or MODIS. However, several studies have demonstrated the potential for pre-dicting species richness and diversity from satellite-derived land cover and landscape complexity (e.g. Honnay et al., 2003, Hernandez-Stefanoni & Ponce-Hernandez, 2004, Ma et al., 2019), leaf traits (Moreno-Martínez et al., 2018), or link species composition with forest dynamics (Huesca et al., 2015). Other studies have used the Spectral Variation Hypothesis, which links spectral heterogeneity in the re-flectance signal to environmental heterogeneity and therefore species diversity (Gould, 2000, Palmer et al., 2002, Rocchini et al., 2007, Rocchini et al., 2016). Fine spatial resolution imagery has been used to identify tree species within forest ecosystems using classification ap-proaches as e.g. combination of LiDAR with Pleiades data (e.g. Blázquez-Casado et al., 2019), IKONOS (Carleer & Wolff, 2004, Dahdouh-Guebas et al., 2004) or QuickBird (Neukermans et al., 2008), but such data are usually complex to analyse or costly to obtain, lim-iting their use for mapping diversity at a regional or continental scale. Furthermore, structural and topographical information derived from airborne LiDAR can also provide information on tree species richness (Simonson et al., 2012,Hernández-Stefanoni et al., 2014,Lopatin et al., 2016,Vaglio Laurin et al., 2016).
3. Availability and accessibility of harmonised data at the European level
3.1. Forest responses
Harmonised data on forest conditions is available in multiple global and European scale databases (see Appendix B and a summary in Table 3) and range from open- to restricted-access (Table 2). For open-access databases citation and acknowledgment is usually mandatory. For more restricted datasets, the data managers or contributors can request authorship as a prerequisite for access (e.g. some harmonised NFI databases, common garden experiments,Table 2). Harmonised data at the European extent is generally of high quality, i.e. well-structured and documented. In some cases, data use does not require a high degree of expertise (e.g. processed or combined remote sensing products), but it requires managing large volumes of data. In others the use of data requires a medium-high degree of expertise as e.g. when managing unprocessed inventory data, tree ring or palaeoecological data (Table 2).
The data products of individual observational or experimental stu-dies are increasingly being published online thanks to research net-works, public repositories and more recently data-papers gaining
increasing attraction. However, whether scientific data should be freely-accessible is under an intense debate (Gewin, 2016) and often there is a low replicability, even in journals with an established data policy (Stodden et al., 2018). Data available and accessible at European level in data repositories or specific harmonisation initiatives cover many different data types such as trait information (e.g. TRY database, Kattge et al., 2011), plant growth-related experimental responses to environment (i.e. Meta-phenomics,Poorter et al., 2016), trait variation from common gardens or provenance tests (Robson et al., 2018, Vizcaíno-Palomar et al., 2019), provenance regions (12 tree species, SIG-Forest), seed masting (MASTREE,Ascoli et al., 2017a), biomass and plant allometry (BADD,Falster et al., 2015), forest conditions and de-mography (ICP forests,UNECE & ICP Forests Programme Co-ordinating Centre, 2016) and long-term experiments/observational data in regions of Europe including a large number of forest indicators (see ForestGEO, DEIMS or NOLTFOX, Appendix B).
Data harmonisation must include data standardisation protocols and specifically informing about data strengths and limitations (see Meyer et al., 2016for data of species occurrence,Franklin et al., 2017). The main data strengths identified were taxonomic, spatial and tem-poral coverage, systematic data sampling and error identification and control (Table 2). The main data limitations were taxonomic, spatial or Table 2
Harmonised databases of forest responses at European extent. For each database we included the main data type ((a) genetic, (b) eddy flux, (c) vegetation inventories and experiments, (d) tree ring, (e) palaeoecological, and (f) remote sensing data), the accessibility (O: open-access, R: restricted-access) and attribution (A: if authorship can be requested/required). We show the main potential data limitations in the harmonised databases; and data availability, accessibility or attribution issues.
Database1 Indicator
(Data type) Data strengths
2 Data limitations3
TreeGenes, Hardwood genomic data,
Genbank(a), O-R, A Genetic diversity or sequences(Genetic data) - Multisource uncertainty Benito-Garzón et al., 2018, Robson et al.,
2018, Vizcaino-Palomar et al., 2019, GnpIS, GENFORED, BeechCOSTe52 (a), O-R
Phenotypic plasticity and adaptation (Genetic conservation units, genetic entries, common gardens, provenance regions)
- Taxonomic coverage (data not available for many
species) Meta-phenomics database(c), R Phenotypic plasticity and adaptation
(plant growth and performance) - Taxonomic and spatial coverage (data not availablefor all species and all climatic conditions) FLUXNET, CARBOEurope
European Fluxes Database, and emerging ICOS carbon portal(b), O
Carbon, water and energy fluxes
(flux measurements) Temporal and spatial coverage(standardised quality checked from more 600 towers since 80 s comparable across time and sites)
Spatial coverage (localised sites)
GBIF, Euforgen, AFE, EFI Tree species
map, TSDE, EVA, sPLOT, GFBI(c),O-R Species occurrence or abundance(vegetation inventories) Spatial coverage(high resolution) Temporal and spatial uncertainty (variable inputdata e.g. GBIF) TRY database(c)4, O-R, A Functional traits
(field or experimental data) Error identification and control Temporal uncertainty and coverage, multi-sourceeffects (multiple input data) ICP forest(c), R Forest demography and structure,
some plant traits (vegetation inventories)
Temporal coverage (available since 80 s comparable across time and sites), systematic sampling at European level
Sampling effects (underrepresentation of extreme events)
National Forest Inventory harmonised (e.g. Occurrence data, GFBI, FUNDIV data)(c), O-R, A
Demography, forest structure, species occurrence and abundance, species diversity
(vegetation inventories)
Systematic sampling at national
level Temporal coverage (available since 80 s but multipleinventories rarely harmonised), sampling effects (plot and time-intervals dependent on countries, under-representation of large trees and extreme responses)
International Tree-Ring Data Bank
(ITRDB)(d), FO Tree radial growth(tree ring data) Temporal coverage (up to century) Multisource effects (metadata improvementsregarding tree size, age and site data) and sampling effects (mostly dominant and climate-sensitive trees sampled, individual and mean series of several trees), European Pollen Database (EPD),
Neotoma Paleoecology database(e), O Long-term vegetation distribution anddiversity (palaeoecological data)
Temporal coverage (up to
millennia) Spatial coverage (limited sites), multisource(different time intervals) and sampling effects (under-representation of extreme responses) CORINE Land Cover, PALSAR and JRC
forest maps, ESI Forest Map, JRC Forest Biomass increment, GLOBBIOMASS(f), O
Forest cover/area, biomass increment, habitat cover, forest change, carbon storage
(remote sensing)
Spatial coverage
(high resolution) Temporal coverage (short time span)
1See details of the database regarding output; spatial and temporal scale; data availability and accessibility; websites and citations in Appendix S2.
2All data is at least available at European extent. We classified data strengths as taxonomic, spatial and temporal coverage, systematic data sampling, error
identification and control.
3We classified data limitations as taxonomic, spatial and temporal uncertainty; taxonomic, spatial and temporal coverage; multisource or sampling effects. 4Other trait databases area available and open-access generally for specific groups of traits or regions.
temporal uncertainty (i.e. ambiguous taxonomic data, spatial location or time since data collection, respectively); taxonomic, spatial or tem-poral coverage; multisource effects (i.e. different sampling techniques in input data such as plot size or sampling dates); or sampling effects (i.e. observation or measurement errors and over- or under-re-presentation bias, seeTable 2).
Genetic diversity (e.g. allelic frequency) data is not harmonised at the European level (but see Genbank database for specific queries of genes in plants,Table 2, Appendix B) and to our knowledge this type of data has not been used to study large-scale forest responses to climate (but seeJaramillo-Correa et al., 2015). However, the improvements in the next-generation of sequencing technologies is increasing the avail-ability of open-access databases ((Neale & Kremer, 2011), Table 3, Appendix B). Despite evidence that genotypes respond differently to climate change across the range of the species (e.g.Matías et al., 2017) it can be difficult to measure genetic diversity and to incorporate it in predictive models of climate change effects (Kramer et al., 2010). For example, neutral diversity does not show direct effects of genetic var-iation on fitness and, therefore, it is not informative about the adap-tative or evolutionary potential of the species (Holderegger et al., 2006). However, common gardens and provenance trials are an im-portant source of knowledge on the effects of intra-specific genetic and phenotypic variation on species response to different climates (Savolainen et al., 2013). Data harmonisation is not homogeneous for all data sources and the planting sites often do not include the entire distribution range of a given species (but see compilations for Pinus pinea L., Pinus pinaster Ait., Pinus nigra Arnold., Abies alba Mill. and Fagus sylvatica L., (Benito-Garzón et al., 2018, Robson et al., 2018, Vizcaíno-Palomar et al., 2019)).
Eddy flux measurement networks are established on almost all continents (e.g. ASIAFLUX, AMERIFLUX, OZFLUX, EUROFLUX) with FLUXNET as a global network of networks with long-term research infrastructures (Papale et al., 2012). Therefore, long-term harmonised high-quality data are available at both the global and European level (Table 2), providing detailed and standardised temporal information for specific towers across Europe (Aubinet et al., 2012). Further metho-dological standardisation is emerging in new American (NEON) and European (ICOS) research infrastructures (Franz et al., 2018).
The availability and accessibility of vegetation inventories depend on the database owner, varying from systematic vegetation inventories (e.g. NFI or ICP forests) to specific databases from research network or data-papers (see Appendix B). Several initiatives to harmonise NFIs are being undertaken, including COST Actions (Tomppo et al., 2010), European projects such as e.g. BACCARA (http://www.baccara-project.
eu/), FunDivEUROPE (http://www.fundiveurope.eu/, Baeten et al., 2013) or DIABOLO (http://diabolo-project.eu/), and European Net-works such as ENFIN (http://www.enfin.info/) or global Initiatives (GFBI, https://www.gfbinitiative.org). NFI data can be open- or re-stricted-access at country level but the data require error identification and harmonisation considerations (e.g. minimum tree size or basal area, management, (Ratcliffe et al., 2016)) and harmonisation of het-erogeneous databases as country-level NFIs should include standardi-sation steps to the final outputs. Harmonistandardi-sation initiatives are resulting in the availability of NFI data at the European level, such as species occurrence (Mauri et al., 2017) or forest structure (Moreno et al., 2017). ICP plots include information about biodiversity and the health and vitality of forests, for example canopy affectation by defoliation or/ and climate change interactions with other air pollutants (de Vries et al., 2014,UNECE & ICP Forests Programme Co-ordinating Centre, 2016). The main data limitations are based on the temporal coverage of the data (available since the 1980s) and the importance of under-standing the knowledge any sampling effects that might include the underrepresentation of large trees, differential plot sizes and time in-tervals.
Tree ring data are harmonised at global scale by NOAA’s “International Tree Ring Data Bank” (ITRDB,Table 2and Appendix B). The ITRDB provides long-term growth information (usually tree-ring widths but also tree-ring density data) at tree, stand and species levels that can be freely downloaded. However, most of the ITRDB data refer to classical dendrochronological data, i.e. cross-dated tree-ring series obtained from 10-20 dominant and climatically sensitive trees of the same species living in the same site, stand or tree population; often at climate-sensitive sites. Usually, authors analyse a chronology or mean series of the individual tree series from the same site. Certain con-siderations or data treatment is required to estimate climate impacts on the entire forest. First, the spatial and ecological extent of the chron-ologies is generally vague, because the size of the site is rarely defined (e.g. 0.5-1 ha). Second, sampling is often biased towards dominant big trees of similar age classes, from harsh sites where climate is the major constraint of radial growth, which can lead to biased estimates of forest productivity and carbon uptake. Third, there is an urgent requirement for better metadata for future tree-ring series to be uploaded to the ITRDB. For instance, tree size (d.b.h.) and age are rarely reported and stand information as basal area or tree density is usually lacking, but they are required to obtain useful estimates of radial growth (e.g. basal area increment) and carbon fixation from the tree ring data. Tree-ring data from tropical forests are scarce at the ITRDB (partially due to the inherent difficulty of ring formation and cross-dating in these tropical Table 3
Data availability of environmental drivers across Europe. See a complete list of each dataset including accessibility in Appendix B. The accessibility is open-access upon citation and acknowledgement.
Data type Example
Databases Information Spatialresolution:
Extent (max. res)
Temporal resolution Challenges
Climate Wordclim, CRU, NOAA, E-OBS,
CHELSA, EuMedClim
Temperature and precipitation variables. Mean, annual & monthly data
EU
(30’’) Current andscenarios for past/ future climate
Temporal data for the 20thcentury and climate scenarios (e.g. monthly-yearly) at fine spatial resolution (e.g. 1 km or lower) Atmospheric
deposition NOAA, IAC, WebDab CO2concentrationand greenhouse gases EU level(0.1º) 50s-present No spatial resolution in data Digital Elevation Model GTOP30 Altitude, slope, orientation,
insolation Global-Europe(2 m2) -
-Soils SoilGrid
ESDA Soil attributes andclassification Global-Europe(1 km2) - Extract meaningful information for forestresponses Disturbances EFFIS, DFDE, EDP, EASIN Area/perimeter burnt, pest,
pathogens, exotic species Europe-regional (0.25º)
Variable No temporal information (only in remote sensing derived products)
Policy – management CCDA, historical management and suitability for management
Protected sites, recent
sites), but ITRDB data have been successfully used in global analyses (e.g.Anderegg et al., 2015).
Palaeoecological data at the European level are harmonised in the Neotoma Paleoecology Database (Neotoma) and the European Pollen Database (also accessible via Neotoma, see Appendix B). The main data-limitations relate to the spatial coverage (uneven distribution of sites across Europe), multisource and sampling effects (i.e. time interval can differ between sampling sites). Neotoma and the EPD are open-access standardized databases of published palaecological records to foster broad-scale (global or continental-scale) vegetation and land-use his-tory studies (Williams et al., 2018). Pollen-data can sometimes be dif-ficult to use because: (1) Several plant species produce the same pollen type, which limits the estimation of plant diversity or specific species presence, but for woody taxa taxonomic resolution is usually high (except for most European deciduous oaks that cannot be distinguished by their pollen); (2) non-uniform representativeness of pollen dis-tribution for vegetation disdis-tribution due to species-specific differences in pollen production, dispersal, deposition and preservation (e.g. ane-mophilous tree species with high pollen production and dispersal ability as e.g. Pinus sp. are often overrepresented, Broström et al., 2008). This bias can be corrected by using empirical species-specific pollen productivity estimates (PPEs, (Pearman et al., 2008)); (3) pollen records mostly reflect vegetation structure and composition in an area whose size depends on the site and surface type (usually lakes and mires, (Sugita, 1994)). Macrofossil records are less abundant than pollen sequences in Europe, especially in the Mediterranean region. Similarly, macrofossil data availability is still limited compared with pollen data (see Neotoma, Appendix B) and most sequences are pub-lished as papers in specialised journals (e.g. Birks, 2003, Tinner & Kaltenrieder, 2005).
The availability of remote sensing information is vastly increasing thanks to recent technical advances (Kennedy et al., 2014) but sig-nificant challenges remain to select, process and interpret data provided in order to make them easily usable for forest assessment and man-agement (Table 2). Processed and combined products are now widely available and offer a great opportunity for use at European scale (Table 2), with the temporal coverage dependent on the specific plat-form and product (Appendix B). There is an increasing amount of open-access large-scale airborne LiDAR data across Europe (generally at re-gional scale) and the recently launched GEDI Mission will provide global coverage of spaceborne LiDAR (though over a relative short duration, Appendix B). TLS has the potential to move forward forest inventory datasets by providing new structural measurements at fine spatial scales (Liang et al., 2016,White et al., 2016) as well as new means to determine uncertainty of forest properties quantified by spaceborne and airborne methods.
3.2. Environmental data
Climate databases at European or global levels differ in spatio-temporal resolution and extent. Mean climatic conditions for the 20th century are often directly available at high spatial resolution and at global or European scales from databases such as Worldclim, E-OBS, Chelsa, Climatic Research Unit (CRU, seeTable 3and Appendix B) ei-ther for a certain period (e.g. WordClim data provide mean values for 1970-2000) or even monthly values for each year (e.g. E-OBS, CRU-TS, CRU-CL or CRU-SR, Appendix B). Temporal data on past temperature and precipitation (i.e. daily, monthly or yearly records) are available at the global and European level (e.g. CRU and E-OBS, respectively). There are new databases that combine the spatial resolution of WorldClim (1 km2) with the temporal resolution of CRU (1901 - 2014) (Fréjaville & Benito Garzón, 2018), and European climate data has been downscaled at 1 km2for large temporal frameworks (i.e. 1951-2012, seeMoreno & Hasenauer, 2016). There is also an R packags available to interpolate and downscale coarse climate data and obtain daily weather variables at landscape level (meteoland,De Caceres et al., 2018). Past
climatic data can be used to calculate changes in climate (i.e. climatic anomalies based in annual data, e.g.Ruiz-Benito et al., 2014). Drought effects are derived from climatic databases that are available at detailed spatial and/or temporal resolution (e.g. precipitation and drought in-dices; see Appendix B). Climatic data for future scenarios are available globally and bias-adjusted from the Intersectoral Impact Model Com-parison Project (ISIMIP,Frieler et al., 2017) and for Europe at different spatial resolutions from the EURO-CORDEX (https://www.hzg.de/ms/ euro-cordex/) to CRU database or Wordclim (see Appendix B).
Other environmental drivers include topographic information (e.g. elevation, slope and aspect), soil classification and properties, dis-turbance and management information, atmospheric nitrogen or sul-phur deposition and CO2concentrations, etc. Topographic information can be easily obtained from digital elevation models at different re-solutions (e.g. from 2 m2 to 1 km2, Table 3). The Soil Grid dataset (https://soilgrids.org/) provides global information about site char-acteristics, physical and chemical properties (Appendix B). European Soils Data Centre (ESDC) and ISRIC World Soil Information provide a wealth of soil science information, and the FAO a global soil organic carbon map, which is mostly open-access and directly downloadable at 1 km2(Appendix B). In addition to soil property and quality datasets, the ESDC hosts information on different soil functions and threats to soil functioning. Soil water content, temperature and snowpack has been estimated from 1979 to 2010 in the ERA-INTERIM/Land at a re-solution of 0.125° (Balsamo et al., 2015) and soil organic carbon is mapped at 1 km2 resolution in the Global Soil Organic Carbon Map (Appendix B). However, potential drivers of forest responses to climate change as soil fertility or water retention (Wardle et al., 2008) is not easily accessible at detailed resolution for the European extent.
Disturbances such as fires, pests or pathogens are major drivers of forest vulnerability that can strongly interact with climate change (e.g. Pausas & Keeley, 2009). Palaeoecological records often include char-coal data to reconstruct changes in fire activity through long timescales, which can be freely accessed and downloaded from the Global Charcoal Database (GCD; Power et al., 2010) and Neotoma (Williams et al., 2018). The Database of Forest Disturbances in Europe (DFDE; Appendix B) provides historical data on abiotic (i.e. wind and snow damage) and biotic (pathogens and insects) disturbance agents. DFDE has been used at the country-scale to empirically parameterise landscape models to predict future disturbance levels under different climate change sce-narios (Seidl et al., 2014). European initiatives to record and dis-seminate forest disturbance information include the EFI database, European Forest Fire Information System (EU-EFFIS) and the European Storms Catalogue (Appendix B). However, there is a considerable lack of geo-referenced data on pest and alien species in European forests and they are poorly linked to other databases on forest health such as ICP forests. Some initiatives involving citizen science are providing geor-eferenced data of forest pests at regional levels (e.g. http://www. alertaforestal.com/es/). The European Network of Alien Species (EASIN) provides access to records of alien species in Europe, via a mapping tool and a geo-referenced database of published scientific reports (EASIN-lit; Appendix B), although there are few records re-garding forest ecosystems.
Data availability on forest management practices across Europe is limited because it is difficult to assign a management system to a forest stand based on signs of its recent management; long-term historical records are essential, but they are largely missing across most of Europe. NFIs are a valuable source of information on recent forest management but harmonising the descriptions across countries will remain challenging until a common classification system is used. The scarce information about management in vegetation inventories has generally led to harmonisation as a binary indicator field (managed or unmanaged), which provides only minimal information to aid in the understanding of forest responses to management (see e.g. Vayreda et al., 2012). The Natura 2000 and Nationally Designated Areas (CDDA; see Appendix B) initiatives provide spatial information on the protected
sites at the European level. These datasets cannot be used to infer the development of a particular management activity, but they could be used as an indication of different forest policy and management ob-jectives. Given the limited availability of management information, historical reconstruction maps (e.g.McGrath et al., 2015), forest man-agement simulators (Härkönen et al., 2019) and the Forest Management Map of European Forests (Hengeveld et al., 2012) assesses the suit-ability of different forest management practices based on biotic, abiotic, and socioeconomic factors, which provide useful information for the development and assessment of management on forest resource models. 3.2.1. Considerations for harmonised data use in modelling forest responses to climate change
Harmonised and quality-controlled data at the European scale are needed for robust assessments of forest responses to climate change (Serra-Diaz et al., 2018;Reyer et al., 2019). We have demonstrated that data availability at the European extent has increased in the last few decades for a multitude of forest properties ranging from genetics to demography, forest structure and occurrence/abundance (Table 2) as well as for the potential interacting drivers of climate change (Table 3). We have also identified many open and semi-restricted databases across Europe, which will facilitate future integrative research on forest re-sponses to climate change using multiple data sources.
We found several limitations that should be considered when de-veloping models and frameworks based on the databases presented here, relating to spatial and temporal coverage and the effects of using multisource data and data with different sampling methodologies. Firstly, for specific forest properties data are not publicly available at high resolution or for many European species, particularly for in-traspecific trait variability, adaptation and phenotypic variation, and physiological and dispersal responses. Secondly, the temporal coverage of key responses to climate change such as defoliation, mortality and recruitment is short (e.g. the main sources are vegetation inventories, which are only available since the 1980s). In addition, there are sam-pling issues such as the under-representation of big trees, no individual or harmonised data of tree recruitment and extreme responses might be under-represented when permanent plots of forest inventories are used. Thirdly, long-term data are available for forest cover and tree growth, but researchers should be aware of data limitations regarding spatial coverage (i.e. generally localised data) and sampling effects (e.g. se-lection of sensitive species/sites for study). The main limitations re-garding underlying drivers of forest responses to climate change that we identified are the availability of meaningful and detailed soil informa-tion, long-term data about disturbances and forest management and legacy effects on forest functioning. Finally, most of the databases cannot deliver cause-effect mechanisms except emerging ecosystem
experiments (see e.g. meta-phenomics database, Appendix B) and plant responses can differ in field-conditions (Poorter et al., 2016).
The lack of data on key mechanisms of forest responses to climate change either at high spatial resolution or long temporal span at the European scale can strongly hamper modelling of forest tree responses to climate change (Table 4). Local adaptation or physiological data at high spatial resolution is missing at large spatial scales and detailed resolution, but several efforts are being made to integrate available data such as ecological genomics to climate change predictions (Fitzpatrick & Keller, 2015) showing less alarming responses (Benito-Garzón et al., 2019). Process-based models require a wide range of data to adequately parameterise and evaluate them, ideally consisting of a mix of stand or ecosystem conditions (e.g. stand structure, species abundance) and specific mechanisms or processes (e.g. photosynthesis data required in DGVM models, which ideally should come from controlled experiments, seeHartig et al., 2012). In many cases, process-based models require large numbers of parameters of physiological responses to climate, but these values are often known only for special cases (Mäkelä et al., 2000), or processes formulated for one region cannot be extrapolated to other climates or larger extents (Morales et al., 2005). Detailed phy-siological, structural and ecosystem data are being gathered but rarely on the same plot or at European extent (Table 2). The lack of accurate data about traits and ecophysiological responses for individual species in e.g. hydraulic resistance, photosynthesis or respiration has led to the generalisation of the parameters for a given plant functional type, as e.g. depending on their shade-, flooding- or drought-tolerance and ni-trogen requirements (Bugmann, 2001).
Detailed data on tree mortality or recruitment is available at large spatial scales, but it is generally missing at long temporal scales, which could bias long term predictions. In fact, there are diverging findings on tree mortality between observational data and model predictions (Allen et al., 2015,Steinkamp & Hickler, 2015) and lack of tree recruitment data is likely to hamper model predictions (Evans & Moustakas, 2016). Furthermore, modelling forest responses to climate change might be affected by sampling bias due to the under representation of large trees (Vieilledent et al., 2009) or extreme responses (Fisher et al., 2008).
The short temporal span generally available in data is leading to predictions under constant conditions and the common use of space-for-time substitutions, where temporal patterns are inferred from a set of different aged sites (Pickett, 1989). Recent studies suggest that space-for-time predictions provide similar results to time-space-for-time predictions (Blois et al., 2013, Rolo et al., 2016). However, further research of forest responses and predictions using “space-for-time” substitution should be a priority because species are likely to show different re-sponses to climate change due to adaptation (e.g.Benito-Garzón et al., 2011) or legacy effects (Johnson & Miyanishi, 2008).
Table 4
Main data limitations identified for each data type and how it can interact with modelling impacts to climate change.
Data limitations Data type Considerations for modelling Example citations of
databases or data use Data not available at the entire EU
extent at high resolution Local adaptation, phenotypic plasticity orphysiology Biased prediction of climate change impacts due toprediction of more extreme responses or general species-specific physiological parameters
(Robson et al., 2018, Benito-Garzón et al., 2019) No long-term or detailed data Related to inventory data (tree mortality and
recruitment) and management/legacy effects Long-term forest dynamics biased due to lack of long-term or individual data for recruitment and mortality (Moustakas, 2016Baeten et al., 2013) ,Evans & Data available across Europe at
specific sites Long-term forest abundance or growth(palaeoecological data, tree ring and eddy flux responses) and disturbances
Not possible to predict climate change impacts for
the entire European continent (et al., 2018Anderegg et al., 2015,Williams et al.,,Franz 2018)
Extreme responses under- or
over-represented Forest inventory data or tree ring data Unknown extreme forest responses or overestimation (Benito et al., 2017a,bAnderegg et al., 2015), Ruiz-Extract meaningful and detailed
information Soil data and management Missing interactions climate-soil and climate-legacyeffects (Morán-Ordóñez et al., 2019Härkönen et al., 2019, ) Cause-effect relationships are not
available for a wide variety of conditions