HAL Id: hal-01292217
https://hal.archives-ouvertes.fr/hal-01292217
Submitted on 18 Mar 2020
HAL is a multi-disciplinary open access
archive for the deposit and dissemination of sci-entific research documents, whether they are pub-lished or not. The documents may come from teaching and research institutions in France or abroad, or from public or private research centers.
L’archive ouverte pluridisciplinaire HAL, est destinée au dépôt et à la diffusion de documents scientifiques de niveau recherche, publiés ou non, émanant des établissements d’enseignement et de recherche français ou étrangers, des laboratoires publics ou privés.
Determination of methane content in NaCl-H2O fluid
inclusions by Raman spectroscopy. Calibration and
application to the external part of the Central Alps
(Switzerland)
Marie-Camille Caumon, Pascal Robert, Emmanuel Laverret, Alexandre
Tarantola, Aurélien Randi, Jacques Pironon, Jean Dubessy, Jean-Pierre
Girard
To cite this version:
Marie-Camille Caumon, Pascal Robert, Emmanuel Laverret, Alexandre Tarantola, Aurélien Randi, et al.. Determination of methane content in NaCl-H2O fluid inclusions by Raman spectroscopy. Calibration and application to the external part of the Central Alps (Switzerland). Chemical Geology, Elsevier, 2014, 378, pp.52-61. �10.1016/j.chemgeo.2014.03.016�. �hal-01292217�
Determination of methane content in NaCl-H
2O fluid inclusions by Raman
spectroscopy. Calibration and application to the external part of the Central
Alps (Switzerland).
Marie-Camille Caumon1, Pascal Robert1, Emmanuel Laverret2, Alexandre Tarantola1, Aurélien Randi1,
Jacques Pironon1, Jean Dubessy1, Jean-Pierre Girard3
1Université de Lorraine, CNRS, CREGU, GeoRessources laboratory, BP 70239, F-54506 Vandœuvre-lès-Nancy, France 2CV Associés, Immeuble Toki Lana, 7 chemin de la Marouette, F-64100 Bayonne, France
3Total CSTJF, Avenue Larribau, F-64018 Pau, France
Corresponding author: [email protected] DOI: 10.1016/j.chemgeo.2014.03.016
ABSTRACT
The reconstruction of the entrapment conditions of geological fluids requires determining the volumetric and composition properties of the inclusions containing these fluids. In some cases, the analytical data necessary for PVTX determination cannot be obtained from microthermometry. The quantification of the dissolved gases in aqueous fluid inclusions by Raman spectroscopy, following proper calibration of the instrument and methodology, can provide alternative data. In the present study, the intensity of the Raman signal of the symmetric stretching vibrational mode of methane was calibrated in order to (1) determine CH4 concentration in pure and saline water and (2) quantify the molar fractions of H2O and CH4 in the gas phase. High-pressure optical cell (HPOC), i.e. a pressurization system connected to a silica microcapillary heated on a customized heating-cooling stage, reveals to be much more convenient and accurate than synthetic fluid inclusions. Moreover, a wide range of pressure, temperature, and salinity can be covered by this methodology. Over than 1,000 measurements were produced to define the calibration curves, covering the ranges in temperature, pressure and salinity of 60 – 180 °C, 30 – 1000 bar, and 0 – 4 mol.kg-1 NaCl, respectively, which corresponds to a CH4 molality up to 0.6 mol.kg-1. The CH4 solubility vs. CH4/H2O Raman peak area ratio was fitted by a second-order polynomial curve (R² = 0.996). In the gas phase, the molar fraction of H2O vs. Raman peak area ratio is fitted by a straight line (R² = 0.990). The calibration was applied to a set of natural fluid inclusions trapped within late quartz Alpine fissure of the external part of the Central Alps (Switzerland). The determination of CH4
concentration in the studied fluids provided valuable insight on conditions of trapping and on the pressure regimes prevailing in this low-grade metamorphic setting.
Key words: Raman spectroscopy; high-pressure optical cell; methane; fluid inclusions; entrapment.
1.
Introduction
Along with CO2 and N2, CH4 is one of the most common components found in aqueous-rich fluid inclusions in a variety of geological environments. Methane is ubiquitously present in petroleum-rich sedimentary basins where it is produced by thermal cracking of higher hydrocarbons (HHC) in diagenetic and low-grade PT conditions (Mullis, 1987; Price, 1981; Tissot and Welte, 1978). In order to reconstruct the VX properties and the associated isochoric lines of a two-phase fluid inclusion, one must know (1) density/molar volume and composition of the aqueous and gas-rich phases and (2) the volume fraction of the gas phase. In many cases, one or both of these parameters remain inaccessible because the small size of the inclusions or the small volume of gas present does not permit accurate measurements. When the volume fraction of the gas phase cannot be measured by confocal microscopic observations like in the case of hydrocarbon inclusions (e.g. Pironon et al., 1998; Thiéry et al., 2000; Thiéry et al., 2002) or by a spindle stage (Bakker and Diamond, 2006), it is approximated by a two-dimensional measurement with a low degree of confidence, which results in a VX determination with a poor accuracy.
Raman microspectrometry has been used for the study of fluid inclusions since the 1970's and the development of microspectrometers (cf. review articles by Baonza et al., 2012; Burke, 2001; Burruss, 2003; Dubessy et al., 1989; Frezzotti et al., 2011). This non-destructive technique enables in-situ physical-chemical characterization of liquid, gaseous, and solid phases in individual inclusions (down to a few µm size). Beyond molecular characterization, quantification is also possible, as the Raman signal intensity of a component is proportional to its concentration. However, this quantification is not trivial, because the Raman
signal intensity also depends on many other parameters such as Raman cross section, response function of the spectrometer, excitation light wavelength, and fluid physical properties, such as density, refractive index and inter-molecular interactions (Pasteris et al., 1988). Consequently, an instrument-specific calibration is required to make possible any quantification.
The calibration of Raman spectroscopy measurements for methane concentration in geological aqueous fluids was carried out by several authors (Dubessy et al., 2001; Dubessy
et al., 2002a; Guillaume et al., 2003; Pironon et al., 2003, Faulstich et al., 2013). These studies
were based on the preparation and analysis of fluid inclusions in fluorite and quartz crystals synthesized in the laboratory. This approach however suffered from the limited available number of samples for calibration and the restricted range of CH4 concentration covered by the synthetic inclusions, i.e. 0 – 0.2 mol.kg -1. More recently, new reactors with optical windows have been developed to calibrate the Raman signal of dissolved gases. The high-pressure optical cell (HPOC, Chou et al., 2005) was applied by Lu et al. (2008; 2006) to the CH4-H2O system. The authors demonstrated the capability of the device and determined a linear calibration curve for the Raman signal of methane dissolved in pure water as a function of molality in the ranges 1 – 100 °C and 82 – 374 bar, i.e. 0.07 – 0.22 mol.kg-1 of dissolved CH4. Similarly, White (2010) used an autoclave equipped with a sapphire window, and her calibration curve for the range 15 – 60 °C and 7 – 75 bar (< 0.06 mol.kg-1 of dissolved CH4), was found to be linear, in agreement with the one of Lu et al. (2008). She showed that the use of demonized water or sand-filtered seawater (salinity = 31 PSU – Practical Salinity Unit ≅ 31 g of salt per kg of solution) had no observed effect on the calibration curve. The limits of
detection and quantification of her method was 1 mM and 4 mM, respectively.
Another way to determine CH4 pressure in fluid inclusions consists in measuring the position of the peak corresponding to the symmetric stretching vibration of the molecule in the gas phase at ~ 2915 cm-1. Indeed, the peak position is very sensitive to the fluid density (Brunsgaard Hansen et al., 2001; Brunsgaard Hansen et al., 2002; Fabre and Couty, 1986; Lin et al., 2007; Lu et al., 2007; May et al., 1959; Seitz et al., 1993; Seitz et al., 1996). This method requires a high accuracy of the spectrometer measurement at the wavelength scale of interest, as the variation is as low as 0.023 cm-1 per bar up to 150 bar at 22 °C, and become less sensitive as pressure increases, down to 0.5 cm-1 per 200 bar (0.0025 cm-1 per bar) beyond 400 bar (Lin et al., 2007). This method is also very sensitive to the presence of gases other than CH4 in the fluid (Seitz et al., 1993; Seitz et al., 1996). CH4 pressure can also be determined using the peak shape (area-to-intensity ratio, Seitz et al., 1993). This parameter is less sensitive to the composition of the fluid but strongly depends on the acquisition parameters (wavelength, slit aperture, etc.) and on the response function of the spectrometer. In any case, the sensitivity of the approach degrades above 400 bar, and it cannot be used accurately to determine elevated methane pressures.
In this study, an improved HPOC is developed to reach a wide range of temperature, pressure and salinity, in agreement with the wide diversity of geological conditions where methane can be observed. This new experimental device makes possible recording data both in the liquid and gas phases, and was tested in the range of 60 – 180 °C, 30 – 1000 bar, and 0 – 4 m NaCl (moles of NaCl per kg of H2O). A large number of data (> 1,000 data points) was acquired to ensure the reliability of the analytical method. The resulting calibrations are compared to previously published studies. Finally, the analytical method is applied to a set of natural fluid inclusions in late quartz Alpine fissures of the external part of the Central Alps at the
transition between the CH4 and the H2O zone (Tarantola et al., 2009; Tarantola et al., 2007).
2.
Material and methods
2.1.Sample preparation
Solutions of various NaCl concentrations (1.0, 2.5 and 4.0 mol.kg-1) were prepared using ultrapure NaCl salt (Normapur® 100 %, Merck) and dionized Milli-Q water (18.2 MΩ.cm). The NaCl concentration is expressed in molality scale (moles of NaCl per kg of water) with an uncertainty of 0.1 mmol.kg-1. CH4 used in this study is commercial CH4 (Air Liquide) specified >99% pure.
A range of solutions of variable concentration of NaCl were prepared for the experimental calibration. These solutions were loaded in capillaries following the protocol described for fused silica capillary capsules (FSCC) in Ong
et al. (2013) and Caumon et al. (2013). The
capillary is a silica tube, coated with polyimide, with a round section of 360 µm and an internal diameter of 100 µm (Polymicro Technologies). Sections of 7.5 cm are cut and the polyimide is gently burned using a H2-O2 microtorch (Elmaflame 140, Elma). The capillary is then sealed at one end using the microtorch. The sealed end is first heated, then pure Milli-Q water or a NaCl aqueous solution is sucked in the capillary during cooling. The capillary is centrifuged (Sigma 1-15 Microfuge) during 30 s at 12,000 rpm to flow the solution toward the sealed end. A small drop of glue (Loctite Super-Glue) is placed on the outer side of the non-sealed end of the capillary and the capillary is immediately introduced into a stainless steel socket. Glue is dried at room temperature for at least 30 min, a shorter drying time yielding to a higher rate of leakage once under pressure.
2.2.Pressurization device
2.2.1. Principle of the device
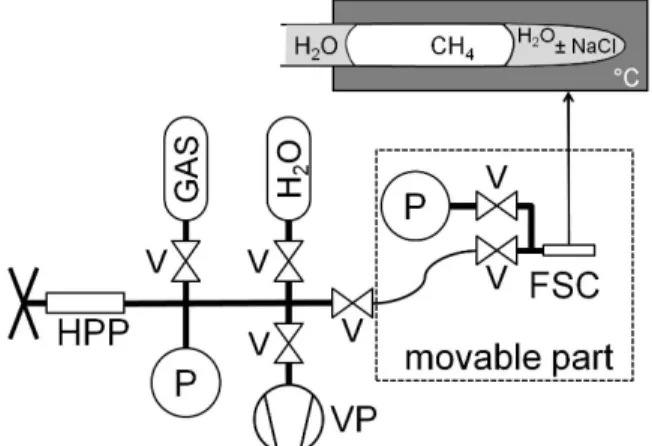
The high-pressure optical cell (HPOC) (Chou, 2012; Chou et al., 2005; Chou et al., 2008) consists of a silica microcapillary connected to a stainless steel vacuum line equipped with gas and water reservoirs, a capstan pump, pressure transducers, and a purge (Figure 1). A movable part, also equipped with valves, a purge, and one pressure transducer, ensures the connection
between the pressurization device and the capillary.
Figure 1: Sketch of the High Pressure Optical Cell (HPOC) used in the present study. HPP: high pressure capstan pump; V: valve; P: pressure transducer; VP: vacuum pump; FSC: fused silica capillary.
The capillary is set on a dedicated heating-cooling stage (Linkam CAP500, Figure 2). Its position in the axis of the Raman microscope can be adjusted along the X and Y direction by use of two micrometric screws.
Figure 2: Picture of the modified Linkam CAP500 heating-cooling stage used in the present study. The main modification is the Y-axis adjusting system.
2.2.2. Gas loading
The microcapillary filled with the solution (pure water or NaCl solution) is connected to the movable part of the device and positioned on the heating-cooling stage. It is then frozen at ~ - 40 °C to be evacuated under vacuum (10-3 mbar). Next, CH4 gas is added in the silica capillary at a pressure of a few bar. The capillary is then physically isolated from the pressurization device by closing the valve
closest to the capillary. The pressurization device is purged under vacuum (10-3 mbar) and then filled with Milli-Q water at a pressure of about 30 bar using the capstan pump. Water is then introduces in the capillary by opening the valve. The difference of pressure between the pressurization device and the capillary forces the water to enter the capillary, thereby enclosing a bubble of CH4 gas between the aqueous solution at the end of the capillary and the water coming from the pressurization device. The capillary is then brought to the targeted temperature (60, 100, 140, or 180 °C) and pressure (often ~30 bar at the beginning of the experiment), and left still overnight (~17 h) in order to achieve thermal and pressure equilibration in the HPOC. Finally, from the sealed end to the side connected to the pressurization device, the capillary contains an aqueous solution (pure water or a saline solution), then a bubble of CH4 gas and then pure water (Figure 1). Water from the pressurization device must reach the edge of the heating plate to prevent the evaporation of the solution at the sealed end and the condensation of liquid water in the cold part of the capillary, outside of the heating stage. Temperature is controlled and adjusted all along the experiments by the heating-cooling stage control panel with an accuracy of ± 1 % in the range 80 - 230 °C (calibration based on the fusion temperature of chemical standards). Pressure is adjusted step by step by the capstan pump, and recorded by using a pressure transducer with an accuracy of ± 1 bar or ± 3 bar, depending on the transducer used (3 different transducers have been used in the study). Each experiment lasts one week. Salinity is controlled at the beginning and at the end of the experiments by recording the Raman spectrum of water at room temperature, following the method described in Caumon et
al. (2013), with an accuracy of ± 0.1 mol.kg-1. The salinity remained constant over the entire week of measurements with the exception of two cases. In these two instances, (1.0 and 4.0 mol.kg-1 of NaCl solutions) a very small increase (0.2 ± 0.1 mol.kg-1) was recorded.
2.3.Raman spectroscopy
2.3.1. The Raman spectrometer
Raman spectra are acquired using a LabRAM HR spectrometer (Horiba Jobin Yvon) equipped with a 600 gr.mm-1 grating and an edge filter. The aperture of the confocal hole is of 500 µm, and a slit aperture of 100 µm is used for measuring CH4 dissolved in an aqueous solution while a reduced aperture of 50 µm is preferred for the gas bubble in order to increase the spectral resolution. The excitation beam is provided by a Stabilite 2017 Ar+ laser (Spectra Physics, Newport Corporation) at 514.53 nm and a power of 200 mW (resulting in ~20 mW at sample), focused in the capillary using a ×20 objective (Olympus). Acquisition time is optimized to have the spectrum maximum intensity between 1/3 and 2/3 of the CCD saturation level (i.e. 20,000-40,000 counts). A total of 10 acquisitions were accumulated to provide a satisfactory spectrum: the resulting noise-to-signal ratio (N/S) is by far lower than 1 %. A spectrum of a Neon light is recorded after each spectrum of the gas phase for wavelength calibration (Dubessy et al., 2012).
2.3.2. Raman data acquisition and processing
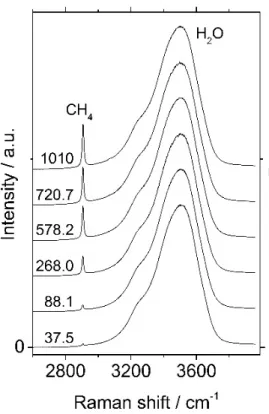
Temperature and pressure are adjusted in a step-by-step fashion. Equilibrium conditions are reached when both the pressure and the Raman signal of CH4 become stable, usually in 2 hours time. Raman data were acquired both in the liquid and gas phases at equilibrium. Each measurement was successively repeated 5 to 10 times at the same conditions of pressure and temperature. Three different operators recorded and treated Raman data over one year to test any possible operator effect, particularly during Raman signal optimization, baseline subtraction and peak area determination. In the liquid phase, data processing consists of measuring the area of the water and the CH4 peaks using Labspec software (v4.32, Horiba Jobin Yvon). The area of the stretching vibration band of water is measured between 2700 and 3950 cm-1, including the stretching vibration peak of dissolved CH4 at around 2905 cm-1 in the basement of the water band (Figure 3). The integration bounds of the dissolved CH4
Raman peak are set in such a way that a straight baseline corresponds to the tangent to the spectrum curve.
Figure 3: Raman spectra of dissolved CH4 in liquid water
as a function of pressure. Spectra are normalized to 1 and are shifted along the y axis for a purpose of clarity. Temperature: 180 °C; pressure: 37.5, 88.1, 268.0, 578.2, 720.7, 1010.0 bar; pure water.
Figure 4: Raman spectra of the CH4 - H2O vapor phase
as a function of pressure. Spectra are normalized to 1 and are shifted along the y axis for a purpose of clarity. Temperature: 180 °C; pressure: 37.5, 88.1, 268.0, 578.2, 720.7, 1010.0 bar; pure water. The y-axis scale is not representative of the true intensity of the water peak relative to the methane peak.
In the gas phase, the Raman signal of CH4 presents a complex feature, with a symmetric stretching vibration ν1 around 2915 cm-1, a weaker ν3 vibration at ~3020 cm-1 and many rovibronic bands of weak intensity, with peak position, intensity and shape depending on density (Figure 4). In particular, the basement of the main stretching vibration becomes less resolved when pressure increases because the rovibronic bands broaden strongly. As it was not possible to measure the peak area of the main stretching vibration without including any other vibration over the whole range of pressure and temperature, the Raman band area of gaseous CH4 is measured between 2630 and 3500 cm-1, including all the peaks and rovibronic features. The water vapor peak at about 3655 cm-1 is asymmetrical, the shape and position varying strongly with fluid density (Figure 4). The integration bounds are determined so that the whole peak is considered and that a straight baseline joins the background level. The main CH4 peak around 2915 cm-1 is also fitted by a Gaussian-Lorentzian function using the peak fitting tool of Labspec software to determine peak position, intensity, area, and shape factor (proportion of Gaussian and Lorentzian functions). The peak position is corrected toward Neon emission lines. All lines of the Neon light spectrum in the range 545-695 nm (equivalent to 2700-3816 cm-1 with respect to 514.53 nm excitation) are fitted using the Peak Fitting tool of Labspec software. A correction function is calculated using the theoretical emission lines of Neon in air (Ralchenko et al., 2011). The resulting accuracy in wavenumber scale is ± 0.2 cm-1.
2.4.Natural samples and fluid inclusions from the Alps
2.4.1. Geological context and description of the samples
The external part of the Central Alps (Switzerland) is subdivided according to four fluid zones with increasing metamorphism from NW to SE, as follows: higher hydrocarbons (HHC), CH4, H2O and CO2 (cf. Figure 1 in Tarantola et al., 2007), (e.g. Frey et
al., 1980a; Frey et al., 1980b; Mullis, 1976;
Mullis, 1979; Mullis, 1987; Mullis et al., 1994; Stalder and Touray, 1970). Fluid inclusions occurring in late Alpine fissure-filling quartz indicate a transition from HHC- to CH4-zone at ~200 °C, from CH4- and to H2O-zone at ~270 °C and from H2O- to CO2-zone at higher temperature (Mullis et al., 1994; Tarantola et
al., 2007). Hydrocarbon fluids result from
thermal evolution of organic matter in flysch sediments. The transition from HHC- to CH4 -zone is linked to progressive thermal cracking of higher hydrocarbons during diagenesis. The CH4-zone is characterized by immiscibility in the CH4-(CO2)-H2O-NaCl system. This results in coeval entrapment of either CH4- or H2 O-rich fluid inclusions in fiber quartz formed by a crack-and-seal process. As a result, the homogenization temperature and pressure reflect the true trapping temperature (up to 270 °C) and pressure (1.0 to 3.5 kbar) (e.g. Mullis, 1987). The transition from the CH4- to the H2O-zone at 270 °C is linked to methane oxidation (e.g. Mullis, 1987; Mullis et al., 1994; Tarantola et al., 2007) during prograde chloritisation of detrital biotite (Tarantola et al., 2009). The formation of CO2 and H2O during this process and the resulting precipitation of calcite in Alpine veins lead to desaturation of the fluid in methane. Consequently the homogenization temperatures of the H2 O-(CH4-CO2)-NaCl inclusions is not equal to the trapping temperature but lower, and a pressure correction (estimated from depth, fluid regime and geothermal gradient is required to determine the actual PT conditions of entrapment.
Clathrate was not observed while carrying out microthermometric measurements of fluid inclusions of the H2O-zone, and the salinity was obtained by measuring the melting temperature of the last crystal of ice (Tm(ice)). Liquid-vapor phase transition was not observed in the CH4-rich part of the inclusion below the critical temperature of methane (-82.4 °C). Therefore, the molar volume of the gas phase remains unknown and thus it was not possible to reconstruct the bulk VX properties of the fluid. The measurement of the amount of CH4 dissolved along the isopleth at the
homogenization temperature is therefore the only way to constrain the actual bulk composition.
In order to demonstrate that the decrease in the homogenization temperatures from N to S is linked to the decrease of CH4 with increasing metamorphic conditions documented by vitrinite reflectance and illite crystallinity index (Frey et al., 1980b; Mullis et al., 2002; Tarantola et al., 2007), representative fluid inclusions from 11 late Alpine quartz veins in the H2O-zone were selected to be studied combining microthermometry and Raman spectroscopy. The samples come from the Oeschinensee area (Wildhorn and Doldenhorn nappes), and the Linth and the Reuss valleys in the external part of the Central Alps (Switzerland).
2.4.2. Microthermometry
Measurements were performed on a Linkam THMSG600 heating-cooling stage connected to an Olympus BX51 microscope (GeoRessources laboratory, Nancy, France). The stage was calibrated using fluid inclusion standards synthesized at the University of Leoben (Austria) with the following phase transitions: the melting temperature of a CO2 -Ar mixture at -56.9 °C, the eutectic point of H2O-NaCl at -21.2 °C, the ice melting and the critical homogenization temperatures of pure H2O respectively at 0.0 °C and 374.0 °C. Temperature of final ice melting (Tm(ice)) and of bulk homogenization by disappearance of the vapor bubble (Th) were measured with an accuracy of ± 0.1 °C and ± 1.0 °C respectively.
2.4.3. Raman analysis of the natural fluid inclusions
Chlorinity was determined using the method of Caumon et al. (2013), based on the variation of the Raman water band shape as a function of chlorinity at room temperature. The uncertainty of the method is of ± 0.4 mass% NaCl. The results were compared to the microthermometric data.
The concentration of dissolved methane in natural fluid inclusions was measured by Raman spectroscopy on inclusions heated a few Celsius degrees above homogenization
temperature using a heating-cooling stage (THMSG600, Linkam). The Raman signal of dissolved methane and water was recorded between 2700 cm-1 and 3950 cm-1. Acquisition time and accumulation number were optimized for each inclusion to reduce the N/S ratio as much as possible (ideally less than 1 %). If the background signal was not flat, the signal of the host mineral was also recorded in the vicinity of the fluid inclusion and at the same depth, using the same acquisition parameters as for the fluid inclusion, and subtracted from the Raman signal of the fluid inclusion prior to subsequent data processing. It is well known that quartz orientation affects the shape of water band because of polarization effect through this birefringent mineral, thereby affecting salinity measurement by Raman spectroscopy (Baumgartner and Bakker, 2009; Caumon et
al., 2013; Dubessy et al., 2002b). However, this
effect was not observed when measuring CH4 concentration. The only effect that could be observed when varying the position of the host mineral with respect to optical extinction was a decrease of the overall intensity of the spectrum, but at a constant CH4/H2O peak area ratio. In some extreme cases, Raman data acquisition became impossible because of very low signal intensity. It is therefore recommended to place the sample at or close to the optical extinction of the mineral to increase the total Raman intensity.
The Raman analysis of the gas phase consists in acquiring the Raman spectrum of the gas bubble at room temperature to determine the CO2 and CH4 molar proportion from the peak area ratio. The peak areas were corrected from their Raman scattering cross sections (Burke, 2001; Schrötter and Klöckner, 1979) but not from the response function of the spectrometer. Seitz et al. (1993; 1996) have shown that the peak parameters are sensitive to the pressure and the composition of the fluid in the case of CO2-CH4 gas mixture. Also, the CO2 main stretching vibration splits in a Fermi doublet, in which the intensities of each peak varies relatively to the other with fluid density (Dubessy et al., 1989 and references therein).Considering that the fluid composition is most likely consistent among the samples
investigated, and that the fluid density is rather small (no liquid-vapor phase transition, no clathrate), the peak parameters and Raman scattering cross sections are probably nearly constant over the sample set. Thus the variations of the peak area ratio can be interpreted as a change in molar composition. The Raman spectra of CH 4 and CO2 in the vapor phase at room temperature were acquired separately, in two different spectral windows. This implied that the bubble remained stable during acquisition to allow subsequent quantification. However, the fluid inclusions with the lowest Th values (≤ 150 °C) often exhibited moving gas bubble which prevented the acquisition of the Raman spectra. The CH4 peak area was measured at around 2917 cm-1 and the CO2 peak area was measured considering both the peaks of the Fermi doublet, at about 1285 cm-1 and 1388 cm-1 (Dubessy et al., 1989). Peak areas were determined using the integration tool of Labspec software (Horiba Jobin Yvon).
3.
Results and discussion
3.1.Calibration of the Raman signal for measurement of dissolved CH4 in the
aqueous phase
3.1.1. Uncertainty issues
In the liquid phase, the CH4 concentration expressed in molality scale (moles per kg of water) is calculated from salinity, pressure and temperature using the thermodynamic model of Duan and Mao (2006), which covers the full range of pressure, temperature and salinity of the present experiments with a low relative uncertainty (given at ~ 5 % in Duan and Mao, 2006). The uncertainty on the CH4 concentration is determined by considering both the relative uncertainty of the model itself and the experimental/analytical uncertainties on pressure, temperature and salinity. These experimental uncertainties are independent from one another and thus, are added as a quadratic sum. The experimental uncertainty and the model uncertainty are cumulated as a simple sum, as the uncertainty on CH4 concentration determined from the experimental parameters is dependent on the model uncertainty. According to this approach,
the total uncertainty on CH4 solubility ranges between 5 and 10 %, and is dominated by uncertainty on the thermodynamic model (except at very low pressure or high temperature). The uncertainty on Raman measurements is evaluated from considering repeated measurements, including those performed by three different operators.
3.1.2. Calibration curve: best fit and non linearity
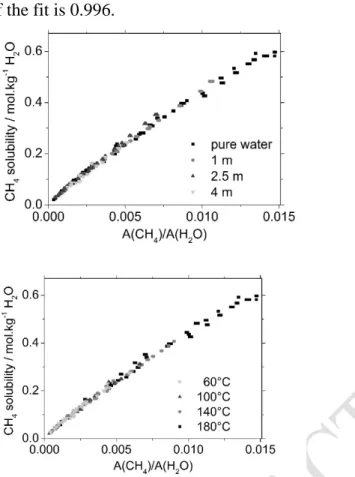
Figure 5: CH4 solubility (mol.kg-1 H2O) as a function
of the Raman peaks area ratio A(CH4)/A(H2O).
Temperature: 60 -180 °C; pressure: 30-1000 bar; salinity (NaCl): 0-4 mol.kg-1. Solid line: 2nd order
polynomial fit; dotted line: linear fit on data points between the arrows. See text for y-axis error calculation.
The results of Raman measurements of dissolved CH4 concentration in liquid water expressed in molality are presented in Figure 5 as a function of the ratio of CH4 / H2O peak areas. The results are presented according to salinity and temperature in Figure 6, illustrating that salinity and temperature do not affect the calibration curve. Consequently, the set fits a single and unique calibration curve regardless of temperature and salinity conditions. A linear regression was applied to the entire data set in Figure 5. The best fit is obtained by using a second-order polynomial curve and direct weighting by the y-axis uncertainty, with an unfixed intercept, and can be represented by: mCH4 = (0.008 ± 0.001) + (50.2 ± 0.3) × A(CH4)/A(H2O)
– (660 ± 20) × [A(CH4)/A(H2O)]² (1)
with mCH4 the solubility of CH4 in the aqueous solution (in mol.kg-1 of water) and A(CH4)/A(H2O) the methane-to-water peak area ratio in the liquid phase. The adjusted R² of the fit is 0.996.
Figure 6: CH4 solubility (mol.kg-1 H2O) as a function
of the Raman peaks area ratio A(CH4)/A(H2O) and
salinity (top) or temperature (bottom). Temperature: 60 -180 °C; pressure: 31000 bar; salinity (NaCl): 0-4 mol.kg-1. Y-axis error is not shown for the sake of
clarity.
The limit of detection strongly depends on the quality of the Raman spectrum. In the case of natural fluid inclusions, the detection limit depends on inclusion size and on baseline stability (flat or distorted by the signal of the host mineral). In the ideal case where the Raman spectrum noise is less than 1% and the baseline is flat, the quantification limit is around A(CH4)/A(H2O) = 0.0001, i.e. 0.01 mol.kg-1 of dissolved CH4. The uncertainty on the calculated CH4 molality value resulting from the calibration function (± 1σ) is less than ± 2 % beyond A(CH4)/A(H2O) = 0.001, as determined from equation 1.
The calibration curve defined by equation (1) is not a straight line but a second-order
polynomial curve, shifting from linearity at the highest temperature conditions. Several reasons for such an unexpected behavior can be considered.
First, one might consider that the thermodynamic model of Duan and Mao (2006) is less accurate at high pressure and temperature, however there is no evidence for it in their study (see figures 2 and 3 in Duan and Mao, 2006). Second, a resolution effect might occur, according to which the use of a low or medium spectral resolution of a spectrometer results in an underestimation of peak areas (Anderson and Griffiths, 1975). The water band being very large is not sensitive to this resolution effect, but the peak of methane is much thinner, and therefore, more sensitive to this effect. However, an underestimation of the methane peak area would shift data points to lower values on the x-axis, which is contrary to what is observed in Figure 5. Third, and most likely, the departure of the calibrating curve from linearity may be related to changes of the shape of the water stretching band which is very sensitive to the physical-chemical conditions which affect hydrogen bonds, in particular density, i.e. pressure, temperature and salinity (e.g. Bakker, 2004; Caumon et al., 2013; Dubessy et al., 2002b; Frantz et al., 1993; Walrafen, 1962; Walrafen, 1964; Walrafen, 1967; Walrafen, 1971). It is conceivable that the deformation of the water stretching band at low temperature would take place at constant area, i.e. the global Raman cross section of the water band which represents the proportionality relation between the whole band area and the number of water molecules in the analyzed volume is constant even if the band shape evolves, but not at high temperature. In the latter, the change of band profile becomes so important that the relation between the band area and the number of water molecules in the analyzed volume changes. The maximum of variation, observed at 180 °C and 1,000 bar, is a decrease of ~ 15%, a very low value considering the range of pressure and temperature covered by the present experiment. This explanation for the non-linearity of the calibration curve is the favored one.
3.1.3. Comparison with previous studies
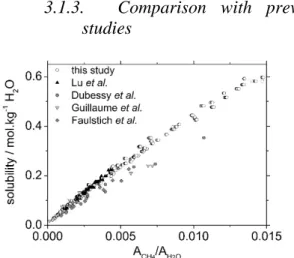
Figure 7: CH4 solubility (mol.kg-1 H2O) as a function
of the Raman peaks area ratio A(CH4)/A(H2O).
Comparison with previous data: Lu et al. (2008); Dubessy et al. (2001); Guillaume et al. (2003), Faulstich et al. (2013). Y-axis error is not shown for the sake of clarity.
Figure 7 shows a comparison of our results with those of similar Raman studies. Measurements by Lu et al. (2008) were acquired using the same HPOC device and the same Raman spectrometer (LabRAM HR, Horiba Jobin Yvon) in the same operating configuration (grating, laser wavelength, CCD type, etc.). In addition, the data process is similar to the one used in the present study. Lu et al. (2008) measurements are for pure water, and cover temperature and pressure ranges of 1 –100 °C and 82 –374 bar, respectively. Their data perfectly fits the calibration curve defined in the present study. Lu et al (2008) calculated a linear relation through their data points as follows (equation 2 in Lu et al., 2008):
X(CH4) = 0.92853 × A(CH4)/A(H2O) (3)
with X(CH4) the molar fraction of CH4 dissolved in water. It is equivalent to:
mCH4 = 51.7 × A(CH4)/A(H2O) (4)
in the molality scale.
Fitting our data by a straight line in the same range of molality as the one of Lu et al. (2008), and using the same fit parameters (fix intercept equal to zero without data weighting), yields a
slope of 51.8 ± 0.2. The similarity between the two studies demonstrates the reliability and reproducibility of the experimental methods and Raman signal processing.
Dubessy et al. (2001), Guillaume et al. (2003) and Faulstich et al. (2013) determined their calibration curve using different experimental conditions. They prepared synthetic fluid inclusions in quartz and fluorite fragments and recorded Raman spectra on a different spectrometer. Because of their procedure, they collected much fewer data points compared to what is now possible using the HPOC. In addition, in the two oldest studies methane concentration was calculated using an older, less advanced, version of the Duan et al. thermodynamic model (Duan et al., 1992). Finally, data processing was different, the peak area of methane being determined by a specific peak-fitting procedure (Dubessy et al., 2001). In spite of all these differences, the measurements provided in Dubessy et al. (Dubessy et al., 2001), Guillaume et al. (2003) and Faulstich et al. (2013) for pure water are not very far from those of Lu et al. (2008) and those of the present study. The main disagreement is that Guillaume et al. (2003) and Faulstich et al. (2013) observed a variation in the calibration curve as a function of salinity. However, this could be related to the small number of data points in saline solutions (7 points inGuillaume et al. (2003) corresponding to 1 or 2 points per salinity value, and 4 to 5 points per salinity value in Faulstich et al. (2013)), most likely insufficient for proper fitting.
White (2010) also calibrated the Raman signal of dissolved methane in pure water and seawater, at low pressure and temperature (15-60°C, < 75 bar, [CH4] < 0.06 mol.L-1), using optical cells equipped with sapphire windows. In agreement with our results and those of Lu
et al. (2008), White (2010) observed a linear
response of the Raman signal for dissolved methane with concentration in this low molality range, and reported no effect of salinity on the response curve.
3.2.Calibration of the Raman signal intensity of water in the gas phase
In the gas phase, the molar fraction of water is calculated using the same thermodynamic model (Duan and Mao, 2006). The uncertainty on the gas phase composition is not given by these authors. Therefore, only the experimental uncertainty is considered (temperature, pressure, and salinity), yielding an uncertainty on the calculated molar fraction of water of ≤ 10 %.
The molar fraction of water in the gas phase is plotted in Figure 8 as a function of the ratio of the water peak area to the total peak area (area of CH4 + area of H2O) without correction by the Raman cross sections. The observed dispersion in the data along the x-axis is related to the noise in the Raman signal, which is larger at low y(H2O) values (down to 0.01 %). The data are fitted by a straight line using direct weighting by the y-axis uncertainty, yielding the following equation:
y(H2O) = (5.19 ± 0.02) × A(CH4)/[A(CH4)+A(H2O)]
(5)
with y(H2O) the molar fraction of water in the gas phase and A(CH4)/[A(CH4)+A(H2O)] the water-to-(water + methane) peak area ratio in the gas phase. The adjusted R² of the fit is equal to 0.990.
Figure 8: Log-log plot of the molar fraction of H2O in
the vapor phase y(H2O) as a function of the Raman
peaks area ratio A(H2O)/A(CH4 + H2O). Y-axis
uncertainty is estimated to be ~10 % from experimental uncertainties only.
Contrary to the calibration curve for dissolved CH4 in the liquid phase, the calibration for water in the gas phase yields a good linearity over two orders of magnitude in molar fraction (0.001 – 0.1), i.e. the whole range of
experimental conditions (60-180 °C, 30-1000 bar, 0-4 m NaCl). This linearity proves that the ratio of the Raman scattering cross sections of CH4 and H2O remains constant (within the uncertainty range) up to 10% of H2O in the gas phase of the CH4-H2O binary system.
The variation of position and area-to-intensity ratio (A/I) of the ν1 stretching vibration of CH4 with pressure is shown in Figure 9. The peak position is sensitive to pressure up to 400 bar, but also to temperature. In our data set, the wavelength accuracy and the number of data points were insufficient to ensure reliable determination of pressure from peak position as done by Lu et al. (2007). A/I is much less sensitive to temperature up to about 700 bar, and sensitive to pressure even at elevated values. However, the determination of pressure from A/I would imply an accuracy no better than ± 50 bar up to 400 bar (graphical estimation), which represents at least 0.05 mol.kg-1 of CH
4 dissolved in water. It is much (fivefold) less accurate than the measurement of molality of dissolved CH4 in the liquid phase.
Figure 9: Position (cm-1) and area-to-intensity ratio
(arbitrary units) of the ν1 peak of methane as a
function pressure (bar). Temperature: 60 -180°C; pressure: 30-1000 bar; salinity (NaCl): 0-4 mol.kg-1.
3.3.Application to Alpine fluid
inclusions
3.3.1. Microthermometric and Raman analysis
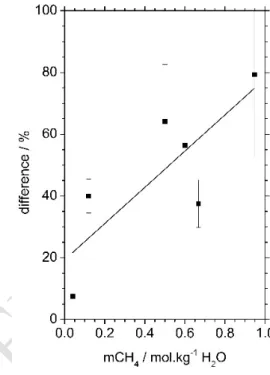
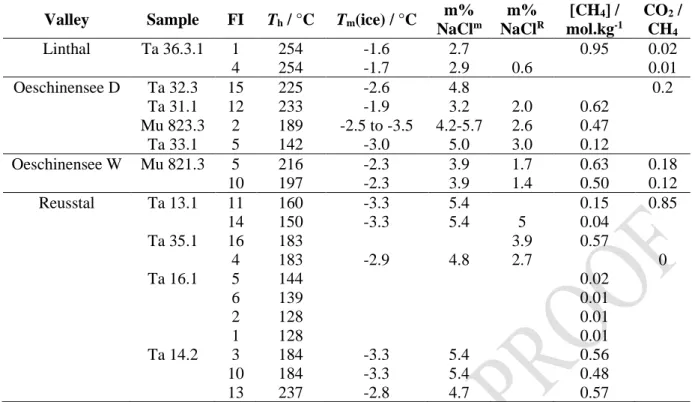
The homogenization temperatures range from 255 down to 128 °C, and are always observed by disappearance of the vapor phase (Table 1). Fluid inclusions have Tm(ice) ranging from -3.5 to -1.6 °C resulting in 2.7 to 5.7 mass% NaCl (Bodnar, 1993). Chlorinity determined by Raman yielded systematically lower values (0.6 to 3.9 mass% NaCl). The difference between the values obtained by microthermometry and Raman spectroscopy seems to be correlated to the amount of CH4, and increases with greater methane concentration (). This is best explained by invoking the presence at low temperature of non-visible methane clathrates trapping water, thereby increasing salt concentration in the remaining aqueous liquid phase at Tm(ice). As microthermometry is carried out at low temperature (-3.5 to -1.6 °C) and Raman spectroscopy at room temperature, only microthermometric values would be affected by such a phenomenon. Consequently, only the salinity values determined by Raman are considered in the following discussion.
As a result of methane oxidation, the upper end of the CH4-zone is marked by a strong increase of CO2 in the fluid phase, which then precipitates as calcite (Mullis et al., 1994; Tarantola et al., 2009; Tarantola et al., 2007).
The values of the CO2/CH4 ratio in the H2 O-zone are mostly lower than 0.2 and do not show any trend with homogenization temperature (Table 1). Consequently, the small amount of observed CO2 is not considered in the
following discussion.
Figure 10: Difference between salinity measured by microthermometry and by Raman spectroscopy as a function of the solubility of CH4 (mol.kg-1) at
homogenization temperature (Table 1). The y-axis error bars are calculated from the experimental uncertainty (Tm(ice) ± 0.1 °C, mass% NaClR ± 0.4 mass% NaCl).
Difference (%) = [(mass% NaClm - mass% NaClR) /
mass% NaClm] × 100
The dissolved CH4 concentration is strongly correlated with homogenization temperature (). The amount of CH4 at LV equilibrium ranges from 0.95 ± 0.1 mol.kg-1 H2O for Th of 250 °C to 0.1 mol.kg-1 H2O for Th of 130 °C. A linear regression correlating CH4 concentration with
Th yields the following equation:
mCH4 = (- 0.9 ± 0.1) + (0.0070 ± 0.0007) × Th(6) with mCH4 the CH4 concentration expressed in mol.kg-1 H2O. The adjusted R² is equal to 0.88: most of the analyzed points are described within ± 0.1 mol.kg-1 H
Valley Sample FI Th / °C Tm(ice) / °C m% NaClm m% NaClR [CH4] / mol.kg-1 CO2 / CH4 Linthal Ta 36.3.1 1 254 -1.6 2.7 0.95 0.02 4 254 -1.7 2.9 0.6 0.01 Oeschinensee D Ta 32.3 15 225 -2.6 4.8 0.2 Ta 31.1 12 233 -1.9 3.2 2.0 0.62 Mu 823.3 2 189 -2.5 to -3.5 4.2-5.7 2.6 0.47 Ta 33.1 5 142 -3.0 5.0 3.0 0.12 Oeschinensee W Mu 821.3 5 216 -2.3 3.9 1.7 0.63 0.18 10 197 -2.3 3.9 1.4 0.50 0.12 Reusstal Ta 13.1 11 160 -3.3 5.4 0.15 0.85 14 150 -3.3 5.4 5 0.04 Ta 35.1 16 183 3.9 0.57 4 183 -2.9 4.8 2.7 0 Ta 16.1 5 144 0.02 6 139 0.01 2 128 0.01 1 128 0.01 Ta 14.2 3 184 -3.3 5.4 0.56 10 184 -3.3 5.4 0.48 13 237 -2.8 4.7 0.57
Table 1: Th, Tm(ice), salinity (mass% NaCl), CH4 molality (mol.kg-1 H2O) and CO2/CH4 molar ratio in the gaseous phase
of 11 samples from late Alpine fissure quartz of the external part of the Central Alps. FI: fluid inclusion identification number; m: calculated from T
m(ice) according to Bodnar (1993); R: calculated from the Raman spectra of water at room
temperature after Caumon et al. (2013). Lack of value relates to the inability to acquire the experimental data.
Figure 11: CH4 concentrations (mol.kg-1 H2O) in the
liquid phase at homogenization conditions. As shown by vitrinite reflectance and illite crystallinity index, the metamorphic grade increases when homogenization temperatures decrease. Solid line: linear regression of the experimental data set; dotted lines: linear regression ± 0.1 mol.kg-1 H
2O. The y-axis uncertainty is calculated
from equation 1 and is smaller than or equal to graphical data point size, with the exception of two data points (drawn error bars).
3.3.2. PVTX evolution in the H2
O-zone (external part of the Central Alps)
PT conditions of fluid entrapment in the CH4 -zone are derived from inclusions showing immiscibility in crack-and-seal quartz found in open cavities. The true temperature of trapping is obtained from the homogenization temperature of water-rich fluid inclusions (up to 270 °C); the true pressure of trapping is obtained from the pressure at 270 °C of methane-rich fluid inclusions according to the equation of state of Angus et al. (1978) for pure CH4. The pressure of entrapment ranges between around 100 and 350 MPa (Mullis et
al., 1994; Tarantola et al., 2007), between
hydrostatic conditions and pressures higher than the lithostatic gradient, in agreement with the crack-and-seal mechanism (Ramsay, 1980) ( Figure 12).
In the fluid inclusions of the H2O-zone, no clathrate nor liquid-vapor phase transitions are observed at low-temperature during microthermometric experiments. Therefore, the concentration in CH4 used to be estimated
or more generally neglected, and PT conditions of fluid entrapment were calculated within the H2O-NaCl system (Mullis, 1987). Our approach permits in a very unique manner to obtain the actual PVTX properties for individual inclusions within the H2O-CH4 -NaCl system combining the salinity and the concentration of methane given by Raman spectroscopy ( Figure 12). Isopleths and isochores of three inclusions from different cavities of the Doldenhorn nappe have been calculated using the model of Duan and Mao (2006). The PT conditions at homogenization using are reported in Figure 12. In comparison to the CH4-zone, the fluid in the H2O-zone is no more saturated with respect to CH4 and entrapment of two immiscible fluids (CH4- and H2O-rich) is no longer observed. In order to obtain the actual temperature and pressure conditions of entrapment, a pressure correction is required.
Vitrinite reflectance, illite “crystallinity” and
δ18O equilibrium temperature between quartz and calcite showed that metamorphic temperature conditions increase with decreasing homogenization temperatures in the H2O-zone (Mullis, 1987; Mullis et al., 1994; Tarantola et al., 2007). The entrapment conditions after pressure correction using the entrapment temperature estimations of Tarantola et al. (2007) are depicted in Figure 12 by the bold portion at the upper end of the isochores. With increasing metamorphic grade, the decreasing amount of CH4 results in a strong pressure decrease of the LV envelope. As a result, homogenization temperatures decrease with increasing PT conditions at the transition between the CH4- and the H2O-zone. The overall desaturation in CH4 of the fluid occurred within a few degrees above the transition with the CH4-zone at 270 °C. Above 320 °C, the fluid can be considered as CH4-free and would then evolve within the H2 O-NaCl-(CO2) system. At this point only the homogenization temperature would increase again with increasing entrapment temperature.
Figure 12: Position of isopleths and isochores calculated from the equation of state of Duan and Mao (2006) for selected inclusions of the H2O-zone of the
Doldenhorn nappe (Ta31.1/12: mCH4 = 0.62 m, 2.0
mass% NaCl; Mu823.3/2: mCH4 = 0.47 m, 2.6 mass%
NaCl; Ta33.1/5: mCH4 = 0.12 m, 3.0 mass% NaCl).
The dark grey area corresponds to the PT conditions of fluid entrapment within the CH4-zone (below
270 °C) derived from fluid immiscibility constraints in crack-seal quartz. The dotted lines show lithostatic and hydrostatic geothermal gradients of 30 and 40 °C.km-1. The three solid bold curves are the L/V
curves. The isochores start from homogenization temperature and pressure (white circles), and are divided in three parts: 1) a thin solid part corresponding to the PT domain validated in Duan and Mao (2006); 2) a thin dashed part corresponding to the extension beyond the validated PT domain; 3) a bold solid part corresponding to the PT conditions of entrapment in agreement with temperatures estimated by Tarantola et al. (2007).
In the temperature range 270 - 300 °C (CH4 concentrations higher than 0.5 mol.kg-1 H
2O), the fluid pressure at entrapment possibly ranges between hydrostatic and lithostatic conditions. At a slightly higher grade, for CH4 concentrations lower than 0.5 mol.kg-1 H2O, when the cavities are entirely filled with quartz and calcite, the trapping temperatures are consistent with the regional lithostatic thermal gradient (30-40 °C.km-1).
4.
Conclusions
As an alternative to microthermometry measurements, quantification of dissolved gas content in aqueous fluid inclusions can be obtained using Raman spectroscopy after proper calibration of the instrument. In the present study, the Raman signal of CH4 is calibrated as a function of solubility over a wide range of temperature (60 - 180 °C), pressure (30 - 1,000 bar) and salinity (0 – 4 m). This was made possible by the use of a HPOC (High Pressure Optical Cell) permitting to adjust pressure and temperature in a very short time interval. The optical cell is a silica microcapillary which resists at least to 1,000 bar and 180 °C and is chemically inert in the conditions of the experiments. The very small volume of the device (a few mL) precludes any safety issues with respect to possible blow up due to gas pressure. This device has been used to study various geological systems, such as measurement of CO2 density (Berkesi et al., 2009; Wang et al., 2011), diffusion coefficients of CH4 (Lu et al., 2006) or CO2 (Belgodere et
al., 2012; Lu et al., 2012; Lu et al., 2013),
solubility of CH4 hydrate (Lu et al., 2008), or iron sulphide minerals transformation at room temperature (Wang et al., 2012).
The calibration derived in the present study for the determination of dissolved CH4 in the liquid phase rely on a very large number of data points yielding a very accurate and robust calibration curve. As a result, when analyzing fluid inclusions, the uncertainty on the calculated dissolved CH4 molality is mainly impacted by the spectral properties of the sample (S/N ratio of the Raman signal and baseline quality) and the uncertainty of the thermodynamic model (~5 % for dissolved CH4). The calibration curve is not salinity dependant and can therefore be applied readily to fluid inclusions with unknown or poorly defined salinity. Comparison with previous studies (Dubessy et
al., 2001; Guillaume et al., 2003; Lu et al.,
2008) indicates that the Raman method appears to be mainly dependant on the response function of the spectrometer, but not on the operator.
Similarly, the Raman technique permits to determine the molar fraction of water in the
methane phase in the range 0.1 – 10 %, covering a large range of pressure and temperature. Pressure determination based on the analysis of the shape and position of the stretching vibration peak of methane in the gas phase is possible but the accuracy remains poor. The A/I parameter is more sensitive to pressure than the peak position, over a wider range of pressure. Also, this parameter is much less dependent on temperature than peak position.
The present calibration has been successfully tested on a set of natural fluid inclusions in quartz samples from the external part of the Central Alps (Switzerland). The amount of CH4 determined by our method is consistent with the geological conditions previously determined by other approaches including field observations, vitrinite reflectance, illite “crystallinity” and stable isotope measurements. Our measurements permitted to precisely determine the conditions of entrapment of the metamorphic fluids right after the end of the CH4-zone. Our investigation shows that fluid pressure in the studied area at temperatures higher than about 290 °C is primarily controlled by lithostatic regimes. ACKNOWLEDGMENTS
Gilles Bessaque is warmly thanked for his help in building the HPOC and customizing the heating-cooling stage. Hélène Grandclaire is thanked for recording some of the data in pure water. Elena Bazarkina is thanked for calibrating the heating-cooling stage for temperature. I-Ming Chou (USGS), Vijay Raman (Elsevier India), and an anonymous reviewer are thanked for their helpful and constructive reviews. Financial support for part of this study (calibration) was provided by Total.
References
Anderson, R.J. and Griffiths, P.R., 1975. Errors in absorbance measurements in infrared Fourier transform spectrometry because of limited instrument resolution. Anal. Chem., 47(14): 2339-2347.
Angus, S., Armstrong, B. and De Reuck, K.M., 1978. Methane, Chemical Data Series, No. 17. International Thermodynamics Tables of the
Fluid State, Vol. 5. Pergamon Press, Oxford, 251 pp.
Bakker, R.J., 2004. Raman spectra of fluid and crystal mixtures in the systems H2O, H2O-NaCl and
H2O-MgCl2 at low temperatures: applications
to fluid-inclusion research. Can. Mineral., 42(5): 1283-1314.
Bakker, R.J. and Diamond, L.W., 2006. Estimation of volume fractions of liquid and vapor phases in fluid inclusions, and definition of inclusion shapes. Am. Mineral., 91(4): 635-657.
Baonza, V.G., Rull, F. and Dubessy, J., 2012. Raman Spectroscopy of Gases, Water and other Geological Fluids. In: J. Dubessy, M.-C. Caumon and F. Rull (Editors), Raman Spectroscopy Applied to Earth Sciences and Cultural Heritage. EMU Notes in Mineralogy. The European Mineralogical Union and the Mineralogical Society of Great Britain, London, pp. 279-320.
Baumgartner, M. and Bakker, R.J., 2009. Raman spectroscopy of pure H2O and NaCl-H2O
containing synthetic fluid inclusions in quartz - A study of polarization effects. Miner. Petrol., 95(1-2): 1-15.
Belgodere, C., Dubessy, J., Pironon, J., Sterpenich, J., Caumon, M.-C., Robert, P. and Randi, A., 2012. Experimental determination of CO2 diffusion
coefficient in aqueous solutions under pressure via Raman spectroscopy at room temperature, GeoRaman 10, Nancy, France, pp. 197. Berkesi, M., Hidas, K., Guzmics, T., Dubessy, J. and
Bodnar, R.J., 2009. Presence of H2O in deep
lithospheric fluid inclusions: a combined method of Raman spectroscopy and heating-freezing stage, European Current Research On Fluids Inclusions, Granada, Spain, pp. 29-30. Bodnar, R.J., 1993. Revised equation and table for
determining the freezing point depression of H2O-NaCl solution. Geochim. Cosmochim. Ac., 57: 683-684.
Brunsgaard Hansen, S., Berg, R.W. and Stenby, E.H., 2001. Raman spectroscopic studies of methane-ethane mixtures as a function of pressure. Appl. Spectrosc., 55(6): 745-749.
Brunsgaard Hansen, S., Berg, R.W. and Stenby, E.H., 2002. How to determine the pressure of a methane-containing gas mixture by means of two weak Raman bands, ν3 and 2ν2. J Raman
Spectrosc, 33(3): 160-164.
Burke, E.A.J., 2001. Raman microspectrometry of fluid inclusions. Lithos, 55(1-4): 139-158.
Burruss, R.C., 2003. Raman spectroscopy of fluid inclusions. In: I. Samson, A. Anderson and D. Marshall (Editors), Fluid inclusions: analysis and interpretation. Mineralogical Association of Canada, pp. 279-289.
Caumon, M.-C., Dubessy, J., Robert, P. and Tarantola, A., 2013. Fused-silica capillary capsules (FSCCs) as reference synthetic aqueous fluid
inclusions to determine chlorinity by Raman spectroscopy. Eur. J. Mineral., 25: DOI: 10.1127/0935-1221/2013/0025-2280.
Chou, I.-M., 2012. Optical cells with fused silica windows for the study of geological fluids. In: J. Dubessy, M.-C. Caumon and F. Rull (Editors), Raman Spectroscopy Applied to Earth Sciences and Cultural Heritage. EMU Notes in Mineralogy. The European Mineralogical Union and the Mineralogical Society of Great Britain, London, pp. 227-247. Chou, I.M., Burruss, R.C. and Lu, W., 2005. Chapter 24
- A new optical capillary cell for spectroscopic studies of geologic fluids at pressures up to 100 MPa. In: J. Chen, Y. Wang, T.S. Duffy, G. Shen and L.F. Dobrzhinetskaya (Editors), Advances in High-Pressure Technology for Geophysical Applications. Elsevier, Amsterdam, pp. 475-485.
Chou, I.M., Song, Y.C. and Burruss, R.C., 2008. A new method for synthesizing fluid inclusions in fused silica capillaries containing organic and inorganic material. Geochim. Cosmochim. Ac., 72(21): 5217-5231.
Duan, Z. and Mao, S., 2006. A thermodynamic model for calculating methane solubility, density and gas phase composition of methane-bearing aqueous fluids from 273 to 523 K and from 1 to 2000 bar. Geochim. Cosmochim. Ac., 70(13): 3369-3386.
Duan, Z., Møller, N. and Weare, J.H., 1992. An equation of state for the CH4-CO2-H2O system: II.
Mixtures from 50 to 1000°C and 0 to 1000 bar. Geochim. Cosmochim. Ac., 56(7): 2619-2631. Dubessy, J., Buschaert, S., Lamb, W., Pironon, J. and
Thiéry, R., 2001. Methane-bearing aqueous fluid inclusions: Raman analysis, thermodynamic modelling and application to petroleum basins. Chem. Geol., 173(1-3): 193-205.
Dubessy, J., Caumon, M.-C., Rull, F. and Sharma, S., 2012. Instrumentation in Raman spectroscopy: elementary theory and practice. In: J. Dubessy, M.-C. Caumon and F. Rull (Editors), Raman Spectroscopy applied to Earth Sciences and Cultural Heritage. EMU Notes in Mineralogy. The European Mineralogical Union and the Mineralogical Society of Great Britain & Ireland, London, pp. 83-165.
Dubessy, J., Guillaume, D., Lhomme, T., Pironon, J., Tarantola, A. and Teinturier, S., 2002a. Advancement in the analysis of fluid inclusions using both micro-Raman spectroscopy and thermodynamic modelling. Acta Univ. Carol. Geol., 46(1): 16-18.
Dubessy, J., Lhomme, T., Boiron, M.-C. and Rull, F., 2002b. Determination of chlorinity in aqueous fluids using Raman spectroscopy of the stretching band of water at room temperature:
Application to fluid inclusions. Appl. Spectrosc., 56: 99-106.
Dubessy, J., Poty, B. and Ramboz, C., 1989. Advances in C-O-H-N-S fluid geochemistry based on micro-Raman spectrometric analysis of fluid inclusions. Eur. J. Mineral., 1(4): 517-534. Fabre, D. and Couty, R., 1986. Investigation on the
density effects in the Raman spectrum of methane up to 3,000 Bar - Application to the determination of pressure in fluid inclusions trapped in minerals. CR Acad. Sci. II, 303(14): 1305-1308.
Faulstich, F.R.L., Neumann, R., Pironon, J. and Randi, A., 2013. Synthesis of fluid inclusion reference materials in the H2O–NaCl–CH4 system. Geostand. Geoanal. Res., 37(4): 393-402.
Frantz, J.D., Dubessy, J. and Mysen, B., 1993. An optical cell for Raman spectroscopic studies of supercritical fluids and its application to the study of water to 500 °C and 2000 bar. Chem. Geol., 106(1): 9-26.
Frey, M., Bucher, K., Frank, E. and Mullis, J., 1980a. Alpine metamorphism along the geotraverse Basel-Chiasso: a review. Eclogae Geol. Helv., 73(2): 527-546.
Frey, M., Teichmüller, M., Teichmüller, R., Mullis, J., Künzi, B., Breitschmid, A., Gruner, U. and Schwizer, B., 1980b. Very low-grade metamorphism in external parts of the Central Alps: illite crystallinity, coal rank and fluid inclusion data. Eclogae Geol. Helv., 73(1): 173-203.
Frezzotti, M.L., Tecce, F. and Casagli, A., 2011. Raman spectroscopy for fluid inclusion analysis. J. Geochem. Explor., 112(0): 1-20.
Guillaume, D., Teinturier, S., Dubessy, J. and Pironon, J., 2003. Calibration of methane analysis by Raman spectroscopy in H2O-NaCl-CH4 fluid
inclusions. Chem. Geol., 194(1-3): 41-49. Lin, F., Sum, A.K. and Bodnar, R.J., 2007. Correlation
of methane Raman nu(1) band position with fluid density and interactions at the molecular level. J Raman Spectrosc, 38(11): 1510-1515. Lu, W., Chou, I.M. and Burruss, R.C., 2008.
Determination of methane concentrations in water in equilibrium with sI methane hydrate in the absence of a vapor phase by in situ Raman spectroscopy. Geochim. Cosmochim. Ac., 72(2): 412-422.
Lu, W., Chou, I.M., Burruss, R.C. and Song, Y., 2007. A unified equation for calculating methane vapor pressures in the CH4-H2O system with
measured Raman shifts. Geochim. Cosmochim. Ac., 71(16): 3969-3978.
Lu, W., Guo, H. and Li, L., 2012. Determination of diffusion coefficients of carbon dioxide in water between 298 and 473 K in a high-pressure capillary optical cell with in-situ Raman
spectroscopic measurements, GeoRaman 10, Nancy, France, pp. 67.
Lu, W.J., Chou, I.M., Burruss, R.C. and Yang, M.Z., 2006. In situ study of mass transfer in aqueous solutions under high pressures via Raman spectroscopy: A new method for the determination of diffusion coefficients of methane in water near hydrate formation conditions. Appl. Spectrosc., 60(2): 122-129. Lu, W.J., Guo, H.R., Chou, I.M., Burruss, R.C. and Li,
L.L., 2013. Determination of diffusion coefficients of carbon dioxide in water between 268 and 473 K in a high-pressure capillary optical cell with in situ Raman spectroscopic measurements. Geochim. Cosmochim. Ac., 115: 183-204.
May, A.D., Stryland, J.C. and Welsh, H.L., 1959. Raman Spectra of H2 and CH4 at High Pressures. J.
Chem. Phys., 30(4): 1099-1100.
Mullis, J., 1976. Das Wachstumsmilieu der Quarzkristalle im Val d'Illiez (Wallis, Schweiz). Schweiz. Mineral. Petrogr. Mitt, 56: 219-268.
Mullis, J., 1979. The system methane-water as a geologic thermometer and barometer from the external part of the Central Alps. B. Soc. Fr. Mineral. Cr., 102: 526-536.
Mullis, J., 1987. Fluid inclusion studies during very low-grade metamorphism. In: M. Frey (Editor), Low temperature metamorphism. Blackie, Glasgow, pp. 162-199.
Mullis, J., Dubessy, J., Poty, B. and O'Neil, J., 1994. Fluid regimes during late stages of a continental collision: physical, chemical, and stable isotope measurements of fluid inclusions in fissure quartz from a geotraverse through the Central Alps, Switzerland. Geochim. Cosmochim. Ac., 58(10): 2239-2267.
Mullis, J., Rahn, M.K., Schwer, P., De Capitani, C., Stern, W.B. and Frey, M., 2002. Correlation of fluid inclusion temperatures with illite" crystallinity" data and clay mineral chemistry in sedimentary rocks from the external part of the Central Alps. Schweiz. Mineral. Petrogr. Mitt, 82(2): 325-340.
Ong, A., Pironon, J., Robert, P., Dubessy, J., Caumon, M.-C., Randi, A., Chailan, O. and Girard, J.-P., 2013. In situ decarboxylation of acetic and formic acids in fluid inclusions as a possible way to produce excess CH4. Geofluids, 13(3):
298-304.
Pasteris, J.D., Wopenka, B. and Seitz, J.C., 1988. Practical aspects of quantitative laser Raman microprobe spectroscopy for the study of fluid inclusions. Geochim. Cosmochim. Ac., 52(5): 979-988.
Pironon, J., Canals, M., Dubessy, J., Walgenwitz, F. and Laplace-Builhe, C., 1998. Volumetric
reconstruction of individual oil inclusions by confocal scanning laser microscopy. Eur. J. Mineral., 10(6): 1143-1150.
Pironon, J., Grimmer, J.O.W., Teinturier, S., Guillaume, D. and Dubessy, J., 2003. Dissolved methane in water: temperature effect on Raman quantification in fluid inclusions. J. Geochem. Explor., 78-79(0): 111-115.
Price, L.C., 1981. Aqueous solubility of crude oil to 400°C and 2,000 bars pressure in the presence of gas. J. Petrol. Geol., 4(2): 195-223.
Ralchenko, Y., Kramida, A., Reader, J. and Team, N.A., 2011. NIST Atomic Spectra Database (version 4.1). National Institute of Standards and Technology, Gaithersburg, MD.
Ramsay, J.G., 1980. The crack-seal mechanism of rock deformation. Nature, 284: 135-139.
Schrötter, H.W. and Klöckner, H.W., 1979. Raman Scattering Cross Sections in Gases and Liquids. In: A. Weber (Editor), Raman Spectroscopy of Gases and Liquids. Topics in Current Physics. Springer Berlin Heidelberg, Berlin, pp. 123-166.
Seitz, J.C., Pasteris, J.D. and Chou, I.M., 1993. Raman spectroscopic characterization of gas mixtures. I. Quantitative composition and pressure determination of CH4, N2, and their mixtures.
Am. J. Sci., 293(4): 297-321.
Seitz, J.C., Pasteris, J.D. and Chou, I.M., 1996. Raman spectroscopic characterization of gas mixtures. II. Quantitative composition and pressure determination of the CO2-CH4 system. Am. J.
Sci., 296(6): 577-600.
Stalder, H.A. and Touray, J.C., 1970. Fensterquarze mit Methan-Einschlüssen aus dem westlichen Teil der schweizerischen Kalkalpen. Schweiz. Mineral. Petrogr. Mitt., 50(1): 109-130. Tarantola, A., Mullis, J., Guillaume, D., Dubessy, J., De
Capitani, C. and Abdelmoula, M., 2009. Oxidation of CH4 to CO2 and H2O by
chloritization of detrital biotite at 270 ± 5 ° C in the external part of the Central Alps, Switzerland. Lithos, 112(3): 497-510.
Tarantola, A., Mullis, J., Vennemann, T., Dubessy, J. and De Capitani, C., 2007. Oxidation of methane at the CH4/H2O-(CO2) transition zone in the
external part of the Central Alps, Switzerland: Evidence from stable isotope investigations. Chem. Geol., 237(3): 329-357.
Thiéry, R., Pironon, J., Walgenwitz, F. and Montel, F., 2000. PIT (Petroleum Inclusion Thermodynamic): a new modeling tool for the characterization of hydrocarbon fluid inclusions from volumetric and microthermometric measurements. J. Geochem. Explor., 69-70(0): 701-704.
Thiéry, R., Pironon, J., Walgenwitz, F. and Montel, F., 2002. Individual characterization of petroleum fluid inclusions (composition and P-T trapping conditions) by microthermometry and confocal
laser scanning microscopy: inferences from applied thermodynamics of oils. Mar. Petrol. Geol., 19(7): 847-859.
Tissot, B.P. and Welte, D.H., 1978. Petroleum formation and occurrence: a new approach to oil and gas exploration. Springer-Verlag, Berlin and New York, 538 pp.
Walrafen, G.E., 1962. Raman spectral studies of the effects of electrolytes on water. J. Chem. Phys., 36(4): 1035-1042.
Walrafen, G.E., 1964. Raman spectral studies of water structure. J. Chem. Phys., 40(11): 3249-3256. Walrafen, G.E., 1967. Raman spectral studies of the
effects of temperature on water structure. J. Chem. Phys., 47(1): 114-126.
Walrafen, G.E., 1971. Raman spectral studies of the effects of solutes and pressure on water structure. J. Chem. Phys., 55(2): 768-792. Wang, M., Lu, W.J. and De Vivo, B., 2012. In-situ
Raman spectroscopy study of iron sulfide minerals transformation at room temperature, GeoRaman 10, Nancy, France, pp. 219. Wang, X., Chou, I.M., Hu, W., Burruss, R.C., Sun, Q.
and Song, Y., 2011. Raman spectroscopic measurements of CO2 density: Experimental
calibration with high-pressure optical cell (HPOC) and fused silica capillary capsule (FSCC) with application to fluid inclusion observations. Geochim. Cosmochim. Ac., 75(14): 4080-4093.
White, S., 2010. Qualitative and quantitative analysis of CO2 and CH4 dissolved in water and seawater
using laser Raman spectroscopy. Appl. Spectrosc., 64(7): 819-827.