HAL Id: hal-01152939
https://hal-brgm.archives-ouvertes.fr/hal-01152939v2
Submitted on 24 Aug 2015HAL is a multi-disciplinary open access archive for the deposit and dissemination of sci-entific research documents, whether they are pub-lished or not. The documents may come from teaching and research institutions in France or abroad, or from public or private research centers.
L’archive ouverte pluridisciplinaire HAL, est destinée au dépôt et à la diffusion de documents scientifiques de niveau recherche, publiés ou non, émanant des établissements d’enseignement et de recherche français ou étrangers, des laboratoires publics ou privés.
Material flow analysis applied to rare earth elements in
Europe
Dominique Guyonnet, Mariane Planchon, Alain Rollat, Victoire Escalon,
Johann Tuduri, Nicolas Charles, Stéphane Vaxelaire, Didier Dubois, Hélène
Fargier
To cite this version:
Dominique Guyonnet, Mariane Planchon, Alain Rollat, Victoire Escalon, Johann Tuduri, et al.. Ma-terial flow analysis applied to rare earth elements in Europe. Journal of Cleaner Production, Elsevier, 2015, 26 p. �10.1016/j.clepro.2015.04.123�. �hal-01152939v2�
Material flow analysis applied to rare earth elements in Europe
Dominique Guyonnet a*, Mariane Planchon b, Alain Rollat c, Victoire Escalon b, Johann Tuduri a, Nicolas Charles a, Stéphane Vaxelaire a, Didier Dubois d, Hélène Fargier d
a
BRGM, ENAG, 3 avenue C. Guillemin, 45060 Orléans, France
b BIO by Deloitte, 132 Avenue Charles de Gaulle, 92200 Neuilly sur Seine, France c
SOLVAY Group, 26 rue Chef de Baie, 17041 La Rochelle Cedex 1, France
c
IRIT, Université Paul Sabatier, 118 route de Narbonne, 31062 Toulouse, France
Journal of Cleaner Production (In Press)
Abstract
This paper explores flows and stocks, at the scale of the European Union, of certain rare earth elements (REEs; Pr, Nd, Eu, Tb, Dy and Y) which are associated with products that are important for the decarbonisation of the energy sector and that also have strong recycling potential. Material flow analyses were performed considering the various steps along the value chain (separation of rare earth oxides, manufacture of products, etc.) and including the lithosphere as a potential stock (potential geological resources). Results provide estimates of flows of rare earths into use, in-use stocks and waste streams. Flows into use of, e.g., Tb in fluorescent lamp phosphors, Nd and Dy in permanent magnets and Nd in battery applications were estimated, for selected reference year 2010, as 35, 1230, 230 and 120 tons respectively. The proposed Sankey diagrams illustrate the strong imbalance of flows of permanent magnet REEs along the value chain, with Europe relying largely on the import of finished products (magnets and applications). It is estimated that around 2020, the amounts of Tb in fluorescent lamps and Nd in permanent magnets recycled each year in Europe, could be on the order of 10 tons for Tb and between 170 and 230 tons for Nd.
Key words:
Material flow analysis; MFA; Rare earth elements; REE1. Introduction
Several rare earth elements (REEs) are considered essential for the decarbonisation of the energy sector, as they are used in applications such as electric and hybrid vehicles, wind and solar energy or low-energy lighting. Moss et al. (2013) consider the following REEs as “critical”: dysprosium (Dy), europium (Eu), terbium (Tb), yttrium (Y), praseodymium (Pr) and neodymium (Nd). Metal criticality assessments combine importance for strategic sectors of the economy with risks of supply shortage (EC, 2014; Golev et al., 2014; Humphries, 2013; Graedel et al., 2012; DOE, 2011; NRC, 2008). International concern regarding the supply of REEs became particularly acute in the course of 2011, when metal prices exploded as a consequence of stricter quotas on Chinese exports. Over the 2005-2011 period, Chinese export quotas for raw rare earth oxides (REOs) decreased from approximately
65 000 tons to 30 000 tons REO. According to EUROSTAT (2014), the share of Chinese imports of raw rare earth products (metals, alloys, compounds) into Europe was close to 90% over this period. For e.g. Dy and Tb, peak prices in July 2011 (resp. 3 400 US$/Kg and 5 100 US$/Kg) exceeded early 2010 prices (at the onset of the price surge) by factors on the order of resp. 20 and 10. By June 2013, prices of Dy and Tb had decreased by approximately 80% with respect to 2011 peaks, as a result of several factors including the diversification of REE raw material supply sources.
Increased concern regarding the supply of mineral raw materials has led the European Commission to issue the Raw Materials Initiative (CEC, 2008) which highlights the importance of both primary (extracted) and secondary (reused, recycled) sources for supply. A key concept is resource efficiency, which aims at obtaining increased services per unit mass of resource consumed, while reducing environmental impacts. The complementarity between primary and secondary sources for meeting supply requirements is particularly important in the case of materials for which requirements are increasing, as is the case for REEs. As illustrated by, e.g., Grosse (2010), secondary sources alone cannot satisfy growing material requirements, due in particular to the delay induced by product lifetimes in the economy: resource availability from end-of-life products inevitably lags behind current requirements. Therefore any global (systemic) analysis of mineral raw material supply should consider both types of sources. A useful tool in such a context is material flow analysis (MFA).
Material Flow Analysis has been used for several decades to study in particular the flows and stocks of substances in the anthroposphere (see for example Wolfman, 1965; Ayres, 1989; Baccini and Brunner, 1991). The method has been applied extensively to the cycles of metals such as copper and zinc (Bertram et al., 2003; Graedel et al., 2004; Van Beers et al., 2005, 2007, Bader et al., 2011, Yan et al., 2013, Bonnin et al., 2013), steel (Reck et al., 2010; Hatayama et al., 2010; Park et al., 2011) or aluminium (Bertram et al., 2009). Wallsten et al. (2013) applied MFA to identify metal stocks and the potential for metal recovery from the urban mine at the scale of a city in Sweden. In recent years, MFA has been applied to critical metals and in particular to REEs (Du and Graedel, 2011a, 2011b, 2011c; Nansai et al., 2014; Rademaker et al., 2013; Talens Peiro et al., 2013). Application of the MFA approach to REEs has highlighted the relative paucity of available information regarding the content of REEs in products and content heterogeneity. As a result there has been an increasing number of studies aimed at measuring REE contents in various waste materials such as for example electrical and electronic equipment waste (WEEE; Westphal and Kuchta, 2013; Chancerel et al., 2013, Chancerel and Rotter, 2009; Rotter et al., 2013). Constantinides (2012) estimated the global demand for permanent magnets in different applications, in particular hard disk drives, hybrid and electric vehicles and wind power generators. Zepf (2013) dismantled hard disk drives and mobile phones to measure the weights of permanent magnets.
The main objective of this study is to provide a systemic view of flows and stocks of certain rare earth elements along the value chain in the European Union (EU), taking into account both primary and secondary sources. Such a global vision is particularly useful for identifying, e.g., the relative dependence on imports at various stages of the value chain, or losses and recycling potentials. The MFA methodology is applied and results are illustrated using Sankey diagrams (Brunner and Rechberger, 2004). Unlike previous MFA studies where the lithosphere is considered solely as a source (through mine production), the lithosphere is considered here as a potential stock. Therefore the study includes estimates of potential geological REE resources in Europe (as opposed to reserves in the sense of PERC, 2013). Because a specific objective is to identify recycling potentials for REEs, the selected approach combines REEs and certain applications. According to Binnemans et al. (2013), applications that are currently considered to hold the most potential for recycling are permanent
NdFeB magnets, nickel-metal hydride (NiMH) batteries and fluorescent lamps. Hence the REEs considered in this study are selected so as to combine criticality with direct relevance to the above-mentioned applications. These are Nd, Pr and Dy in permanent magnets, Nd and Pr in NiMH batteries and Eu, Tb and Y for phosphors in fluorescent lamps.
2. Methods
In any discussion of REEs it is important to distinguish between heavy and light REEs, because geological deposits of heavy REEs (HREEs) are far scarcer than deposits of light REEs (LREEs). It is reminded that in nature, rare earth deposits do not occur as individual rare earth oxides (e.g. Tb4O7
or Nd2O3) but as complex mixtures in minerals (such as bastnäsite). HREE-rich deposits currently in
operation are nearly exclusively limited to ion-exchange clay deposits in the south of China (Chi and Tian, 2008). For this reason, HREEs are often considered more “critical” than LREEs. This is not always true, however, because market demand may be such that a LREE (e.g., Nd in permanent magnets) may be considered far more critical than a HREE (e.g. Gd). Note that in LREE ores, the proportion of Nd compared to other light elements is relatively low (a typical distribution in ores is: 50% Ce, 20-25% La, 12-20% Nd and 4-5% Pr), which contributes to creating an imbalance between supply and demand (see Binnemans et al., 2013): in order to obtain Nd, approximately twice as much Ce and at least as much La must be produced. In this paper, we adopt the nomenclature of Wall (2014), who defines these two groups as follows (listed according to the order of the elements in the periodic table): LREE (La, Ce, Pr, Nd, Sm) and HREE (Eu, Gd, Tb, Dy, Ho, Er, Tm, Yb, Lu, including Y).
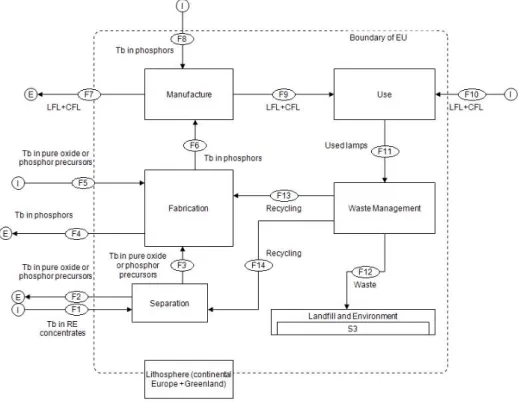
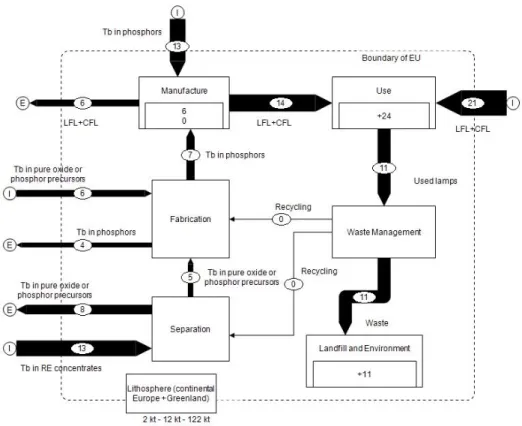
Figure 1 presents the system investigated for the case of REEs in fluorescent lamps. The system boundary (dashed line in Fig. 1) is the boundary of the EU. The system is divided into processes or steps along the value chain that are selected in order to (i) summarize major economic or industrial sectors, (ii) distinguish between REE-containing products for data collection in statistical databases (e.g. EUROSTAT, 2014) and (iii) comparison with previously published information (e.g., Du and Graedel, 2011a). The processes include separation of REO concentrates into individual REOs, fabrication of REE-based components (the phosphors), manufacture of products that incorporate these components (the lamps), use (U) of these products in the economy, management of end-of-life products and elimination of waste in landfills and dispersion in the environment. As seen in Fig. 1, there is a process (Lithosphere) that straddles the boundary of the system: for geological and economic reasons, it was chosen to study the lithosphere at the scale of continental Europe (including the Scandinavian shield, with the Kola Peninsula in Russia) and Greenland.
In the case of fluorescent lamps, the separation industry (i.e. Solvay in Europe) separates raw REO concentrates and produces precursor phosphors that are either exported within or outside Europe to industries that make the phosphor powders used to manufacture fluorescent lamps (linear fluorescent lamps; LFL and compact fluorescent lamps; CFL). Precursor phosphors have compositions that are analogous to those of lamp phosphors, but their mineral structure is not suited for use in lamps. Transformation from precursor to lamp phosphor is performed by dissolution/recrystallization at high temperature (1200 to 1700oC) and in a controlled atmosphere. The system investigated for Nd in permanent magnets differs from the one depicted in Fig. 1 in that an additional step is included between process Manufacture (of permanent magnets) and process Use, to include the incorporation of permanent magnets in applications (e.g., hard-disk drives, mobile phones, wind turbines, etc.). Also, waste streams may end up in Landfill and Environment but also in down-cycling applications such as the steel industry (from the elimination of used vehicles). A final sink considered
in the case of Nd in NiMH battery applications is down-cycling dispersion in cement factories, as slag from pyro-metallurgical treatment of old NiMH batteries is used in construction and/or aggregates for concrete. All Sankey diagrams in this paper were created using the STAN software (Brunner and Rechberger, 2004). Calculations were performed over a period in excess of one year of the expected lifetimes of the considered products (see below), in order to obtain estimates of in-use stocks. Year 2010 was selected as the reference year for the final Sankey diagrams, as this was the most recent year for which statistical data were available at the start of the study.
Figure 1. Description of the system investigated for REEs in fluorescent lamps.
Notes: Tb = Terbium, E = exports, I = imports, F1 = flow no 1, LFL = linear fluorescent lamp, CFL = compact fluorescent lamp
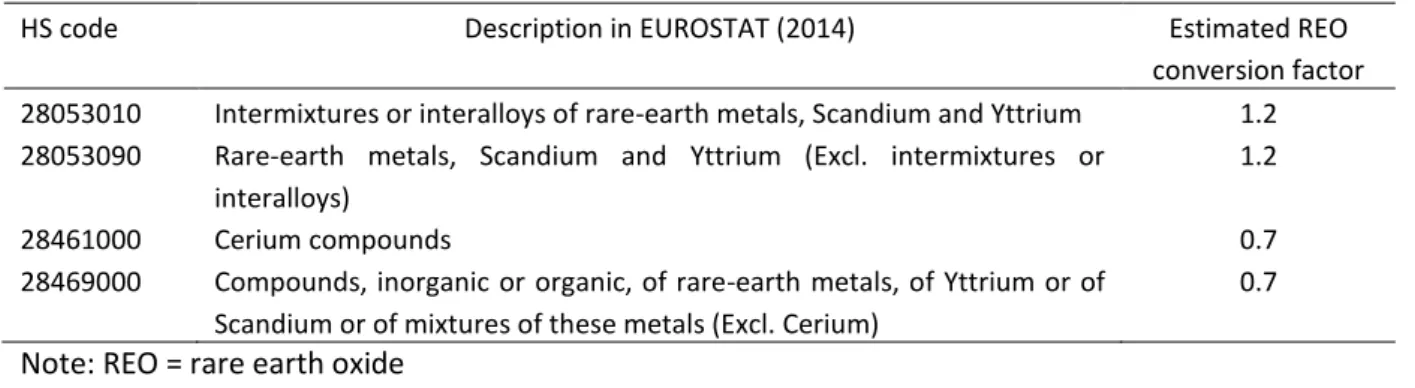
Sources of information for the MFAs include statistical data from EUROSTAT (production data from the ProdCom database and trade data from the ComExt database) and the Global Trade Atlas (GTA), BGS (2013), Roskill (2011) and data regarding (i) quantities of REEs in components used in applications, (ii) weights of these components in applications and (iii) quantities of applications sold or used per year as reported by manufacturers. Additional sources of information are referenced below in relation to specific flows. EUROSTAT and GTA databases identify products using the harmonized system (HS) codes of the World Customs Organization. Table 1 presents HS codes used in EUROSTAT for the upstream end of the REE value chain. As seen in this table, the codes are not sufficiently specific to identify individual REEs. China uses 8-digit codes for its exports and imports that are specific to individual REEs (e.g., 28053013 for Tb metal). But Chinese export data are only partial and don’t include illegal exports, which may constitute a significant portion (over 30%). Therefore these data are very useful for the purpose of cross-checking various sources of information but are not sufficient. In this study, customs data were taken from EUROSTAT when available. Chinese exports were taken from the Global Trade Atlas. It is worth noting that the accounting
method used in EUROSTAT may differ from that of GTA. There is for instance the so-called “Rotterdam effect”: if a EU country imports from, e.g., China and this import enters the EU at the port of Rotterdam, the import may be accounted for as a Netherlands import. Therefore EUROSTAT data are most consistent at the borders of the EU, while differences may appear when considering individual countries within the EU. Also, import data reported by a given country are generally more reliable than export data reported by that country, because there is more control on products entering a country than on exports. This highlights limitations of customs data and the importance of cross-checking information between different sources.
Table 1. Harmonized system (HS) codes for raw rare earth product imports and exports.
HS code Description in EUROSTAT (2014) Estimated REO
conversion factor 28053010 Intermixtures or interalloys of rare-earth metals, Scandium and Yttrium 1.2 28053090 Rare-earth metals, Scandium and Yttrium (Excl. intermixtures or
interalloys)
1.2
28461000 Cerium compounds 0.7
28469000 Compounds, inorganic or organic, of rare-earth metals, of Yttrium or of Scandium or of mixtures of these metals (Excl. Cerium)
0.7
Note: REO = rare earth oxide
The codes in Table 1 are the same as those used in Schüler et al. (2011). In the latter study, tons reported in EUROSTAT for each HS code were summed to obtain a total mass of REE compounds imported (e.g., 23013 tons in 2008). However, the products that correspond to these different codes do not have the same contents in terms of REOs. It is reminded that the mass conversion from REOs to REEs is a stoichiometric conversion based on the REO atomic formula (e.g., EU2O3, Tb4O7, Y2O3). On
average, conversion from REO to REE is obtained by multiplying by 0.85. In order to obtain estimates of European REO imports and exports, data by Hedrick (2004) and the USGS were analysed. Least-squares best-fit conversion factors were calculated based on reported quantities for each HS code and corresponding REO contents. The best-fit conversion factors are presented in Table 1. Application of these factors to EU imports in 2008 yields a total REO import of 16 800 tons. Application to data for 2010 yields 12 500 tons REO, a value close to that reported by POLINARES (2012) and Sievers and Tercero (2012): 10 000 tons. The difference is interpreted as due either to the inherent imprecision of available data, or to the correction introduced In this study to account for the fact that Treibacher (Austria), a significant player in the rare earth industry, no longer reports its data to EUROSTAT since 2008. Global Austrian import/export data reported in GTA (2014) or BGS (2013) were therefore disaggregated into intra- and extra-EU imports and exports, considering average ratios calculated based on Austrian import-export histories prior to 2009. Austrian imports of REOs from outside Europe were estimated as 3 140 tons in 2010, which could account for the difference mentioned above.
Because the objective of this study was to develop a systemic view of flows and stocks of individual REEs, initial estimates of individual REE imports as raw rare earth products were obtained by disaggregating the total REO flows using a methodology described in Goonan (2011). As a first step, the relative consumption of REOs by different market sectors in Europe was estimated in order to distribute total European REO imports between market sectors. Next, market sector total REO consumptions were converted to individual REO consumptions by considering the individual REO
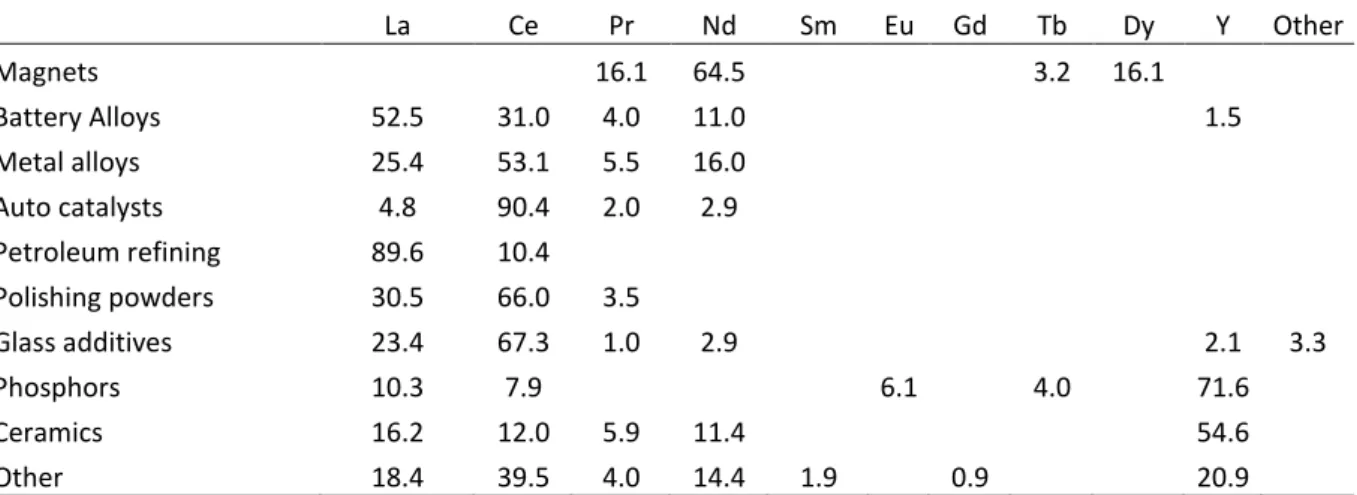
contents in products generated by these market sectors. Table 2 shows the estimated distribution of REO consumption among market sectors in Europe in 2010 (see also ERECON, 2015), while the distribution of individual REOs in products is presented in Table 3. The basis for Table 3 is LYNAS (2010), while the data appear in several publications (e.g. Jordens et al., 2013). Some changes were brought to the original tables, based on industry expert information (Solvay, pers. comm.). For example, while the table of LYNAS (2010) includes some Gd in the REE composition of permanent magnets, this does not seem consistent with current information. Also, the composition of phosphors in Table 3 is based on a typical trichromatic phosphor, i.e., a mixture of basic phosphors (see below).
Table 2. Estimate of REO consumption (as %) per market sector in Europe in 2010 (Solvay, pers. comm., modified after Guyonnet et al., 2013)
Magnets Alloys Automotive catalysts Fluid catalytic cracking Polishing powders Glass additives
Phosphors Ceramics Other
3.6 12.0 26.3 15.6 6.6 18.0 6.0 6.0 6.0
Table 3. Relative proportions (base 100) of individual REOs in market sector products (modified from LYNAS, 2010) La Ce Pr Nd Sm Eu Gd Tb Dy Y Other Magnets 16.1 64.5 3.2 16.1 Battery Alloys 52.5 31.0 4.0 11.0 1.5 Metal alloys 25.4 53.1 5.5 16.0 Auto catalysts 4.8 90.4 2.0 2.9 Petroleum refining 89.6 10.4 Polishing powders 30.5 66.0 3.5 Glass additives 23.4 67.3 1.0 2.9 2.1 3.3 Phosphors 10.3 7.9 6.1 4.0 71.6 Ceramics 16.2 12.0 5.9 11.4 54.6 Other 18.4 39.5 4.0 14.4 1.9 0.9 20.9
Application of the disaggregation method to global mine production in 2007 (124000 tons REO; USGS, 2014) yields results that are compared to estimates based on ore compositions, presented in Du and Graedel (2011a). Figure 2 suggests that the disaggregation method yields satisfactory results for most REEs. Results are not shown for Gd and Sm however, as the disaggregation method yields values that are much lower (resp. 610 and 440 tons) than those presented in Du and Graedel (2011a): 2400 tons for both elements. This would imply that mine production of Gd and Sm is much higher than consumption by industrial sectors (as suggested in Table 3). This interpretation is confirmed by information from the REE industry according to which Gd and Sm are stockpiled. Therefore the Sankey diagrams presented in Du and Graedel (2011a) for Sm and Gd should be considered with caution. While the disaggregation method yields satisfactory results at the global scale, its approximate nature should be underlined and also that uncertainty increases as the scale of application decreases (e.g., the scale of a single country). The issue of uncertainty in the performed MFAs is addressed further below.
Figure 2. Global rare earth element (REE) production in 2007. Comparison between results of the disaggregation method and estimates from Du & Graedel (2011a).
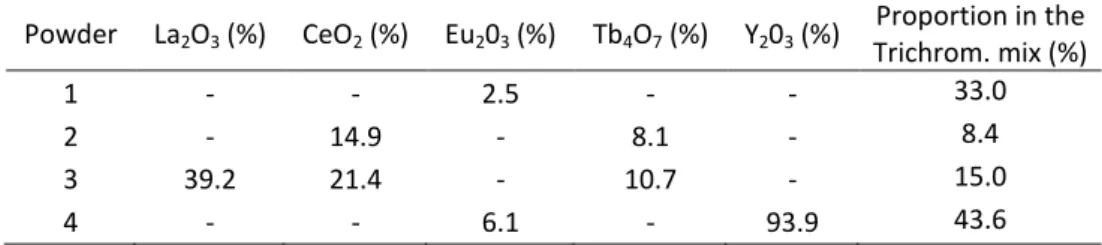
The flows associated with the imports and exports of the phosphor powders (Fabrication step in Fig. 1) were quantified on the basis of the quantities exchanged under HS code 320650. The trichromatic powders used in fluorescent lamps are a mixture of several phosphor powders containing REOs: Powder 1; LaPO4:Ce3+,Tb3+ or Powder 2; (Ce,Tb)MgAl11O19, which provide the green
color to the lighting, Powder 3; BaMgAl11O17:Eu2+, used for the blue color, and Powder 4; Y2O3:Eu3+,
for the red color. The compositions and relative proportions in the trichromatic mix are presented in Table 4. Based on this information, Eu, Tb and Y contents in trichromatic powders are calculated as, respectively, 3%, 2% and 32%. The flows associated with the imports and exports of fluorescent lamps from the “Manufacture” step in Fig. 1 (CFL: compact fluorescent lamps and LFL: linear fluorescent lamps) were estimated based on the quantities exchanged under, resp., codes 31501510 and 31501530. Each lamp contains approximately 2 g of trichromatic phosphor powder. Additions to in-use stock were estimated based on time-series of flows and taking into account lifetimes of products in the economy. For LFL and CFL lamps, an estimated lifetime of 6 years was selected based on statistics from Recylum (2010), a company that recycles used lamps and WEEE. The in-use stocks were therefore estimated based on the apparent consumptions of CFL and LFL between 2005 and 2010, while the waste flow in 2010 was estimated from the apparent consumption during 2004. Note that this estimation suffers from uncertainty regarding the evolution of the composition of phosphor powders in fluorescent lamps between 2004 and 2010. The management of waste from fluorescent lamps was straightforward in 2010, since no recycling was performed at that time (Solvay, pers. comm.) and therefore all the waste flows were assumed to be eliminated (landfill and the environment).
Table 4. Composition and average relative proportions of phosphor powders in the trichromatic mix (Solvay, pers. comm.)
Powder La2O3 (%) CeO2 (%) Eu203 (%) Tb4O7 (%) Y203 (%) Proportion in the Trichrom. mix (%) 1 - - 2.5 - - 33.0 2 - 14.9 - 8.1 - 8.4 3 39.2 21.4 - 10.7 - 15.0 4 - - 6.1 - 93.9 43.6 100 1 000 10 000 100 000 La Ce Pr Nd Eu Tb Dy Y T on s R EE
Du & Graedel (2011a) Based on Goonan (2011)
Regarding Nd in NdFeB permanent magnets and nickel-metal hydride (NiMH) batteries, the analysis considered the rare earth composition of products. In many cases, the Nd in magnets is coupled with Pr for economic and technical reasons: a mixture called “didymium” is used, with an average composition of 76% (by weight) Nd and 24% Pr. Nickel-metal hydride batteries are composed of a nickel-based cathode, an electrolyte and an anode of mischmetal made of a mixture of REEs (La, Ce, Nd, Pr). NiMH batteries can be subdivided into portable batteries and industrial batteries used for example in hybrid electric vehicles (HEV). NiMH batteries currently dominate the HEV market (approximately 70% of the batteries used in HEVs in 2015), but they are progressively being replaced by lithium-ion batteries (AMADEE, 2009). Recycling processes for NiMH batteries have been developed (Müller and Bernd, 2006) but in 2010 (reference year of this study) there was no recycling of Nd at an industrial scale. In the value chain for permanent magnets and NiMH batteries, the Fabrication steps involve the production of, resp., NdFeB alloy and LaNi5 alloy, while the
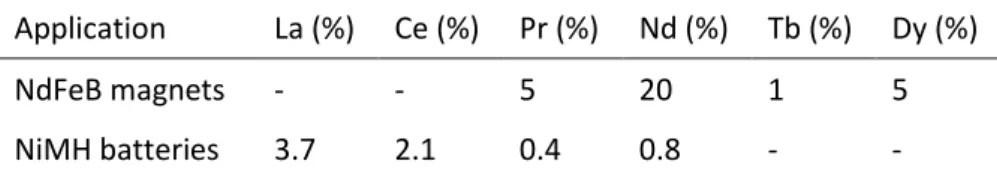
Manufacture steps produce NdFeB permanent magnets and NiMH batteries. In the chain for permanent magnets, we considered an additional step where magnets are incorporated into applications. The typical REE contents of NdFeB magnets and NiMH batteries are indicated in Table 5 but, as shown in the following section, composition may vary from one application to another. Table 5. Typical REE content in NdFeB magnets and NiMH batteries (weight percent; Du and Graedel, 2011b; Solvay, pers. comm.)
Application La (%) Ce (%) Pr (%) Nd (%) Tb (%) Dy (%)
NdFeB magnets - - 5 20 1 5
NiMH batteries 3.7 2.1 0.4 0.8 - -
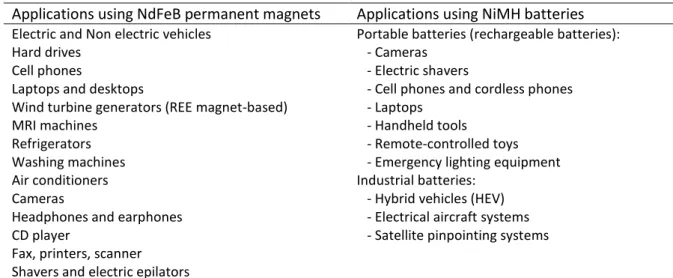
Information relative to production, imports and exports of products and applications containing permanent magnets and batteries was obtained from EUROSTAT (using, resp., codes 85051100, 85051990 and 85078020). Further down the value chain (Application and Use steps), data regarding production and trade was collected for the manufactured products containing permanent magnets and NiMH batteries listed in Table 6. While it can be seen in Table 6 that this study considered a significant number of applications, results (next section) show that only a few applications account for the bulk of Nd flows (Du and Graedel, 2011b, Rademaker et al., 2013). Rare earth contents and market shares of these products were obtained from specialized or company reports (Roskill, 2011; BIO IS, 2010; Peiro et al., 2011; Buchert et al., 2012; Westphal et al., 2013; Benecki et al., 2010; IDC, 2014; Rademaker et al., 2013; Avicenne, 2011; ADEME, 2012). Market updates regarding external hard disk drives and mobile phones were obtained from IDC (2010). Information on the European markets of imaging equipment containing permanent magnets (printers, copiers, scanner, facsimile machines) was obtained from Fraunhofer (2007), while Recharge (2013) provided information on the rechargeable battery market. Average lifespans of products considered for the estimation of additions to in-use stock and total in-use stock in 2010 were taken as 7 years for NiMH portable batteries, 3 years for laptops and 13 years for vehicles (see Du & Graedel, 2011c).
Table 6. Neodymium-containing applications considered in this study
Applications using NdFeB permanent magnets Applications using NiMH batteries
Electric and Non electric vehicles Portable batteries (rechargeable batteries):
Hard drives - Cameras
Cell phones - Electric shavers
Laptops and desktops - Cell phones and cordless phones
Wind turbine generators (REE magnet-based) - Laptops
MRI machines - Handheld tools
Refrigerators - Remote-controlled toys
Washing machines - Emergency lighting equipment
Air conditioners Industrial batteries:
Cameras - Hybrid vehicles (HEV)
Headphones and earphones - Electrical aircraft systems
CD player - Satellite pinpointing systems
Fax, printers, scanner Shavers and electric epilators
The analysis of potential geological resources was based on an investigation of information relative to current mining operations, reports from mineral exploration companies, from European geological surveys and scientific publications. In continental Europe and Greenland, REE occurrences can be found in a broad range of geological settings and their concentration and distribution in minerals depend on rock-forming, hydrothermal, weathering and other surface processes. Additional information on the applied methodology can be found in Charles et al. (2013). Information on exports to Europe of REOs by the Russian Solikamsk Magnesium Plant, which pre-treats the ore from the Lovozero igneous complex in the Kola Peninsula, was obtained from MetalResearch (2013) and Roskill (2011). These exports are imported by Estonia: until 2012, the company Silmet (now a member of the Molycorp group) was the only European company separating Nd for magnet applications. Chakhmouradian and Wall (2012) and Linnen et al. (2014) discuss in detail the behaviour of REEs in the geochemical cycle and the deposit characteristics. In this study, primary REE deposits of continental Europe and Greenland were broadly divided into two main categories: i) endogenous REE deposits (related to essentially magmatic and metamorphic processes) and ii) exogenous REE deposits (concentrated by surficial processes such as sedimentary and weathering processes). Close to 400 geological occurrences or deposits located within the EU, expanded to the Kola Peninsula, Turkey and Greenland, were assessed. The mineralogical characteristics of these deposits and occurrences provide information regarding potential resources, the reliability of which depends largely on the state of progress of mineral exploration projects.
A basic characteristic of data used in MFAs and in particular in MFAs applied to REEs is uncertainty. The first approach used for tackling the problem of data uncertainty was to look for consistency between various sources. A particularly useful source for this purpose is the data of Du and Graedel (2011a) on global flows and stocks of REEs. Combined with knowledge of relative market shares in Europe with respect to the rest of the world, it is possible to establish whether estimates are consistent or not with previously published data. A second approach for addressing uncertainty in MFA is data reconciliation. Due to uncertainty, MFAs oftentimes do not balance and data reconciliation serves to adjust estimates such that mass conservation is respected. Common practice in MFA for data reconciliation is least-squares minimization, whereby flows and/or stocks are assumed to be represented by normal probability distributions (defined by average values and standard deviations). Reconciliation is obtained by minimizing sums of squares of differences
between estimated and reconciled flows, weighted by their respective standard deviations (see e.g., Narasimhan and Jordache, 2000). One difficulty with this approach in the context of MFA is due to the fact that the choice of single probability distributions for describing the uncertain flows or stocks is difficult to justify on a statistical basis: available data are typically related to scarce measurements, expert judgment, literature data, etc. Such information is more faithfully described by the nested intervals known as fuzzy sets (Dubois and Prade, 1988). Therefore as part of this study, a methodology was developed for reconciling MFA data under fuzzy constraints (see Dubois et al., 2014, 2013) and was applied to the collected data. The Sankey diagrams presented below are best estimates (or preferred values) which result from this data processing while indications are provided below regarding uncertainty ranges of specific flows. An additional and essential step for addressing uncertainty in this study was consistency verification through confrontation of obtained results with industry experts.
3. Results
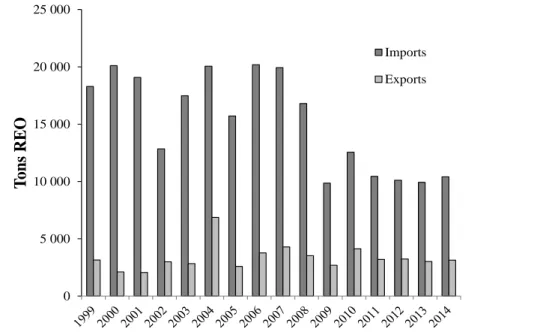
3.1 Trends of EU rare earth oxide imports and exports
Figure 3 shows estimated imports and exports of REOs, into and out of the EU, based on EUROSTAT data and taking into account a correction for Austrian post-2008 imports and exports. The significant decrease of imports observed over the 2008-2011 period is interpreted as an effect of the economic crisis. In 2010, approximately 85% of these imports came from China, while in 2011 EUROSTAT data suggest that a significant proportion of rare earth imports came from the U.S. (around 30%). This is interpreted as largely an effect of the acquisition of Silmet (Estonia) by Molycorp (USA) in April 2011 and the export of REOs by Molycorp to Estonia for treatment.
Figure 3. European imports and exports of rare earth oxides based on EUROSTAT (2014) and GTA (2014) for Austria post-2008 correction. Modified after Guyonnet et al. (2013).
0 5 000 10 000 15 000 20 000 25 000 T o ns R EO Imports Exports
3.2 Potential geological rare earth resources in Europe
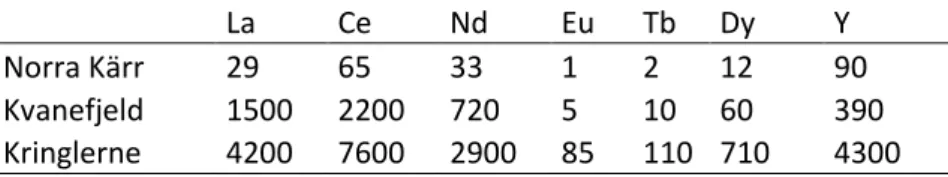
Endogenous rare earth deposits (related to deep geological processes) are broadly associated with alkaline-peralkaline igneous rocks and carbonatites. But REE minerals may also be associated with pegmatites, skarns, Fe oxide-phosphate deposits and certain types of hydrothermal veins. REE deposits associated with alkaline-peralkaline rocks are relatively medium-grade (<2% REO) although they are commonly enriched in HREEs. In continental Europe, the Kola Peninsula exhibits the two well-known Khibina and Lovozero alkaline complexes (Sorensen, 1997; Downes et al., 2005 ; Arzamastsev et al. 2006), with total resources in excess of 3 Gt ore with an average ore grade of 0.7% REO (Eilu et al., 2007; Korsakova et al., 2012). But peralkaline intrusions such as Norra Kärr in Sweden constitute new projects for REE mining in Europe. The Norra Kärr intrusion, represented by a nepheline syenite, contains a total mineral resource of 58 Mt ore at 0.59% REO (Gates et al., 2013). In carbonatites, REEs are mainly represented by LREE enrichment in minerals such as bastnäsite, allanite, apatite or monazite. Carbonatites in the Fennoscandian shield represent a potential on the order of a few hundred million tons of ore, with average grades between 0.5% and 1% REO (Korsakova et al., 2012; Lie and Ostergaard, 2014). Close to the Permian Oslo rift, the Larvik-Langesundfjord region exhibits numerous pegmatites with REE-bearing minerals. Although contents are lower, REEs are also observed within the magnetite-apatite deposits of the Kiruna district (Frietsch and Perdahl, 1995) in northern Sweden. The Swedish company LKAB is currently examining how to recover REEs from tailings at the Kiruna and Malmberget operations (Perez, 2011). In Greenland, endogenous deposits or occurrences are mainly related to the Gardar alkaline complexes (Sorensen et al., 2011). Located in South Greenland, the Gardar Province encompasses peralkaline complexes that exhibit occurrences with potentially future world-class REE deposits, such as the Kvanefjeld (620 Mt at 1.06 % REO coupled with uranium resources) and Kringlerne (4300 Mt at 0.65% REO) deposits in the Ilímaussaq intrusion (Steenfelt, 2012; Technology Metals Research, 2014). However, the future of such projects will obviously be subject to strict environmental and social acceptability constraints (Jenkins and Yakovleva, 2006). A major issue is the uranium and thorium contents of the ores. According to ERECON (2014), U and Th contents in the Kringlerne ore are respectively 30 and 88 ppm, values that are significantly higher than those reported for the Norra Kärr ore: 14 and 7 ppm respectively.
Exogenous deposits (related to surficial geological processes) are mainly the result of remobilization during weathering and sedimentary processes: (palaeo)placers, phosphorites, REE-bearing clays and laterites. Placer deposits are accumulations of heavy minerals in sands and gravels by gravity separation during sedimentary processes. Main REE-bearing minerals are monazite (with or without xenotime), fergusonite, florencite, euxenite, allanite and loparite. In Western Europe these palaeoplacers are mainly represented by grey monazite enriched in medium-weight REEs (Sm, Eu, Gd), zircon and rutile (Burnotte et al., 1989; Tuduri et al., 2013). Weathering processes lead to the breakdown of many rock-forming minerals, the leaching of certain elements (Mg, Ca) and the residual enrichment of less mobile elements (Fe, Al). Thus weathering of initially REE-enriched rocks (e.g. carbonatite) can provide residual REE deposits (e.g. laterites, bauxite) with new minerals (e.g. phosphates such as monazite) and high-grades (> 5-10% REO). REE-bearing clays, called ion-adsorption clays (Chi and Tian, 2008) are low-grade deposits (0.03-0.35% REO) but are HREE-rich. Such deposits are often associated with weathered igneous rocks, where REE are adsorbed by clay minerals such as kaolin. In Europe they are related to bauxite deposits in the Balkans and in Greece or in the south of France (Charles et al., 2013; Deady et al., 2014).
In summary, in continental Europe the Baltic shield and its remote Kola Peninsula constitute the main areas with the strongest geological potentials for endogenous deposits (magmatic and hydrothermal). South Greenland shows the best potential for developing “giant” mining projects, but as mentioned previously, environmental constraints and social acceptance will be strong limiting factors. Exogenous deposits are lacking in Greenland, while in Europe they represent a potential of lesser interest. To-date, it appears that the most advanced exploration target in Europe, including Greenland, is the rare earth and zirconium Norra Kärr project, investigated by Tasman Metals since 2009. It has a total REE resource evaluated at 285000 tons, with a heavy versus total REO ratio of approximately 50%. The Norra Kärr project has recently received authorization to operate and is at a pre-feasibility stage. The Kvanefjeld and Kringlerne deposits in Greenland have total resources evaluated at 5.4 Mt and 24 Mt REE, respectively, with heavy versus total REO ratios of 12% and 30%. Estimates of potential geological resources for selected REEs and for these three projects, which have been well evaluated during the past decade (e.g. Gates et al., 2013), are presented in table 7.
Table 7. Estimates of rare earth element potential geological resources for three projects (one in the EU and two in Greenland). Values in kilotons REE.
La Ce Nd Eu Tb Dy Y
Norra Kärr 29 65 33 1 2 12 90
Kvanefjeld 1500 2200 720 5 10 60 390
Kringlerne 4200 7600 2900 85 110 710 4300
3.3 Sankey diagrams
Figure 4 shows the Sankey diagram for Tb in fluorescent lamp applications in 2010. Starting the description at the upstream end of the value chain, it is seen that the process Lithosphere is not connected to any other process, as there exists to-date no mining activity in continental Europe and Greenland that contributes Tb to industry in Europe. While mining activity in the Kola Peninsula contributes Nd to the EU, via Silmet in Estonia (see Fig. 6), this company does not separate Tb, a market which is addressed by Solvay. Numbers indicated below process Lithosphere are potential geologic resources that correspond to the three projects indicated in Table 7. The first number corresponds to Norra Kärr alone, while the following two numbers sum up, respectively, the estimates for Kvanefjeld and Kringlerne. As mentioned previously, the first number is the most realistic in terms of future production in the short and medium term. Raw rare earth oxide concentrates for making phosphors enter Europe as imports and are separated by Solvay using solvent extraction methods. Precursor phosphors are produced which then serve to make the trichromatic phosphors used in fluorescent lamps. Based on expert information, it is considered that there are virtually no stocks that accumulate annually within processes Separation or Fabrication. There exists, however, a historical stock of several thousand tons of REOs at Solvay’s plant in La Rochelle (France). But the company started to recycle this stock after 2010, thus generating a few hundred tons per year of light rare earths (La, Ce, Pr and Nd) and a few tons per year of Tb and Dy (Solvay, pers. comm.). Also, losses of Tb at steps Separation and Fabrication are considered to be relatively negligible.
Figure 4. Sankey diagram for fluorescent lamp-related terbium in the EU (reference year 2010). Values in tons of Tb metal unless indicated otherwise.
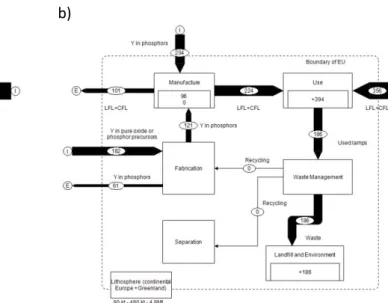
The manufacture of fluorescent lamps requires imports of phosphors from within and outside the EU. The stock of 6 tons indicated in process Manufacture corresponds to an estimated security stock of trichromatic phosphors, while flows in and out of Manufacture do not result in any addition to stock. Addition to stock occurs in process Use, where a stock increase of 24 tons is estimated for 2010. The total stock in-use stock is not shown in Fig. 4 as it cumulates uncertainties related to each year. However, an in-use stock of Tb related to fluorescent lamps in the EU is estimated to be on the order of 140 tons for 2010. End-of-life fluorescent lamps are collected and enter the waste management step, but in 2010 they end up in elimination (landfill or incineration) as there was no recycling of fluorescent lamp phosphors in Europe at that time. Therefore the “recycling” arrows in Fig. 4 indicate zero recycling. In 2012, Solvay launched two recycling units in France to recycle fluorescent lamps. The Saint-Fons plant (near the city of Lyon) preconditions the powders extracted from the used lamps and sends them to Solvay’s plant in La Rochelle to be separated into individual REOs (La, Ce, Eu, Tb, Gd, Y), using solvent extraction methods. In 2014, the order of magnitude of recycled Tb was a few tons per year. Sankey diagrams for Eu and Y in trichromatic phosphors (Fig. 5) can be deduced from Fig. 4 by applying the following conversion factors : Eu/Tb = 1.5 and Y/Tb = 16.6 and noting that in 2010 there were no separation activities in the EU for Eu and Y in fluorescent lamp applications (Solvay, pers. comm.).
a) b)
Figure 5. Sankey diagrams for fluorescent lamp-related europium (a) and yttrium (b) in the EU (reference year 2010). Values in tons of metal unless indicated otherwise.
Figures 6 and 7 show Sankey diagrams for Nd in the European economy in 2010 for, respectively, permanent magnet and NiMH battery applications. Unlike diagrams shown for phosphor REEs, the diagrams in Figs. 6 and 7 display a significant imbalance between the upstream and downstream regions of the value chain. While Europe is a major importer of products containing Nd magnets (HDDs, etc.), in 2010 Silmet in Estonia was the only company separating mixtures of REOs to produce Nd for magnet applications. Based on data from MetalResearch (2013), Roskill (2011) and Zaitsev et al. (2014), we estimate that approximately 220 tons Nd were separated by Silmet for magnet applications in 2010, while the resulting Nd compounds were primarily exported outside Europe. Silmet does not separate Nd for battery applications. For the Fabrication step, Europe relies mainly on imports. Approximately 220 and 30 tons were imported in 2010 for the fabrication of, resp., NdFeB alloy and LaNi5 alloy. The intra-EU flow estimates of these intermediate products range in the
same order of magnitude: about 180 tons and 30 tons respectively, suggesting that intra-EU trade is favored with respect to extra-EU exports at the Fabrication step. We estimate a 2010 flow of 220 tons Nd in magnets manufactured within the EU. This value is consistent with an estimate of 1500 tons of NdFeB magnets produced annually in Europe (Germany and Finland; F. Vial, pers. comm.). Neodymium flows into process Use in the EU, for magnets and batteries, are respectively 1200 and 120 tons. Taking into account the history of flows into use in the EU over a period exceeding the expected average lifetimes of products containing permanent magnets and NiMH batteries, in-use stocks for Nd in 2010 were estimated as, respectively, 16000 and 600 tons, while the additions to in-use stock in 2010 were estimated as, respectively, 290, and 50 tons. The management of waste from permanent magnets and batteries was straightforward in 2010 since no industrial recycling of Nd existed in Europe at that time. Therefore all Nd contained in the waste flows was either eliminated or down-cycled (dissipative uses) in industry, such as the steel or cement industry.
Figure 6. Sankey diagram for Nd in permanent magnet applications in 2010 in the EU. Values in tons of Nd metal unless indicated otherwise.
Figure 7. Sankey diagram for Nd in NiMH battery applications in 2010 in the EU. Values in tons of Nd metal unless indicated otherwise.
The MFA for Nd in permanent magnets can be used to obtain a MFA for Dy by considering the proportion of Dy versus Nd in permanent magnets for different applications. While Table 5 provides average values for NdFeB magnets, specific applications may have different Dy/Nd ratios following the service temperature for which the applications are designed. Dysprosium is used to increase magnetic coercivity; i.e., a measure of a magnet’s ability to withstand an external magnetic field without becoming demagnetized. For common applications such as HDDs, CD players, head phones, etc., the proportion of Dy in magnets is close to 2%, whereas in hybrid electric vehicle motors, where higher temperatures can be expected, the proportion is closer to 10%. An approximate relationship between Nd and Dy in permanent magnets can be obtained from: Nd(%) = 0.24 - 0.88 Dy(%) (F. Vial, pers.comm.). A MFA for Dy in permanent magnets is shown in Fig. 8. As indicated, there were no separation activities in the EU for Dy in 2010. The total flow into use (intra-EU flow and imports) is approximately 230 tons Dy. Note that the diagram in Fig. 6 can also serve to obtain estimates for Pr in permanent magnet applications, considering the relative proportion of Pr versus Nd (76% Nd, 24% Pr).
Figure 8. Sankey diagram for Dy in magnet applications in 2010 in the EU. Values in tons of Dy metal unless indicated otherwise.
4. Discussion
In-use stocks of Tb, Eu and Y in fluorescent lamp phosphors were estimated to be approximately 140, 200 and 2300 tons respectively (Table 8). These numbers can be compared to global in-use stocks estimated by previous authors. The values presented by Du and Gradel (2011a, 2011c) for world in-use stocks in 2007 are: 700, 400 and 6900 tons respectively. With respect to Nd in permanent magnets, the flow of Nd into “Use” (Fig. 6) is around 1230 tons (intra-EU flow + imports), a number that is approximately three times larger than the estimate of Rademaker et al. (2013) for year 2011
(400 tons). This is explained by the fact that these authors considered 3 main applications of NdFeB magnets (hybrid and electric vehicles, wind power, hard disk drives), whereas this study takes into account a larger variety of products containing NdFeB magnets and in particular non-electric vehicles. According to Roskill (2011), non-electric vehicles typically contain approximately 250 g NdFeB magnets per vehicle. The flow of Nd into use is broken down into its different components, in terms of applications in Fig. 9a, while Fig. 9b shows the detail of Nd imported into use. Figure 9a suggests that non-electric vehicles form the bulk of the flow and explain the difference with estimates of Rademaker et al. (2013): If non-electric vehicles are omitted, we obtain 480 tons which compares favorably with their estimate. As seen in these figures, while the flow of Nd from hybrid electric vehicles produced in the EU in 2010 was negligible (Fig. 9a), it was more significant (8%) in imports (Fig. 9b). This was also observed in the MFA for Nd in batteries: there was no production of HEVs in Europe in 2010 but around 20% of Nd comes from NiMH batteries in imported HEVs. The flow of Dy into use (230 tons Dy) is also higher than the estimate of Rademaker et al. (2013); approximately 70 tons in 2011, for the same reason as for Nd. The total flow (magnets and batteries) of Nd into use; 1350 tons Nd, can be compared to the global flow into use of 19000 tons in 2007 estimated by Du and Graedel (2011a) based on mine production (the latter flow should cover all possible applications of Nd). For Dy, the global flow estimated by these authors is 1100 tons. The Nd in waste flows is estimated to be 570 tons for permanent magnets and 70 tons for batteries. The 2010 waste stream of 570 tons of Nd in permanent magnet applications is broken down into various contributions in Fig. 10. Again, non-electric vehicles appear as the primary contributor (around 65%), followed by desktop computers.The in-use stock of Nd related to magnet applications was estimated to be approximately 16000 tons, a number that can be compared to the global stock of Nd in permanent magnets estimated by Du & Graedel for 2007 (62600 tons; Du and Graedel, 2011b). In-use stock of Dy related to magnet applications in the EU is estimated around 2800 tons, while Du and Graedel (2011b) estimate a global in-use stock in 2007 of 15700 tons Dy. These different estimates are consistent, in terms of orders of magnitude, considering the share of the EU in the global economy (25.9% in 2010).
Table 8. Synthesis of specific flows and stocks in Europe (year 2010). Values in tons metal.
Lamps Magnets Batteries
Tb Eu Y Nd Pr Dy Nd Pr
Flow into use 35 55 580 1 230 310 230 120 50
a) b)
Figure 9. Distribution of flows of Nd in permanent magnets among specific applications: intra-EU flow of Nd from Application to Use (872 tons in Fig. 6) (a) and imports to Use (354 tons in Fig. 6) (b)
Figure 10. Distribution of Nd flow from Use to Waste Management (575 tons in Fig. 6) among the main applications considered in the MFA for Nd in permanent magnet applications
The Sankey diagrams presented above underline the potential for recycling REEs in Europe, considering the magnitudes of in-use stocks and waste streams. Du & Graedel (2011b) suggest that if the actual in-use stock of Nd in permanent magnets were efficiently recycled, it could provide a valuable supplement to geological stocks: in 2007, the global in-use stock amounted to almost four times the annual Nd extraction rate for that year. According to Rademaker et al. (2013), by 2030 it should be possible to meet around 10% of Nd demand in the EU through the recycling of magnets from electric vehicles, wind turbines and hard disk drives. The recycling of HDDs is also considered by Sprecher et al. (2014) as the easiest pathway towards large-scale recycling of neodymium. But as underlined by ERECON (2015), several challenges need to be addressed in order to significantly increase the amount of recycling. The first challenge is to increase selective collection of end-of-life
Non electric vehicles 80% Wind turbines 13% Desktops 5% Other 2% Laptops 24% Printers & scanners 16% Non electric vehicles 12% Hard Drive Disk
10% Wind turbines 8% Electric vehicles 8% Cameras 6% Desktops 5% Fridges 4% Other 7% Non electric vehicles 64% Desktops 12% Printers & scanners 8% Laptops 8% CD players 5% Other 3%
products containing REEs. Also, progress in the area of eco-conception is required in order to facilitate the dismantling of products for the recovery of REEs and other substances. And metallurgical processes need to be further developed for the recovery of REEs from waste materials (Verhoef et al., 2004). This challenge is particularly acute for the recovery of Nd from permanent magnets, due to the material’s chemical state (an alloy rather than an oxide; ERECON, 2015).
The situation of recycling in the EU will be influenced by future developments in the area of primary resources. Comparing the magnitude of flows in the European economy with geological potentialities indicated under the process Lithosphere in the Sankey diagrams above, suggests that should one mining project enter production (the most likely candidate being Norra Kärr in Sweden), there would be a significant influence on the supply of several REEs. Considering current resource evaluations, we estimate that the development of the Norra Kärr project could result in the supply of approximately 20 tons/yr Tb and 1000 tons/yr Nd. Such production will incite the industries that perform the separation of mixed rare earth oxides in Europe (Solvay and Silmet) to increase their capacity. This in turn will increase their ability to recycle rare earths from waste materials. As mentioned above, the company Solvay already recycles rare earths from the phosphors in used florescent lights. In partnership with the company Umicore, Solvay also recycles rare earths from used batteries. Rare earths are recycled from magnets but only at the magnet production stage and not from waste materials, because current separate collection does not allow sufficient levels of rare earth concentrations. Based on projections of recycling following separate collection in 2020 (Solvay, pers. comm.), we estimate that around 10 tons Tb could be recycled each year in Europe and between 170 and 230 tons Nd, following whether a new major mining project outside China enters production.
With respect to the future destination of the additional separated Tb in Europe, it will probably be exported outside Europe due to the current development of LED lamps which contain much less (or no) rare earths. LED lamps contain quantities of REEs on the order of a few hundreds of micrograms (essentially Y), while the REE content of compact fluorescent lamps is at least three orders of magnitude higher. It is therefore anticipated that the price of Tb could decrease in the future, making Tb a viable substitute for Dy in permanent magnets for high-temperature applications. A pending question is Eu: with the progressive phasing out of fluorescent lamps and because the nearly exclusive application of Eu is red phosphor, it is likely that Eu will be in excess in coming years. In the case of Nd, demand in Europe is so important that it cannot be satisfied solely by European sources. While recycling will continue to increase, with separate collection as an essential limiting factor, there will continue to be imports from primary sources located outside Europe, with a diversification of supply sources (from the U.S.; Mountain Pass, or Australia; Mount Weld) in order to balance Chinese monopoly.
As mentioned previously, values indicated in the proposed Sankey diagrams are best estimates based on available (and sometimes conflicting) information. An uncertainty analysis was performed using the data reconciliation methodology proposed by Dubois et al. (2014). Table 9 shows the estimated ranges around the best estimates for some REE flows. These ranges represent upper and lower bounds of the intervals of values considered most realistic based on available information. The interval limits are typically between 10 and 50% of the best estimate values. Because flows of Dy and Eu or Y were derived from those of, resp., Nd in magnets and Tb in phosphors, based on magnet and phosphor compositions, the flows for these elements are not shown in Table 9 because they were not estimated independently.
Table 9. Estimated uncertainty ranges for several REE flows
Manufacture to Use Imports to Use Use to Waste Waste to L&E
Min BE Max Min BE Max Min BE Max Min BE Max
Nd magnets 780 872 960 320 354 390 520 576 630 150 165 180
Nd batteries 28 35 46 75 84 95 64 69 71 52 55 57
Tb phosphors 8 14 16 10 21 30 9 11 13 9 11 13
Notes: BE = best estimate; L&E = Landfill & Environment; Values in tons metal
5. Conclusions
This paper presents an analysis of flows and stocks of certain rare earth elements along the value chain in Europe. The association of primary sources (extracted or potentially extractible) and secondary sources (related to waste streams) in the analysis, provides a comprehensive picture thatcan help identify the complementarity between the two types of sources for supply. For example for Tb, Nd and Dy, the analysis suggests that in 2010, waste streams out of use were approximately 10, 580 and 70 tons respectively. Such flows could contribute significantly to supply in Europe, provided they are captured by separate collection. The analysis of potential primary sources suggests that around 2020, at least 20 tons/year Tb and 1000 tons/year Nd could be supplied from the extractive industry within Europe. The increased capacity generated by the need to separate the mixed concentrates will also benefit recycling. Projections for recycled flows around year 2020 for Tb and Nd in permanent magnets are on the order of, resp., 10 tons per year and between 170 and 230 tons per year.
The proposed analysis provides a somewhat “reassuring” picture with respect to the future supply of certain REEs since, on the one hand, there are opportunities for recycling these elements by capturing waste streams and, on the other hand, there are also geological potentialities. However, tensions could resume if mining projects outside China came to a halt due to the low metal prices induced by Chinese competition. While recycling technologies must be developed for recovering REEs, such processes should focus on REEs for which there will really be pressure in the future. Given the importance of the permanent magnet industry, pressure on Nd, Pr and Dy will most likely remain, despite current efforts to reduce the quantities of Dy used in magnets (Yan et al., 2010). The availability of light rare earths such as Ce or La is not really an issue, due to the excess of these elements in typical LREE ores. Nor is there particular pressure on Gd and Sm, as they are not much used in the industry, with the result that stocks are building up in the separation industry.
Given the large uncertainties regarding the development of new mining projects, the contribution to supply of secondary (recycled) sources will continue to increase in the future. For this to be achieved, collection of products containing rare earths must be improved as well as the separation of the components containing the rare earths, so that they can be processed. It should be stressed that securing the supply of REEs requires efforts at each stage of the value chain: not just in terms of supplying raw materials containing REEs, but also in terms of maintaining the industrial capacity to process the REEs and to build components and applications that use them (Verhoef et al., 2004). Also, further developments are required in MFA in order to better incorporate the characteristics of the flows (material qualities, heterogeneities, metal liberation factors, etc.; Van Schaik and Reuter,
2010). This would help to convert potential resources, as indicated by MFAs such as those presented herein, into economically recoverable reserves in the sense of PERC (2013).
Acknowledgments
The material presented herein was developed within the ASTER project, supported by the French National Research Agency; ANR (project ANR-11-ECOT-002). Many thanks to William Zylberman, Sarah Si-Ahmed and Guillaume Furet, for their contributions to the data mining, to Jean-François Labbé for his syntheses of rare earth prices and to Fernand Vial for sharing his expertise regarding permanent magnets. We also thank the anonymous reviewers for helpful corrections and suggestions.
References
ADEME, 2012. “Piles et accumulateurs”. Batteries and accumulators. ADEME 2011 annual report, Angers, France, 92 pp. (in French).
AMADEE, 2009. Lithium-ion and nickel-metal hydride batteries, Lithium, rare earth Lanthanum and the future of hybrid electric vehicles, plug-in hybrid electric vehicles and electric vehicles - Global markets, technologies and opportunities: 2009-2020 analysis and forecasts. AMADEE & Company Inc., Bay Harbor Island, USA, 95 pp.
Arzamastsev, A.A., Bea, F., Arzamastseva, L.V., Montero, P., 2006. Proterozoic Gremyakha-Vyrmes Polyphase Massif, Kola Peninsula: An example of mixing basic and alkaline mantle melts. Petrology 14, 361-389.
Avicenne, 2011. The portable rechargeable battery market (PRB) in Europe 2008-2015. Avicenne Development, Puteaux, France, 49 pp.
Ayres, R.U., 1989. Industrial metabolism technology and environment. National Academy Press, Washington, DC.
Baccini, P., Brunner, H.P., 1991. Metabolism of the anthroposphere. Springer, New York.
Bader, H.P., Scheidegger, R., Wittmer, D., Lichtensteiger, T., 2011. Copper flows in buildings, infrastructures and mobiles: a dynamic model and its application to Switzerland. Clean Techn. Environ. Policy 13, 87-101.
Benecki, W., Clagett, T. Trout, S., 2010. Permanent magnets 2010-2020: A comprehensive overview of the global permanent magnet industry. Walter T. Benecki (Ed.), 400 pp.
BIO IS, 2010. “Potentiel de recyclage des métaux rares“. The recycling potential of rare metals. BIO IS Report, Paris, France, 220 pp. (in French).
Bertram, M., Martchek, K.J., Rombach, G., 2009. Material flow analysis in the aluminium industry. Journal of Industrial Ecology 13(5), 650-654.
Bertram, M., Graedel, T.E., Fuse, K., Gordon, R., Lifset, R., Rechberger, H., Spatari, 2003. The copper cycles of European countries. Reg. Environ. Change 3, 119-127.
Binnemans, K., Jones, P.T., Blanpain, B., Van Gerven, T., Yang, Y., Walton, A., Buchert, M., 2013. Recycling of rare earths: a critical review. Journal of Cleaner Production 51, 1-22.
BGS, 2013. European Mineral Statistics 2007-11. A product of the world mineral statistics database. British Geologival Survey, Keyworth, Nottingham, UK, 345 pp.
Bonnin, M., Azzaro-Pantel, C., Pibouleau, L., Domenech, S., Villeneuve, J. 2013. Development and validation of a dynamic material flow analysis model for French copper cycle. Chemical Engineering Research and Design, 91(8):1390–1402.
Brunner, P.H., Rechberger, H., 2004. Practical Handbook of Material Flow Analysis. Lewis Publishers. Buchert, M., Manhart, A., Bleher, D., Pingel, D., 2012. Recycling critical raw materials from waste
electronic equipment. Öko-Institut Report, Darmstadt, Germany, 80 pp.
Burnotte, E., Pirard, E., Michel, G., 1989. Genesis of gray monazites; evidence from the Palaeozoic of Belgium. Economic Geology 84, 1417-1429.
CEC, 2008. The raw materials initiative – meeting our critical needs for growth and jobs in Europe. Commission of the European Communities, COM 699, Brussels.
Chakhmouradian, A.R., Wall, F., 2012. Rare Earth Elements: Minerals, Mines, Magnets (and More). Elements 8, 333-340.
Chancerel, P., Rotter, V.S., Ueberschaar, M., Marwede, M., Nissen, N.F., Lang, K.D., 2013. Data availability and the need for research to localize, quantify and recycle critical metals in information technology, telecommunication and consumer equipment. Waste Management and Research 31(10), 3-16.
Chancerel, P., Rotter, V.S., 2009. Recycling-oriented characterization of small waste electrical and electronic equipment. Waste Management 29, 2336-2352.
Charles, N., Tuduri, J., Guyonnet, D., Melleton, J., Pourret, O., 2013. Rare earth elements in Europe and Greenland: a geological potential? An overview, in: Jonsson, E.e.a. (Ed.), Proceedings of the 12th Biennial SGA Meeting, Uppsala, Sweden, pp. 1698-1701.
Chi, R., Tian, T., 2008. Weathered crust elution-deposited rare earth ores. Nova Science Publishers, Inc, New York.
Constantinides, S., 2012. The demand for rare earth materials in permanent magnets. Arnold Magnetics Publication, 15 pp. Available at:
http://www.google.fr/url?url=http://www.arnoldmagnetics.com (accessed 23.09.14).
Deady, E., Mouchos, E., Goodenough, K., Williamson, B., Wall, F., 2014. Rare-earth elements in karst-bauxites: a novel untapped European resources? In: ERES2014 - 1st European Rare Earth Resources Conference, Milos, Greece.
DOE, 2011. Critical materials strategy. U.S. Department of Energy Report, December 2011.
Downes, H., Balaganskaya, E., Beard, A., Liferovich, R., Demaiffe, D., 2005. Petrogenetic processes in the ultramafic, alkaline and carbonatitic magmatism in the Kola Alkaline Province: A review. Lithos 85, 48-75.
Du, X., Graedel, T.E., 2011a. Uncovering the global life cycles of the rare earth elements. Scientific Reports 1(145): 1-4.
Du, X., Graedel, T.E., 2011b. Global rare earth in-use stocks in NdFeB permanent magnets. Journal of Industrial Ecology 15(6): 836-843.
Du, X., Graedel, T.E., 2011c. Global in-use stocks of the rare earth elements: a first estimate. Environ. Sci. & Technol. 45, 4096-4101.
Dubois, D., Fargier, H., Guyonnet, D., Ababou, M., 2014. A fuzzy constraint-based approach to data reconciliation in material flow analysis. International Journal of General Systems 43(8), 787-809. Dubois, D., Fargier, H., Guyonnet, D., 2013. Data reconciliation under fuzzy constraints in material
flow analysis. EUSFLAT-2013. Eighth conference of the European Society for Fuzzy Logic and Technology, September 11-13, Milano, Italy.
Dubois, D., Prade H., 1988. Possibility theory: an approach to computerized processing of uncertainty. Plenum Press, New York.
EC, 2014. Report on critical raw materials for the EU. Report of the ad-hoc Working Group on defining critical raw materials. European Commission, May 2014.
Eilu, P., Hallberg, A., Bergman, T., Feoktistov, V., Korsakova, M., Krasotkin, S., Lampio, E., Litvinenko, V., Nurmi, P.A., Often, M., Philippov, N., Sandstad, J.S., Stromov, V., Tontti, M., 2007. FODD - Fennoscandian ore deposit database, Geolocial Survey of Finland (GTK), Geological Survey of Norway (NGU), Geological Survey of Sweden (SGU), Russian Geological Research Institute (VSEGEI). Online database available at: http://en.gtk.fi/informationservices/databases/fodd. (Accessed May 6 2014).
ERECON, 2015. Strengthening the European rare earths supply-chain. A report by the European Rare Earths Competence Network (ERECON). Accessed via:
http://prometia.eu/wp-content/uploads/2014/06/ERECON-report_web.pdf
EUROSTAT, 2015. Your key to European statistics. European Commission. Accessed via: http://epp.eurostat.ec.europa.eu
Fraunhofer, 2007. EuP Preparatory Studies “Imaging Equipment” (Lot 4). Final Report on Task 2 “Economic and Market Analysis”. Fraunhofer Institute for Reliability and Microintegration, Berlin, 75 pp.
Frietsch, R., Perdahl, J.-A., 1995. Rare earth elements in apatite and magnetite in Kiruna-type iron ores and some other iron ore types. Ore Geology Reviews 9, 489-510.
Gates, P., Horlacher, C.F., Reed, G., 2013. Amended and restated preliminary economic assessment N1 43-101 technical report for the Norra Kärr (REE-Y-Zr) deposit, Gränna, Sweden. Runge Pincock Minarco Limited, 170 pp.
Golev, A., Scott, M., Erskine, P.D., Ali, S.H., Ballantyne, G.R., 2014. Rare earths supply chains: Current status, constraints and opportunities. Resources Policy, 41, 52-59.
Goonan, T.G., 2011. Rare earth elements – End use and recyclability. U.S. Geological Survey Scientific Investigations Report No 2011-5094, 15 pp.
Graedel, T.E., Barr, R., Chandler, C., Chase, T., Choi, J., Christoffersen, L., Friedlander, E., Henly, C., Jun, C., Nassar, N.T., Schechner, D., Warren, S., Yang, M.Y., Zhu, C., 2012. Methodology of metal criticality determination. Environ. Sci. Technol. 46, 1063-1070.
Graedel, T.E., van Beers, D., Bertram, M., Fuse, K., Gordon, R.B., Gritsinin, A., Kapur, A., Klee, R.J., Lifset, R.J., Memon, L., Rechberger, H., Spatari, S., Vexler, D., 2004. Multilevel cycle of anthropogenic copper. Environ. Sci. Technol. 38, 1242-1252.
Grosse, F., 2010. Is recycling “part of the solution”? The role of recycling in an expanding society and a world of finite resources. S.A.P.I.EN.S. 3(1), 1-17.
GTA, 2014. Global Trade Information Services. Accessed via: https://www.gtis.com/gta
Guyonnet, D., Dubois, D., Escalon, V., Fargier, H., Rollat, A., Schuster, R., Si-Ahmed, S., Tuduri, J., Zylberman, W., 2013. Material flow analysis for identifying rare earth element recycling potentials in the EU. In: Proceedings Sardinia 2013, Fourteenth International Waste Management and Landfill Symposium. Cagliari, Italy: CISA Publisher.
Hatayama, H., Daigo, I., Matsuno, Y., Adachi, Y., 2010. Outlook of the world steel cycle based on the stock and flow dynamics. Environ. Sci. Technol. 44, 6457-6463.
Hedrick, J.B., 2004. Rare Earths. U.S. Geological Survey Minerals Yearbook - 2004.
Humphries, M., 2013. Rare earth elements: the global supply chain. CRS Report for Congress, Congressional Research Service Report R41347, Washington, USA, 27 pp.