HAL Id: inserm-03237058
https://www.hal.inserm.fr/inserm-03237058
Submitted on 26 May 2021
HAL is a multi-disciplinary open access
archive for the deposit and dissemination of
sci-entific research documents, whether they are
pub-lished or not. The documents may come from
teaching and research institutions in France or
abroad, or from public or private research centers.
L’archive ouverte pluridisciplinaire HAL, est
destinée au dépôt et à la diffusion de documents
scientifiques de niveau recherche, publiés ou non,
émanant des établissements d’enseignement et de
recherche français ou étrangers, des laboratoires
publics ou privés.
linked to an individualized temporal increase in fecal
propionate
N. K. Nguyen, E. C. Deehan, Z. Zhang, M. Jin, N. Baskota, M. E.
Perez-Muñoz, J. Cole, Y. E. Tuncil, B. Seethaler, T. Wang, et al.
To cite this version:
N. K. Nguyen, E. C. Deehan, Z. Zhang, M. Jin, N. Baskota, et al.. Gut microbiota modulation
with long-chain corn bran arabinoxylan in adults with overweight and obesity is linked to an
indi-vidualized temporal increase in fecal propionate. Microbiome, BioMed Central, 2020, 8 (1), pp.118.
�10.1186/s40168-020-00887-w�. �inserm-03237058�
R E S E A R C H
Open Access
Gut microbiota modulation with long-chain
corn bran arabinoxylan in adults with
overweight and obesity is linked to an
individualized temporal increase in fecal
propionate
Nguyen K. Nguyen
1†, Edward C. Deehan
1†, Zhengxiao Zhang
2, Mingliang Jin
1,3,4, Nami Baskota
1,
Maria Elisa Perez-Muñoz
1, Janis Cole
1, Yunus E. Tuncil
5,6, Benjamin Seethaler
7, Ting Wang
8, Martine Laville
9,
Nathalie M. Delzenne
10, Stephan C. Bischoff
7, Bruce R. Hamaker
6, Inés Martínez
1, Dan Knights
11,12, Jeffrey A. Bakal
8,
Carla M. Prado
1and Jens Walter
1,13,14*Abstract
Background: Variability in the health effects of dietary fiber might arise from inter-individual differences in the gut microbiota’s ability to ferment these substrates into beneficial metabolites. Our understanding of what drives this individuality is vastly incomplete and will require an ecological perspective as microbiomes function as complex inter-connected communities. Here, we performed a parallel two-arm, exploratory randomized controlled trial in 31 adults with overweight and class-I obesity to characterize the effects of long-chain, complex arabinoxylan (n = 15) at high supplementation doses (female: 25 g/day; male: 35 g/day) on gut microbiota composition and short-chain fatty acid production as compared to microcrystalline cellulose (n = 16, non-fermentable control), and integrated the findings using an ecological framework.
Results: Arabinoxylan resulted in a global shift in fecal bacterial community composition, reducedα-diversity, and the promotion of specific taxa, including operational taxonomic units related to Bifidobacterium longum, Blautia obeum, and Prevotella copri. Arabinoxylan further increased fecal propionate concentrations (p = 0.012, Friedman’s test), an effect that showed two distinct groupings of temporal responses in participants. The two groups showed differences in compositional shifts of the microbiota (p≤ 0.025, PERMANOVA), and multiple linear regression (MLR) analyses revealed that the propionate response was predictable through shifts and, to a lesser degree, baseline composition of the microbiota. Principal components (PCs) derived from community data were better predictors in
(Continued on next page)
© The Author(s). 2020 Open Access This article is licensed under a Creative Commons Attribution 4.0 International License, which permits use, sharing, adaptation, distribution and reproduction in any medium or format, as long as you give appropriate credit to the original author(s) and the source, provide a link to the Creative Commons licence, and indicate if changes were made. The images or other third party material in this article are included in the article's Creative Commons licence, unless indicated otherwise in a credit line to the material. If material is not included in the article's Creative Commons licence and your intended use is not permitted by statutory regulation or exceeds the permitted use, you will need to obtain permission directly from the copyright holder. To view a copy of this licence, visithttp://creativecommons.org/licenses/by/4.0/. The Creative Commons Public Domain Dedication waiver (http://creativecommons.org/publicdomain/zero/1.0/) applies to the data made available in this article, unless otherwise stated in a credit line to the data.
* Correspondence:jenswalter@ucc.ie
†Nguyen K. Nguyen and Edward C. Deehan contributed equally to this work. 1
Department of Agricultural, Food & Nutritional Science, University of Alberta, Edmonton, AB T6G 2E1, Canada
13Department of Biological Sciences, University of Alberta, Edmonton, AB
T6G 2E1, Canada
(Continued from previous page)
MLR models as compared to single taxa, indicating that arabinoxylan fermentation is the result of multi-species interactions within microbiomes.
Conclusion: This study showed that long-chain arabinoxylan modulates both microbiota composition and the output of health-relevant SCFAs, providing information for a more targeted application of this fiber. Variation in propionate production was linked to both compositional shifts and baseline composition, with PCs derived from shifts of the global microbial community showing the strongest associations. These findings constitute a proof-of-concept for the merit of an ecological framework that considers features of the wider gut microbial community for the prediction of metabolic outcomes of dietary fiber fermentation. This provides a basis to personalize the use of dietary fiber in nutritional application and to stratify human populations by relevant gut microbiota features to account for the inconsistent health effects in human intervention studies.
Trial registration: Clinicaltrials.gov,NCT02322112, registered on July 3, 2015.
Keywords: Arabinoxylan, Dietary fiber, Gut microbiota, Inter-individual variability, Overweight adults, Short-chain fatty acids
Background
Epidemiologic studies consistently associate dietary fiber consumption with a reduced incidence of
obesity-associated pathologies [1,2]. In large-scale observational
studies, whole grains and cereal-derived fibers (e.g.,
ara-binoxylan and β-glucan) showed stronger associations
with reduced risk of developing cardiovascular disease, type II diabetes, gastrointestinal cancers, and of all-cause
mortality when compared to other fiber sources [3,4]. A
substantial body of animal research further consolidated the mechanisms by which fiber reduces metabolic
path-ologies [5]. Despite these convincing associations,
find-ings obtained from human dietary intervention trials aimed to improve metabolic risk markers by
supple-menting isolated dietary fibers remain inconsistent [6],
possibly due to an individualized clinical response [7,8].
Owing to their chemical structure, dietary fibers resist digestion in the small intestine and reach the colon where they become substrates for the gut microbiota. The microbial fermentation of fiber to short-chain fatty acids (SCFAs) has been implicated in the prevention of
obesity-associated pathologies [9]. Propionate and
butyr-ate are two SCFAs that are especially relevant, as they have been linked to beneficial immunological and
meta-bolic effects [10]. Intervention studies with arabinoxylan
isolated from wheat endosperm, for instance, have dem-onstrated increased fecal concentrations of both butyrate
and propionate [11]. Dietary fibers can further modulate
gut microbiota composition in a structure-dependent way through the enrichment of bacterial taxa that utilize the substrate and tolerate or benefit from the
environ-mental changes caused by fiber fermentation [5,12]. For
example, dietary interventions with short-chain fractions of arabinoxylan resulted in an enriched abundance of bacterial species that can either utilize arabinoxylan oli-gosaccharides (AXOS) directly (e.g., Bifidobacterium
adolescentis and Bifidobacterium longum) or benefit
from metabolic by-products released during AXOS deg-radation (e.g., Anaerobutyricum hallii and
Faecalibacter-ium prausnitzii) [13]. Although fiber-induced alterations
to the gut microbiota are significant, the effects are also
highly individualized [7], and this variability might have
clinical ramifications that could explain the individual-ized clinical responses [14].
To understand the individualized response of the gut microbiota to dietary fiber, an ecological perspective is required, as fiber fermentation is determined by complex inter-species interactions between members of the gut
microbiota [15]. The process is often based on a
cross-feeding cascade, where primary degraders that access the fiber provide break-down products (oligosaccharides, di-saccharides, and monosaccharides) to other microbes, and metabolites that result from the fermentation of
these products also serve as substrates [16].
Inter-individual variation in gut microbiota composition may
result from the absence of“keystone species” that initiate
the degradation of recalcitrant fibers [17], differences in
unrelated species with similar ecological functions that
compete for the same substrate [18], or variation in
strains of the same species that differ in their capacity to
metabolize the substrate [19]. These compositional
vari-ations likely determine both the competitive and co-operative relationships between community members that form trophic networks, some of which organize into
ecological “guilds” that collaborate to degrade complex
fibers [20]. Although inter-individual variation in the
re-sponse of the gut microbiota to fiber can influence me-tabolite outputs relevant to health (i.e., propionate or
butyrate) [21], this topic, and the underlying ecological
principles, have received little attention.
The objective of this study was to apply an ecological framework to characterize the compositional and meta-bolic responses of the human gut microbiota to a long-chain arabinoxylan isolated from corn bran compared to
a fiber that is not fermented by the gut microbiota (microcrystalline cellulose, MCC). We further assessed whether nutritional and microbiota-related factors could
explain the variable responses observed among
individuals.
Results
Subject characteristics and protocol adherence
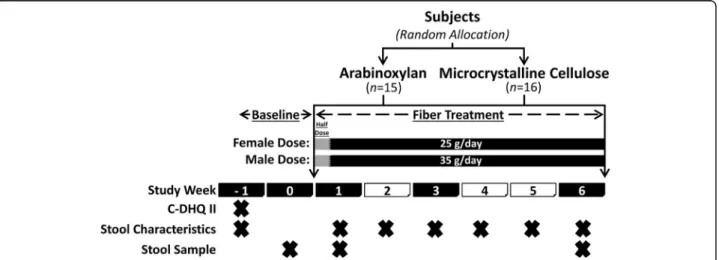
To compare the effects of arabinoxylan and MCC, we conducted a 6-week, parallel two-arm, exploratory, ran-domized controlled trial in individuals with overweight and class-I obesity, where females received 25 g/day and
males 35 g/day of either fiber (Fig.1). Of the 38 subjects
enrolled and randomized to an intervention arm, seven withdrew from the study (in the arabinoxylan group, three experienced challenges consuming the supplement and one reported constipation; in the MCC group, two withdrew due to personal reasons and one due to consti-pation) and were, therefore, excluded from analyses
(Additional file 1: Fig. S1). Subjects that completed the
study protocol (n = 31) included 21 females and 10 males, aged 32.9 ± 8.5 years with a body mass index
(BMI) of 28.7 ± 2.3 kg/m2. No differences in age, sex, or
BMI were detected between the intervention groups at
baseline (Additional file 2: Table S1). Overall, protocol
adherence, assessed by the amount (weight) of returned supplement, was 94.7 ± 6.5% and 95.0 ± 5.6% in the ara-binoxylan and MCC arms, respectively.
Effect on the composition of the fecal microbiota Fecal microbiota diversity
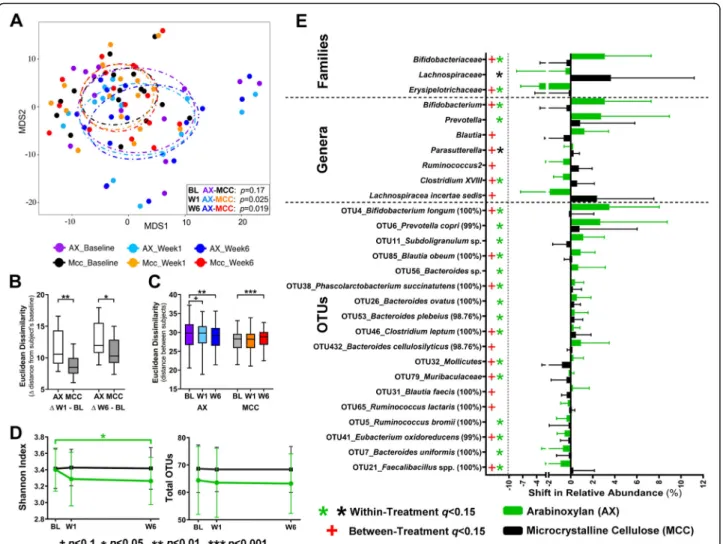
Non-metric multidimensional scaling analysis of Euclid-ean distances between subjects based on centered log-ratio (CLR)-transformed opelog-rational taxonomic unit (OTU) data showed that the two treatment groups
har-bored bacterial communities that could not be
differentiated at baseline (p = 0.17, permutational
multi-variate analysis of variance [PERMANOVA]; Fig. 2a).
One-week supplementation with arabinoxylan altered the global fecal bacterial community, which became sig-nificantly different from the fecal microbiota of subjects receiving MCC (p = 0.025). This effect was maintained until the end of the fiber intervention (p = 0.019). These changes occurred by arabinoxylan inducing temporal shifts in fecal microbiota composition, determined as the
average β-diversity between the individual’s treatment
and baseline samples, which were significantly larger
when compared to the MCC group (p ≤ 0.015 Mann–
Whitney test; Fig.2b). In addition, while MCC increased
inter-individual differences (β-diversity between subjects;
p< 0.001, generalized estimated equation [GEE] model),
arabinoxylan reduced it (p = 0.003, Fig.2c).
Analysis of α-diversity showed that arabinoxylan
re-duced fecal bacterial diversity (Shannon’s index) (p =
0.036, GEE model; Fig.2d) but not richness (total OTUs)
after 6 weeks of supplementation. Overall, these findings showed that while the non-fermentable MCC had no de-tectable effects on measures of bacterial diversity, arabi-noxylan altered the global bacterial community within 1 week, inducing temporal shifts in composition and a
re-duction of both inter-individual variation and
α-diversity.
Effect on the relative abundance of bacterial taxa and co-abundance response groups
Neither arabinoxylan nor MCC altered microbiota com-position at the phylum level. At lower taxonomic levels, changes in the relative abundance of two bacterial fam-ilies were detected at 6 weeks of arabinoxylan relative to baseline and MCC, namely an increase in
Bifidobacteria-ceae (q = 0.04, Wilcoxon test; Fig.2e, Additional file3:
Table S2) and a decrease in Erysipelotrichaceae (q =
Fig. 1 Study design. Shaded study week blocks indicate a scheduled clinic visit. The“X” indicates the task was completed during the study week. C-DHQ II, Canadian diet history questionnaire II; stool characteristics, self-reported stool consistency and bowel movement frequency
0.004). At the genus level, arabinoxylan increased the genera Bifidobacterium and Prevotella when compared to both baseline and MCC, and enriched Blautia when compared to MCC. OTU level analysis revealed that 15 OTUs changed during arabinoxylan treatment relative to
baseline (henceforth referred to as “significant OTUs”).
In particular, OTUs related to Bifidobacterium longum (OTU4), Prevotella copri (OTU6), Bacteroides plebeius (OTU53), Bacteroides sp. (OTU56), Bacteroides ovatus
(OTU26), Phascolarctobacterium succinatutens
(OTU38), Blautia obeum (OTU85), Subdoligranulum sp. (OTU11), Clostridium leptum (OTU46), Mollicutes (OTU32), and Muribaculaceae (OTU79) (q < 0.15)
became enriched, while OTUs related to Ruminococcus
bromii (OTU5), Eubacterium oxidoreducens (OTU41),
Bacteroides uniformis (OTU7), and Faecalibacillus spp.
(OTU21) declined in relative abundance. Supplementa-tion with MCC only increased the family
Lachnospira-ceae and the genus Parasutterella (q = 0.117).
Numerically, the dominant compositional effects of ara-binoxylan were, to a large degree, specific to B. longum (OTU4) and P. copri (OTU6), as these taxa increased in relative abundance by an average of 3.5% (46-fold) and
2.7% (4-fold), while other OTUs increased by≤ 1.1%.
In an attempt to identify groups of co-operating spe-cies that could function as ecological guilds in the
Fig. 2 Arabinoxylan alters the global composition of fecal bacterial communities and induces distinct shifts in taxa. a Non-metric
multidimensional scaling (NMDS) plot based on Euclidean distance metrics of arabinoxylan and microcrystalline cellulose groups at each time point (inter-subjectβ-diversity) showing changes in the distance between subjects over time. Euclidean distances b between fecal microbiotas of subjects at each study time point (inter-subject) and c between each subject’s fecal microbiota at baseline and during W1 and W6 of treatment (intra-subject). dα-Diversity (displayed as Shannon index and total OTUs) of the fecal microbiotas of subjects at each time point. e Absolute change (ΔW6–BL) in relative abundance of bacterial taxa affected by the dietary intervention. Data analyzed using PERMANOVA for a, GEE models (with Bonferroni correction) for b and d, and Mann–Whitney tests for c. For e, data were analyzed using either Wilcoxon tests to assess within-group changes relative to baseline, or Mann–Whitney tests to assess between-group changes (i.e., AX vs. MCC; with FDR correction). β-diversity and compositional data were reported as mean ± SD, and centered log-ratio transformed prior to the statistical analyses. BL baseline, OTU operational taxonomic unit, W1 week 1, W6 week 6
degradation of arabinoxylan, we adapted a clustering ap-proach conceptually similar to that described by Tong
et al. [22]. Instead of absolute proportions of taxa, we
used arabinoxylan-induced shifts to identify clusters of species whose responses were inter-correlated. This ana-lysis revealed a total of seven co-abundance response
groups (CARGs) (Fig.3a), five of which showed
statisti-cally significant responses to arabinoxylan, while none
responded to MCC (Additional file 3: Table S2). The
CARG that showed the largest increase in relative abun-dance was CARG1 (p = 0.0003, Wilcoxon test), which consisted of six out of the eleven OTUs that increased
through arabinoxylan (Fig.3b). Among those six OTUs,
B. longum (OTU4) exhibited the largest shift and showed significant connections to all but one member of
CARG1 (rs> 0.5, q < 0.05; Spearman’s correlations using
permutation tests), suggesting arabinoxylan may be de-graded through co-operative interactions between these
taxa. In CARG6, P. copri (OTU6) exhibited the largest response, but only showed one strong connection with another member of the CARG, Bacteroides massiliensis
(OTU98; rs = 0.71, q = 0.007), which suggests that P.
copri might act to a larger degree independently to
de-grade arabinoxylan (Fig. 3b). The majority of taxa that
decreased during arabinoxylan consumption, particularly B. uniformis (OTU7), clustered within CARG7 and showed negative correlations with taxa of CARG1, CARG2, and CARG6, suggesting competitive or antag-onistic interactions.
Temporal responses of OTUs and CARGs
To determine if short- and long-term treatment with arabinoxylan and MCC differed in their effects on the fecal microbiota, we compared shifts from baseline to week 1 (W1) with those from baseline to week 6 (W6); however, there were no detectable differences between
Fig. 3 Identification of co-abundance response groups (CARGs) during arabinoxylan supplementation. a Heatmap shows the change (ΔW6–BL) in relative abundance of 41 OTUs affected by arabinoxylan (p < 0.1, Wilcoxon test). The hierarchical dendrogram shows clustering of centered log-ratio (CLR) transformed OTUs (rows) based on Spearman’s correlation distances by the complete-linkage clustering algorithm, and then grouped on the dendrogram into seven CARGs by PERMANOVA (p < 0.05). Subjects (columns) clustered based on Euclidean distances. Colors from blue to red indicate the direction and magnitude of change. b Co-response network analysis. Each node represents an OTU, where the size is
proportional to the change (ΔW6–BL) in relative abundance, the shape indicates direction of change (positive: circle; negative: square), and the color references the respective CARG to which it was clustered. Lines between nodes represent significant positive (red line) or negative (blue line) Spearman’s correlations (rsvalues≥ 0.5 or ≤ − 0.5 and q values < 0.05). BL baseline, OTU operational taxonomic unit, W6 week 6
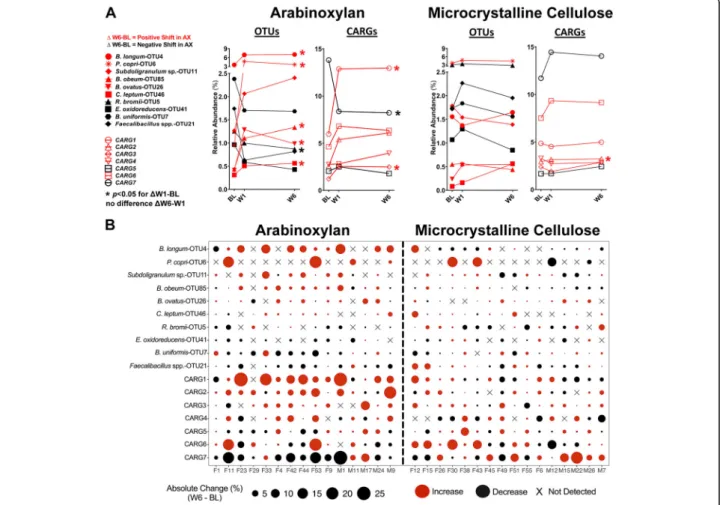
the two time frames (q > 0.25, Wilcoxon test, data not shown). In addition, comparison of baseline, W1, and W6 values by Friedman’s test indicated that the effects of arabinoxylan occur rapidly (within 1 week), with no
further detectable changes at 6 weeks (Fig. 4a).
Consid-ering these findings, analyses on compositional changes were performed with W6 data unless otherwise stated. Inter-individual variation in responses to arabinoxylan Bacterial shifts in response to arabinoxylan and their
magnitude were highly individualized (Fig. 4b). For
in-stance, absolute increases in relative abundance ranging from 5 to 13% (2- to 429-fold change) were detected in seven subjects for the OTU classified as B. longum (OTU4), while other subjects showed either a much
smaller increase, a decrease, or the species was undetect-able. OTUs related to B. obeum (OTU85),
Subdoligranu-lum sp. (OTU11), B. ovatus (OTU26), and C. leptum
(OTU46) were enriched by arabinoxylan in around two-thirds of the subjects. Less frequently enriched were OTUs classified as P. copri (OTU6), B. plebeius (OTU53), and Bacteroides sp. (OTU56). P. copri (OTU6) responded in only four subjects, but effects were large, with the species expanding beyond 10% (2- to 7-fold change) of the total bacterial community in three subjects.
To determine drivers of these individualized responses, we used multiple linear regression (MLR) analyses to test if responses in OTUs that showed, numerically, the largest shifts (P. copri, B. longum, B. obeum, and
Subdoli-Fig. 4 Temporal and individualized responses of the OTUs and CARGs affected by arabinoxylan and microcrystalline cellulose. a Plots show the temporal response of the ten most abundant OTUs (detected in > 25% of subjects) and the seven CARGs. Centered log-ratio transformed data were analyzed by Friedman’s test (with Dunn’s correction) to assess within-group changes between time points (i.e., ΔW1–BL and ΔW6–W1). b Bubble plot shows individualized differences (ΔW6–BL) in relative proportions of the ten most abundant OTUs (percentage of total microbiota composition) and CARGs (sum of OTUs) detected after 6 weeks of arabinoxylan and microcrystalline cellulose supplementation. The size of the bubble is proportional to the change in abundance relative to baseline, while the color of the bubble represents the direction of the change (red: increase; black: decrease). The“X” indicates that the OTU was either undetected or the change was < 0.02% relative abundance. BL baseline, CARG co-abundance response group, OTU operational taxonomic unit, W1 week 1, W6 week 6
granulum sp.) and in CARGs with significant responses (CARGs 1, 2, 3, 6, and 7) could be predicted by baseline diet or microbiota composition. Baseline microbiota (all OTUs and significant OTUs) and diet variables were first reduced in their dimensionality by principal compo-nent analysis (PCA) and then treated as predictors. This analysis revealed that individualized responses of bacter-ial taxa and CARGs to arabinoxylan and MCC could not be predicted by baseline diet or microbiota composition (q > 0.05; Additional file4: Fig. S2).
Effect on stool characteristics and bowel movements While fecal moisture content was not changed by either
fiber (q > 0.2, Wilcoxon test; Additional file5: Table S3),
subjects consuming arabinoxylan reported softer stool consistencies when compared to subjects consuming MCC (treatment effect p = 0.049, GEE model;
Add-itional file6: Fig. S3a). Both arabinoxylan and MCC led
to an increase in bowel movements relative to baseline
(p < 0.05, GEE model; Additional file 6: Fig. S3b), with
no difference detected between treatment groups (treat-ment effect p = 0.8).
Effect on fecal pH and SCFAs
Fecal pH and SCFA concentrations did not change after 6 weeks of either fiber treatment (q > 0.2, Wilcoxon test;
Additional file 5: Table S3). Considering that absolute
concentrations of fecal SCFAs are affected by their
ab-sorption in the gut [23], we additionally assessed
changes in the percentages of acetate, propionate, and butyrate relative to total SCFA concentrations at W6, which has been previously shown to vary little across
co-lonic regions [24]. This analysis revealed an increase in
the percentage of propionate produced through arabi-noxylan when compared to MCC (q = 0.07, Mann– Whitney test) and a reduction in the percentage of butyrate relative to baseline (q = 0.13, Wilcoxon test), al-though differences in butyrate were not detected when compared to MCC (q = 0.31). Further investigation of the ratio between propionate and butyrate showed an in-crease in propionate relative to butyrate when compared to baseline (q = 0.06) and MCC (q = 0.07), suggesting that arabinoxylan supplementation directed the output of SCFAs in favor of propionate.
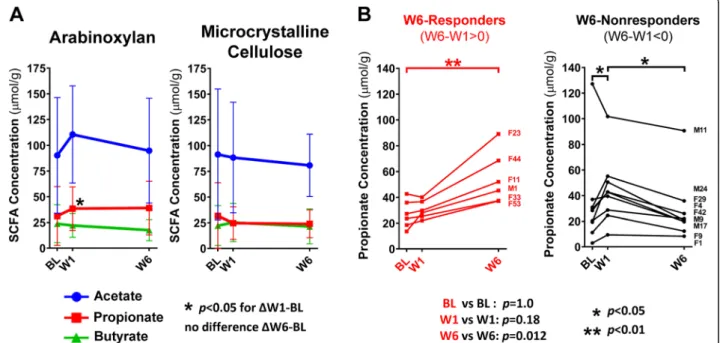
Characterization of the temporal response in the three primary SCFAs also showed an increase in fecal propi-onate concentrations by arabinoxylan at W1 (p = 0.01,
Friedman’s test) (Fig. 5a). Although propionate
concen-trations remained elevated at W6, this increase was not statistically significant when compared to baseline (p = 0.15). This loss of significance was caused by an increase
in the inter-individual variation at W6 (Fig. 5b). Visual
evaluation of the individualized temporal response of propionate to arabinoxylan revealed clear separation of
Fig. 5 Temporal and individualized output of fecal SCFAs in response to arabinoxylan and microcrystalline cellulose supplementation. a Line plots show the temporal response of acetate, propionate, and butyrate; reported as mean ± SD. b Individualized temporal propionate response of W6-responders (red) and W6-nonresponder (black) (grouped based onΔW6–W1). Data analyzed for a and b using Friedman test (with Dunn’s correction) to assess within-group changes between time points, and for b using Mann–Whitney tests to assess differences between-group at each time point. BL baseline, CARG co-abundance response group, OTU operational taxonomic unit, SCFA short-chain fatty acid, W1 week 1, W6 week 6
subjects into two distinct patterns (Fig.5b). Based on the direction of change from W1 to W6 (i.e., positive or
negative), subjects were grouped into “W6-responders”
(Δ W6–W1 > 0) and “W6-nonresponders” (Δ W6–W1 < 0). In general, W6-responders showed a higher output of propionate at W6 (p = 0.0045, Friedman’s test) but not at W1, while the opposite is seen in W6-nonresponders (p = 0.014). The two groups differed by propionate concentrations at W6 (p = 0.012, Mann– Whitney test).
W6-propionate responders and nonresponders differ in their microbiota response to arabinoxylan
Microbiota compositional (baseline and shifts) and diet data were ordinated using PCA, and then
differ-ences between W6-propionate responders and
nonresponders were tested using PERMANOVA. This analysis revealed that the bacterial communities of
W6-responders were indistinguishable from
W6-nonresponders at baseline but differed in their
re-sponse to arabinoxylan (ΔW6-baseline; Fig. 6). This
was detected if analysis was based on all OTUs (p = 0.004), the 15 significant diet-responsive OTUs (p = 0.025), or the seven CARGs (p = 0.025). In contrast,
neither baseline microbiota composition (Fig. 6) nor
dietary factors (Additional file 7: Fig. S4a) separated
according to W6 response (p > 0.1). In addition,
com-paring W6-responders and W6-nonresponders in
terms of their baseline total grain, whole grain, and total fiber consumption or their stool consistency and bowel movement frequency during treatment did not reveal any differences either (p > 0.1, Mann–Whitney
Fig. 6 The individualized temporal propionate response to arabinoxylan associates with compositional responses in the fecal microbiota. Principal component analysis plots based on Euclidean distance comparing the relative abundance of fecal microbiota, both at baseline and arabinoxylan-induced shifts (ΔW6–baseline), between W6-responders (red) and W6-nonresponders (black). Microbiota variables (i.e., OTU or CARG) that contributed the most to inter-subject variation were shown as vectors on the plot when statistical significances were determined by PERMANOVA (p < 0.05). CARG co-abundance response group, OTU operational taxonomic unit, W1 week 1, W6 week 6
test) (Additional files 6 and 7: Fig. S3c and Fig. S4b). Together, these findings indicate that the temporal re-sponse in fecal propionate concentrations is primarily associated with the shifts in the microbiota and not baseline microbiota composition or diet.
Individualized SCFA responses can be predicted by gut microbiota features
As with compositional responses, gut microbiota func-tional responses to fiber interventions have been shown
to be individualized [7,25,26], but what drives this
vari-ation is poorly understood. We applied MLR to deter-mine whether fecal SCFA responses could be explained by stool consistency and bowel movement frequency, diet, or microbiota-related factors, and then compared the quality of the models using corrected Akaike
information criterion (AICc) values (where lower values mean higher quality). These analyses revealed that the W6 SCFA response to arabinoxylan could be predicted
by the fecal microbiota (Fig.7; Additional file 8: Fig. S5)
but not by baseline diet, stool consistency, or bowel movement frequency reported during treatment
(Add-itional file 9: Fig. S6a and Fig. S6b). The best models
were achieved for propionate, especially when principal components (PCs) generated from W6 shifts of all OTUs
were used as predictors (Fig.7a; Additional file10: Table
S4). Models were of lower quality when W6 shifts of sig-nificant OTUs, CARGs, PCs of CARGs, or single OTUs were used, suggesting that global community measures exhibited stronger linear relationships with the propion-ate response than single or groups of taxa. Although the models that used baseline and W1 shifts of OTUs as
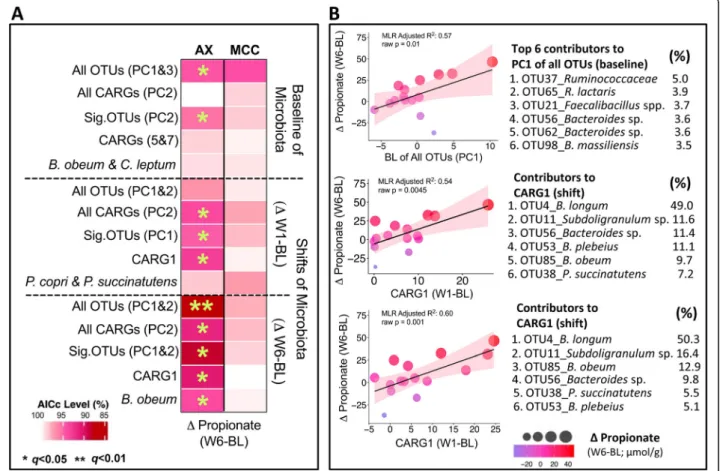
Fig. 7 Individualized arabinoxylan-induced propionate responses could be explained by baseline gut microbiota composition and microbiota shifts. a Heatmap shows the linear associations between the individualized propionate response (ΔW6–BL; dependent variable; columns) and microbiota profiles (BL,ΔW1–BL, ΔW6–BL; predictors; rows). Cells represent individual multiple linear regression models (with FDR correction) that assess whether the predictors explain the individualized propionate response. Multivariate microbiota data were simplified into principal component (PC) variables PC1, PC2, and PC3 prior to analysis. Each model contained the best one or two predictors of PCs, individual CARGs, or significant OTUs selected by stepwise regression. All models were adjusted by fiber dose/sex. Colors from white to red indicate relative AICc (corrected Akaike information criterion) values calculated by AICc value
Highest AICc valuex 100. Lower AICc values (red) indicate higher quality models. b Scatter
plots show the linear relationship between propionate responses (ΔW6–BL) and either the baseline contribution of all OTUs to PC1 or the shifts of CARG1. Color and size of each point indicate propionate response magnitude and the shaded area specifies the 95% confident interval. The top six OTUs that contributed the most to either PC1 of all OTUs or CARG1 are further provided. AX arabinoxylan, BL baseline, CARG co-abundance response group, MCC microcrystalline cellulose, OTU operational taxonomic unit, W1 week 1, W6 week 6
predictors were of lower quality than those based on W6 shifts, they are still valid, showing q values less than 0.05 after Benjamini-Hochberg’s false discovery rate (FDR) correction. Linear relationships between propionate re-sponses and significant predictors using baseline (PC1 of all OTUs) and shifts (CARG1) were further visualized
using scatter plots (Fig. 7b), reaffirming the quality of
the analysis, as a majority of subjects fall within the 95% confidence regions.
Significant models could also be designed for acetate
and butyrate responses to arabinoxylan (Additional file8:
Fig. S5). Interestingly, in contrast to propionate, the best models to predict butyrate responses were achieved using shifts of a single OTU, E. oxidoreducens (OTU41), a
known butyrate producer [27]. However, overall, the
models for acetate and butyrate were of much lower qual-ity than those for propionate. In summary, while individu-alized responses in SCFAs showed no association with diet, they could be predicted by microbiota shifts and baseline composition. In contrast to the analysis of the ef-fects of arabinoxylan, not one single MLR model was found to be significant for MCC, indicating that the statis-tical approach based on MLR models did not detect any associations independent of fiber fermentation.
Determining the role of bacterial taxa in propionate response
MLR analyses were applied to determine connections between arabinoxylan responding OTUs within CARGs
1 and 6, and fecal propionate concentrations (Fig. 8a).
This analysis revealed that shifts in P. copri (OTU6) did not predict propionate responses, while B. longum (OTU4) and correlated taxa in CARG1 showed stronger linear relationships. The highest quality models were ob-tained with B. obeum (OTU85), B. plebeius (OTU53), and P. succinatutens (OTU38), all of which encode
metabolic pathways for propionate production [28].
Such analysis provides a potential explanation for the metabolic interactions between proposed primary de-graders, secondary fermenters, and metabolite utilizers that result in the promotion of propionate in response
to arabinoxylan (Fig.8b).
Discussion
In the present study, we characterized the impact of a 6-week, high-dose corn bran arabinoxylan supplemen-tation on the composition and function of the fecal bacterial community in healthy adults with overweight and class-I obesity. Arabinoxylan treatment changed
Fig. 8 Relationship between propionate responses to arabinoxylan and proposed primary degraders, secondary fermenters, and metabolite utilizers. a Individual multiple linear regression models determine OTU responses (ΔW6–BL) that predict the fecal propionate response (ΔW6–BL). Y-axis shows theβ-coefficient for each predictor, as in the average propionate response when OTU relative abundance increases 1%. X-axis shows the p value for each predictor. All models were adjusted by fiber dose/sex, where bubble size represents the adjusted-R2. b Proposed model of
community structure and induced specific shifts in the composition of the gut microbiota that manifested themselves after 1 week of treatment without further changes at W6. Arabinoxylan induced increases in propionate output. Both compositional and functional responses were highly individualized, with propionate responses showing two distinct temporal patterns. Compositional responses to arabinoxylan could not be predicted and functional responses were independent of stool consistency, bowel movement frequency, and baseline diet; however, baseline microbiota compos-ition and especially the composcompos-itional shifts correlated
with propionate responses. The non-fermentable
MCC showed virtually no effect on gut microbiota composition or function.
An understanding of compositional and functional re-sponses of the gut microbiota to changes in diet requires
an ecological framework [15]. Arabinoxylan
supplemen-tation provides resources that can be used by microbes that possess the traits to either access the chemical structures directly or utilize public goods released during
arabinoxylan degradation [15]. In our study, the
domin-ant effects of arabinoxylan were directed toward two bacterial species, B. longum and P. copri, while nine add-itional OTUs showed smaller increases, including three
Bacteroides species (e.g., B. ovatus, B. plebeius, and
Bac-teroides sp.). This high degree of specificity toward B.
longum over other Bifidobacterium species is in
agree-ment with other studies testing long-chain arabinoxylans
[29–31] and genomic analyses that showed that genes
encoding arabinoxylan-degrading glycosidase (e.g.,
β-xylosidase and α-arabinofuranosidase) are conserved
only among B. longum strains [32,33]. In contrast to the
species-specific enrichment of B. longum, arabinoxylan enriched several species within the phylum Bacteroidetes that possess the genetic and functional traits necessary
for accessing arabinoxylan [34–38]. Although
arabinoxy-lan utilization is not universally conserved among the genera Bacteroides and Prevotella, the species P. copri, B. ovatus, B. cellulosilyticus, and B. plebeius have been
shown to be xylanolytic [34–36, 38, 39] and possess
polysaccharide utilization loci that encode for the xylan
utilization system [34,37,40], thus providing an
explan-ation for their enrichments in our study.
Interestingly, there were several consistent effects ob-served between the corn bran arabinoxylan used in our study and wheat bran extracted AXOS, such as increases in Bifidobacterium longum, Prevotella copri, Bacteroides
ovatus, and Blautia obeum [13,41]. However, in contrast
to corn-bran arabinoxylan, AXOS seem to have lower specificity and promote multiple species of
Bifidobacter-ium and Prevotella, as well as several additional genera
(e.g., Eubacterium and Roseburia). This difference in specificity is likely attributed to variations in their
structural features. Specifically, corn bran arabinoxylan exhibited a relatively high arabinose-to-xylose ratio of 0.56 and contained high amounts of galactose (9.7%), which suggests a heavily branched structure with
com-plex side chains [42–44]. To access and utilize such
complex structures, bacteria require a more extensive repertoire of proteins and hydrolases relative to what is needed for AXOS utilization, which are generally
sim-pler in structure [45]. For instance, B. adolescentis has
been shown to utilize simple AXOS both in
monocul-ture [46] and during co-culture with B. ovatus, but not
during co-culture on corn bran arabinoxylan [47].
Exploring the response of the bacterial community in the context of ecological guilds provides a more complete view on the interactions among the bacterial species in the degradation of arabinoxylan. This analysis showed the strongest response in CARG1 and CARG2. The response within CARG1 is dominated by B. longum, which showed strong connections to four out of five members within CARG1 (B. plebeius, Bacteroides sp., P. succinatutens, and Subdoligranulum sp.) and one mem-ber in CARG2 (an unclassified Lachnospiraceae), sug-gesting syntrophic relationships. B. longum has been
shown to be a primary degrader of arabinoxylans [32,
33] that is able to cleave the complex arabinoxylan
structure by soluble arabinoxylan-degrading glycosidase
[48,49]. This degradation could release xylan and AXOS
(or even xylose, arabinose, and galactose) to
xylan-utilizing Bacteroides species like B. plebeius [36, 37, 40]
and putative secondary fermenters like B. obeum and
Subdoligranulum sp. [29, 50, 51] (Fig. 8b). This
cross-feeding would explain the strong positive associations between B. longum and the other OTUs within CARG1. In contrast, P. copri also increased and is likely a primary
degrader of arabinoxylan [34, 39], but showed only one
strong correlation within CARG6, suggesting the
bacter-ium behaves“selfishly.” Our findings suggest that no
sin-gular “keystone species” initiates the degradation of
arabinoxylan, as it has been described for type-III
resist-ant starches [17]. Most likely, several primary degraders,
including B. longum, P. copri, and certain Bacteroides species, assume this task.
The ecological connections described above provide a basis to understand the effects of arabinoxylan on micro-biota metabolism and the increase in propionate. The specificity of long-chain arabinoxylans for propionate
has been previously described [52, 53], and is affiliated
with a higher presence of arabinose side-chains [3, 54].
Although P. copri is a primary degrader of arabinoxylan, the species did not predict propionate response in our study, which is in accordance with previous suggestions
that the bacterium acts selfishly [55] and does not
pro-duce propionate [28]. Metabolic interactions appear
numerically the dominant responder within this CARG, it does not produce propionate itself and is a poor
pre-dictor of propionate responses (Fig. 8a). However, the
enrichment of B. longum is strongly linked to species that possess metabolic pathways for propionate produc-tion (i.e., B. obeum, P. succinatutens, B. plebeius, and
Bacteroides sp.) [56, 57], which are better predictors of
propionate response. Although significant models were obtained with MLR using the single taxa of CARG1, the entire CARG1 was a better predictor of propionate shifts, indicating that groups of bacteria collaborate to produce propionate. Overall, our analyses on ecological guilds suggest co-operative and syntrophic interactions among B. longum, B. obeum, P. succinatutens, and some
Bacteroidesspecies in the degradation of arabinoxylan to
produce propionate, while P. copri displays a more com-petitive phenotype during arabinoxylan degradation.
Although our study revealed significant effects of ara-binoxylan on microbiota composition and propionate production, these effects displayed a high degree of indi-viduality. In terms of taxa, this might be driven by the inter-individual differences in baseline microbiota
com-position and diet [7]. Although the responses of P. copri
were strictly linked to the presence of the species at baseline, our MLR models showed no significant associa-tions between baseline CLR-transformed abundances and individualized responses. However, some models showed p values below 0.001 before FDR correction, suggesting that associations between the compositional response to arabinoxylan and the baseline microbiota exist but could not be detected with the small sample size of our study. MLR analyses further showed that baseline reported dietary history could not predict arabinoxylan-induced shifts in bacterial taxa or CARGs. This might be reflective of the fact that diet is only one of many contributors to the variation of microbiomes
[58,59], although we cannot exclude that our small
sam-ple size and limitations in self-reported food frequency
questionnaire data contributed to the lack of signal [60].
Therefore, future studies on the individualized response to fiber should be conducted with larger sample sizes, repeated dietary recalls or records, and whole metagen-ome sequencing to achieve higher resolution, strain-level distinctions that likely drive individuality.
Individuality was especially pronounced when looking at metabolite output. Our MLR analyses revealed that shifts in propionate output (ΔW6-baseline) correlated with W6 shifts of the microbiota, and to a lesser degree W1 shifts and baseline composition, but not diet, stool consistency, or bowel movement frequency. Shifts in CARGs provided a better prediction than individual taxa indicate the importance of ecological guilds in fiber fer-mentation. However, models using the first two PCs generated from all OTUs, capturing 25% of the variance
in the bacterial response, were of better quality than those using CARGs, demonstrating that propionate pro-duction is the result of a more complex trophic network that spans the wider bacterial community. This can po-tentially be explained by the well-recognized functional redundancy among distantly related members of the gut
microbiota [28, 61], and the stochastic nature by which
they assemble into communities [62]. Although it is
often assumed that functional redundancy results in gut microbiomes that are more similar between individuals on a functional level, our findings on the propionate re-sponse to arabinoxylan clearly show that differences among individuals exist in terms of how they ferment a dietary fiber. The hierarchy by which factors predict pro-pionate response found in our MLR analysis (single taxa < CARGs < PCs) supports an ecological framework that considers microbiomes as complex communities of interacting members to interpret and predict functional outcomes of fiber fermentation in future human inter-vention trials.
Although this study revealed ecological concepts to ex-plain inter-individual variation in fiber fermentation of the human gut microbiota, we must acknowledge limita-tions in our ability to identify relevant players within trophic networks and ecological guilds using sequencing data from a human intervention study. Our analysis for the determination of CARGs was based on the correl-ation of compositional responses of the microbiota to arabinoxylan. Although this analysis identified clusters of species with traits to utilize arabinoxylan that are likely ecologically relevant, statistically significant corre-lations were also detected between CARGs, suggesting that trophic networks extend to the broader community. In addition, by being limited to correlations, our ap-proach cannot identify causal links, and the focus on compositional shifts is unlikely to identify all members of trophic networks as not every species that contributes
to the fermentation of a fiber becomes enriched [5].
There are, therefore, limitations in our ability to identify all relevant primary degraders, secondary fermenters, and metabolite utilizers, and more sensitive approaches
such as stable isotope probing [63] or bio-orthogonal
non-canonical amino acid tagging (BONCAT) [64] are
required. Such studies could be complemented by co-culture experiments, such as those described by Ze et al.
[17], to empirically test cross-feeding interactions and
exert mechanisms by which gut bacteria collaborate to utilize specific fibers. The inclusion of such mechanistic information on trophic networks would likely improve the quality of models that predict the fermentation of dietary fiber and its metabolic consequences.
From an applied perspective, our findings have impli-cations for the targeted use of arabinoxylan to modulate the gut microbiota for improved health. Probiotic
treatments with B. longum strains have been shown to
be health-promoting in a variety of contexts [65],
including gastrointestinal [66, 67], immunological (e.g.,
anti-allergy and anti-inflammatory [68,69]), and
psycho-logical (e.g., depression and anxiety [70, 71]) disorders.
The specific enrichment of this species supports the use of arabinoxylan in synbiotic applications with B. longum. Another finding that warrants attention in the context of health is the increase in P. copri. Although the role of P. copri in human health remains unclear, with potential deleterious effects reported (e.g., enhanced rheumatoid
arthritis susceptibility [72]) that are likely dependent on
strain-level differences, dietary environments, and host
predisposition [19, 73], this species was associated with
improved glucose metabolism after whole grain barley
treatment [8], and correlated with weight loss in
volun-teers that consumed diets high in whole grains [74, 75].
Prevotella is a genus that has been consistently
nega-tively associated with an industrialized lifestyle [76, 77].
The reason for this reduction due to industrialization is unknown, but it has been speculated that reduced
con-sumption of dietary fiber rich foods is responsible [78].
The increase of P. copri after supplementing through arabinoxylan supports this hypothesis, as arabinoxylan is a dominant fiber in whole grains, which are reduced in the westernized diet. The increased production of propi-onate would have implications for the treatment of obesity and related metabolic and immune alterations, as propionate administration has been shown to induce
satiety [79], improve glucose homeostasis [80, 81], and
suppress proinflammatory interleukin-8 levels [80] in
humans. Overall, our findings suggest that arabinoxylan has prebiotic properties in that it promotes putatively health-related organisms and the production of propion-ate, making it a promising candidate for the prevention of obesity and associated pathologies, especially if its ap-plication is personalized.
Conclusions
The findings of this study are relevant as individual-ized responses of the gut microbiota to dietary fiber provide a potential explanation for their inconsistent
clinical effects in human intervention studies [6]. If
metabolic functions relevant for the physiological ef-fects of fiber (e.g., propionate) are individualized, then effects might not be detectable without stratifying the
human population. This study further identified
microbiota-related factors that can be used to predict arabinoxylan-induced propionate responses. Although significant MLR models were developed based on baseline microbiota profiles, which has practical ad-vantages in personalizing intervention studies by the
prediction of responses pre-treatment, the best
models were obtained with compositional shifts,
especially when features of the broader community (e.g., PCs) were considered. This finding serves as a proof-of-principle for the value of an ecological ap-proach toward predictions of metabolic effects of fiber on the human gut microbiota. We acknowledge that the sample size of this exploratory study was too small to identify predictors of practical value that could be directly applied in independent studies. Lar-ger studies are needed to develop robust machine learning algorithms—ideally informed through an eco-logical framework—that identify the exact factors that predict microbiota responses to dietary fiber.
Methods
Subjects
Male and pre-menopausal, non-pregnant or lactating fe-male subjects aged 19 to 50 years with overweight or
class-I obesity (BMI 25.0 to 34.9 kg/m2) and a stable body
weight (± 3% for≥ 1 month) who were otherwise healthy
were recruited from the Edmonton area using campus-wide flyers, mailings to specific Listservs, local events, and word of mouth. Exclusion criteria included (1) history of gastrointestinal disorders or surgeries; (2) history of dia-betes mellitus; (3) chronic use of anti-hypertensive, lipid-lowering, anti-diabetic, anti-inflammatory, or laxative medications; (4) antibiotic use three months prior to the study; (5) use of probiotic, prebiotic, omega-3 fatty acid, or herbal supplements; (6) intolerance to corn; (7)
vegetar-ian; (8) smoking; (9) alcohol intake ≥ 7 drinks/week; and
(10) > 3 h of moderate-vigorous exercise per week. Study design
This 6-week, parallel two-arm, exploratory randomized controlled trial (RCT) was prospectively registered on
July 3, 2015 with ClinicalTrials.gov (NCT02322112) as
part of a large parallel four-arm RCT that aimed to com-pare the effects of four structurally distinct fibers (i.e., arabinoxylan, acacia gum, resistant starch type-IV, and MCC) on the gut microbiota and human health, referred to as The Alberta FYBER (Feed Your Gut Bacteria morE
fibeR) Study (for original registration we refer to [82]).
In response to requests by reviewers of a grant applica-tion, which advised against including a premarket fiber ingredient in a larger human trial, the arabinoxylan arm was separated from the original RCT on October 26, 2016 and data from the 15 subjects that completed the protocol were analyzed independently. Study visits were conducted in accordance with the principles of the Dec-laration of Helsinki at the University of Alberta Human Nutrition Research Unit in Edmonton, Alberta, Canada between September 2015 and October 2016.
The study included five clinic visits (Fig. 1). During a
2-week screening/baseline period, potential subjects were pre-screened by telephone for initial eligibility and
then attended a screening visit (visit 1) to confirm eligi-bility and receive study material (including fecal collec-tion supplies) to be completed prior to the baseline visit (visit 2). During the baseline visit, eligible subjects were enrolled, stratified based on sex, and then randomly assigned to either the arabinoxylan arm or MCC arm. Random treatment allocation was accomplished using a computerized random number generator, in which two separate random allocation sequences (female and male sequence) were generated and concealed by a researcher not involved in subject allocation. Upon enrollment, subjects were then assigned to the next available randomization number by a study investigator blinded to these predetermined allocation sequences.
Thirty-eight subjects were enrolled in the study and instructed to consume their corresponding supplement for 6 weeks at a daily fiber dose of 25 g for females and 35 g for males, provided strictly as either arabinoxylan or MCC. Half daily doses were provided for the first 2 days of treatment (12.5 g for females and 17.5 g for males), as this was shown by pilot data to ease diet in-corporation. After 1 week of treatment, subjects returned to provide a second fecal sample and to assess protocol adherence (visit 3), which was also assessed during their third week of treatment (visit 4). A final visit was required at endpoint (6 weeks of treatment) to provide the third and final fecal sample and to assess overall protocol adherence (visit 5).
Treatments
The arabinoxylan used in this study was BIO-FIBER GUM and was provided by Agrifiber Holdings LLC (Illi-nois, USA) as a single batch. The long-chain arabinoxy-lan is an alkali-extract, soluble arabinoxyarabinoxy-lan isolated from corn bran that contained 81.0 ± 1.3% arabinoxylan. The arabinoxylan was further analyzed for its monosac-charide composition by their trimethylsilyl derivatives using gas chromatography coupled with mass spectros-copy (models 7890A and 5975C inert MSD with a Triple Axis detector, Agilent Technologies Inc., California,
USA) as previously described [83]. The results showed
that the corn bran arabinoxylan composes of 57.8% xy-lose and 32.5% arabinose (weight basis). As the backbone of arabinoxylan is comprised of linear xylose with ara-binose forming branching points, the araara-binose-to- arabinose-to-xylose ratio is often used to estimate arabinoxylan branching density. The arabinoxylan used here had an arabinose-to-xylose ratio of 0.56, which is similar to that
reported for alkali extracted corn arabinoxylans [42–44].
The arabinoxylan further contained 9.7% galactose, which is likely present in side chains as described for
other corn arabinoxylans [42, 44]. The relatively high
arabinose-to-xylose ratio and abundant galactose collect-ively suggest that the corn bran arabinoxylan is heavily
branched with complex side chains, like the ones
previ-ously reported by Saulnier et al. [42], Rose et al. [43],
and Rumpagaporn et al. [44]. The MCC used in this
study was MICROCEL MC-12 and was provided by Blanver Farmoquimica LTDA (São Paulo, Brazil). The MCC is a large particle size (160-μm average), wood-derived cellulose fiber processed with a dilute-acid to re-move amorphous regions leaving only recalcitrant crys-talline regions. The MCC was subjected to in vitro fecal fermentations to confirm resistance to microbial fermen-tation and, therefore, selected as a non-fermentable control.
Both fibers were administered as powdered supplements and incorporated daily into the subjects’ preferred foods and drinks. The treatments were not identical in their ap-pearance or physicochemical properties and, therefore, double-blinding was not possible. To achieve single-blinding, however, subjects were not informed of their fiber treatment, and weekly doses were provided in sealed opaque bags that contained individually packaged, ready-to-use fiber sachets. Subjects were instructed to return all
provided sachets at their scheduled visits, where
remaining fiber was weighed to assess protocol adherence. Baseline dietary intake and anthropometric assessment Subjects were asked to maintain their habitual diet and physical activity level during the intervention study. Baseline dietary intake was assessed by the online Can-adian Diet History Questionnaire II Past Month (C-DHQ II), a food frequency questionnaire adapted for the Canadian population from the validated US-DHQ II
[84]. Subjects’ responses were analyzed using Diet*Calc
software (Version 1.5.0) and the C-DHQ II-specific nu-trient database; previously updated to include eight new food group variables representing Canada’s 2007 Food
Guide serving-size-equivalents [85]. Prior to statistical
analyses, C-DHQ II extracted data were assessed for ex-treme outliers using methods described by Kipnis and
colleagues [86], and then calorie-adjusted using methods
described by Willett and Stampfer [87].
Anthropometric measurements were also obtained at baseline and W6. Height and weight were measured, in light clothing, with empty pockets, and shoes removed, and used to calculate BMI. Waist circumference was measured using a Gulick II plus tape measure according to National Institutes of Health guidelines. Body fat per-centage was estimated by bioelectrical impedance ana-lysis (Tanita TBF-300A Body Composition Analyzer, Illinois, USA) using a proprietary equation.
Assessment of stool consistency and bowel movement frequency
Self-reported stool consistency and bowel movement fre-quency were obtained at baseline and then at the end of
each intervention week using a 5-point hedonic scale.
For consistency, the scale was anchored by“hard or
frag-mented” (0) and “runny or watery” (4) with a score of
two indicating normal or “smooth, soft, and formed”
stool. For frequency, the scale was anchored by “every
third day or less often” (0) and “three times a day or more often” (4) with a score of two indicating “once a
day.” The area under the curve (AUCBL–W6) was then
calculated using the linear trapezoidal method. Fecal sample collection and processing
Fecal samples were collected at baseline, W1, and W6 using stool collection kits consisting of a stool specimen container, an air-tight bag (Fisher, Canada), and a Gas-Pak™ EZ Anaerobe Sachet (BD, Canada) to generate an anaerobic environment within the container. Samples were delivered to researchers within 4 h of defecation. Upon receipt, fecal samples were processed immediately in an anaerobic chamber (Bactron™, Shel Lab, Oregon,
USA) with an environment consisting of 5% H2, 5%
CO2, and 90% N2. Raw fecal material was aliquoted for
pH and moisture content measurements, and also di-luted 1:10 in molecular grade phosphate-buffered saline for DNA extractions and 1:5 5% phosphoric acid for
SCFA quantification. Aliquots were stored at − 80 °C
and kept frozen until further processing.
Fecal pH, SCFA, and moisture content quantification Raw fecal material was diluted 1:4 in distilled water to determine fecal pH using an Accumet AB150 pH meter
(Fisher, Canada) as previously described [88,89].
Quan-tification of fecal SCFAs was completed at the Agricul-tural, Food and Nutritional Science Chromatography Facility of the University of Alberta as previously
de-scribed [90]. Briefly, 1:5 dilution of fecal samples
homog-enized in 5% phosphoric acid were thawed and
centrifuged, then 1000μl of supernatant was mixed with
200 μl of internal standard (4-methyl-valeric acid).
Subsequently, 0.2 μl of the mixture was injected into a
Bruker SCION 456 gas chromatograph (Bruker Corpor-ation, Massachusetts, USA). SCFAs were separated on a Stabilwax-DA column (30 m × 0.53 mm inner diameter
× 0.5 μm film thickness, Restek Corporation,
Pennsylva-nia, USA) with a flame ionization detector, and quanti-fied by calculating response factors for each SCFA relative to 4-methyl-valeric acid using injections of pure standards. Total SCFA concentrations were determined as the sum of acetate, propionate, and butyrate, while the relative percentage of each SCFA was determined by dividing these individual SCFAs by total SCFAs. Total branched short-chain fatty acid concentrations were de-termined as the sum of isobutyrate and isovalerate. Fecal moisture content was determined by drying raw fecal material overnight in an oven at 103 °C.
DNA extraction, 16S ribosomal RNA (rRNA) gene amplicons sequencing, and data processing for microbiota analysis
Bacterial DNA was extracted from fecal homogenates in phosphate-buffered saline (1:10) using the QIAamp DNA Stool Mini Kit (QIAGEN, Hilden, Germany) as
previously described [91]. The V5–V6 regions of the 16S
rRNA gene were targeted for PCR amplification using primer pair 784F [5′-RGGATTAGATACCC-3′] and
1064R [5′-CGACRRCCATGCANCACCT-3′]. 16S
rRNA gene amplicons were sequenced by 300 bp paired-end sequencing on the MiSeq platform at the University of Minnesota Genomics Center (Minnesota, USA), with all samples of this study being included in the same run.
Sequences were trimmed to 210 bases long using FASTX-Toolkit, and paired-end reads were merged with the merge-illumina-pairs pipeline as previously described
[91]. Samples exceeding 16,000 reads were subsampled
to 16,000 using USEARCH v8.1 [92]. Removal of
chimeric reads and clustering of OTUs (at a 98%
pair-wise identity threshold) were conducted using
USEARCH, resulting in an average of 10,763 ± 670 high-quality sequences per sample after quality control. Taxonomies from phylum to genus level were assigned using the entire sequence set by the Ribosomal Database
Project Classifier [93]. OTUs were assigned taxonomy by
using the Silva database (release 132 [94]), and sequence
identity at species level was confirmed using 16S rRNA
gene databases on EzBioCloud [95], IMG/MER [96], and
NCBI [97] platforms.
Prior to ordination and statistical analysis, OTU count data were converted into relative abundance and also
CLR transformed to correct for compositionality [98].
Considering all fecal samples, OTUs with an average relative abundance below 0.15% were removed. This
ap-proach resulted in exactly 100 OTUs (referred to as“all
OTUs”), which were used in downstream analyses, ac-counting for 88.1% of the approximately 1 million-curated reads.
Statistical analysis
All univariate analyses were performed by GraphPad
Prism (v8.0.1; www.graphpad.com), while multivariate
and regression model analyses were performed using R
(v3.5.3; www.r-project.org) unless otherwise stated. The
statistical analyses conducted are discussed in detail in the sections below.
Bacterial community analysis
To explore the effect of fiber on the bacterial
commu-nity, we assessed overall β-diversity, dissimilarity
be-tween and within individuals, and α-diversity. To assess
overall β-diversity, Euclidean distance between bacterial
data of all OTUs and then visualized using non-metric
multidimensional scaling (vegan [99] and ggplot2 [100]
packages). Differences in the communities of arabinoxy-lan and MCC groups at specific time points were com-pared by PERMANOVA using the Adonis function in
vegan [99]. Euclidean distances were used to calculate
inter-subject (between subjects at the same time point) and intra-subject (within subjects, but at different time points) dissimilarities. Differences in inter-subject diver-sity were determined within each treatment group rela-tive to baseline using GEE models (geepack package
[101]) followed by Bonferroni correction. Differences of
intra-subject dissimilarity between arabinoxylan and MCC were compared using Mann–Whitney tests. α-diversity (Shannon index) and bacterial richness (OTU numbers) were determined using rarefied OTU data
with the vegan package [99].
Fecal microbiota composition and SCFA analyses
Community membership of individual taxa was pre-sented as relative abundance (mean ± SD), while CLR-transformed data were used for statistical analysis. Com-parisons of phyla, families, genera, OTUs, and SCFAs between baseline and W6 were performed by Wilcoxon
tests, while comparisons of shifts (i.e.,ΔW6-baseline)
be-tween arabinoxylan and MCC were performed by Mann–Whitney tests. P values were adjusted by FDR and considered statistically significant when q values were less than 0.15. Differences at W1 and W6 in the ef-fects of fiber on OTUs and SCFAs were determined using the Friedman’s test followed by a Dunn’s correc-tion for multiple comparisons.
CARG and network analyses
Potential syntrophic interactions between bacterial taxa in their response to arabinoxylan were assessed using
co-occurrence network analysis [22]. To determine
groups of interacting OTUs in their response to
arabi-noxylan (thus potential ecological guilds) [20], CARGs
were determined from the top OTUs impacted by arabi-noxylan consumption (ΔW6-baseline unadjusted p < 0.1; Wilcoxon test). Spearman’s correlation analysis was per-formed between the CLR-transper-formed shifts (ΔW6-base-line) in these OTUs to construct a correlation matrix using Spearman’s correlation coefficients, which was then converted into a distance matrix by (1—correlation
coefficients) [22]. Next, hierarchical clustering was
per-formed on the distance matrix to build a tree using the complete-linkage clustering algorithm
(ComplexHeat-map package [102]) where branch lengths reflect the
de-gree of association between OTUs (i.e., shorter branches indicate that OTU responses to arabinoxylan were more similar among individuals). Differences between distinct clusters of the Hierarchical tree, and thus individual
CARGs, were determined by PERMANOVA using a
cut-off of p < 0.05 [22]. In summary, OTUs within each
CARG were observed to respond more similarly to ara-binoxylan when compared to OTUs within another CARG, and these responses showed significant cluster-ing, which suggests enhanced co-operative relationships between taxa of the same CARG during arabinoxylan degradation. Relative abundance of each CARG was cal-culated as the sum of the OTUs within each CARG prior to statistical analyses.
To visualize the interaction of OTUs within and be-tween CARGs, a Spearman’s correlation network was calculated based on shifts in CLR-transformed
abun-dance using permutation tests (1000×) by CoNet [103]
as previously described [104]. To focus on the most
ro-bust interactions, only OTUs with Spearman’s rho values ≥ 0.5 or ≤ − 0.5 and FDR corrected q < 0.05 were
visual-ized in the network using Cytoscape (v3.61;
www.cytos-cape.org).
Differences in bacterial community composition and diet between W6-propionate responders and nonresponders To identify factors that contribute to the variation be-tween W6-propionate responders and nonresponders, PERMANOVA was performed on Euclidian distances based on the baseline and shifts of total OTUs, signifi-cant OTUs, CARGs, and baseline diet. The multivariate data of microbiota and diet were visualized on PCA
biplots using factoextra [105] and FactoMineR [106]
packages.
Relationships between bacterial community and SCFA responses with microbiota and diet features
To explain the individualized response of the fecal microbiota to fiber, MLR analyses were employed using R. In order to perform the analysis, dimensionality of the microbiota and diet data were reduced by PCA into PC1, PC2, and PC3, which represents the largest propor-tion of the inter-individual variability and captures the most information on microbiota and dietary variation. Microbiota compositional and SCFA response variables were used as dependent variables. Baseline and shifts of PC variables, CARGs, OTUs, and diet data were used as predictors. Subset selection in regression was applied to choose the best combination of predictors using the
se-quential replacement algorithm (leaps package [107]).
Therefore, each MLR model presented only contained the top one or two predictors that explained the re-sponse variable the best. Dietary and microbiota-related predictors were treated separately in different models, and total grains, whole grains, and total fiber intake were used as single dietary predictors. All models were ad-justed by fiber dose/sex and p values were corrected by FDR with statistical significance considered at q < 0.05.