HAL Id: hal-03192716
https://hal.univ-reunion.fr/hal-03192716
Submitted on 8 Apr 2021HAL is a multi-disciplinary open access archive for the deposit and dissemination of sci-entific research documents, whether they are pub-lished or not. The documents may come from teaching and research institutions in France or abroad, or from public or private research centers.
L’archive ouverte pluridisciplinaire HAL, est destinée au dépôt et à la diffusion de documents scientifiques de niveau recherche, publiés ou non, émanant des établissements d’enseignement et de recherche français ou étrangers, des laboratoires publics ou privés.
Price perception under blocks tariff schemes : a
comparison of drinking water consumption beliefs and
behaviors and recommandations for efficient nudging
policies
Marie-Estelle Binet, María A. García-Valiñas, Michel Paul
To cite this version:
Marie-Estelle Binet, María A. García-Valiñas, Michel Paul. Price perception under blocks tariff schemes : a comparison of drinking water consumption beliefs and behaviors and recommandations for efficient nudging policies. 7e Conférence Annuelle (Virtuelle) FAERE (French Association of En-vironmental and Resource Economists), FAERE (French Association of EnEn-vironmental and Resource Economists), Sep 2020, On-line, France. �hal-03192716�
1
PRICE PERCEPTION UNDER BLOCKS TARIFF SCHEMES: A COMPARISON OF DRINKING WATER CONSUMPTION BELIEFS AND BEHAVIORS AND
RECOMMANDATIONS FOR EFFICIENT NUDGING POLICIES
Marie-Estelle BINETa , Marian GARCIA-VALINASb, Michel PAULc a
School of Political Studies, Univ. Grenoble Alpes, GAEL, INRA-CNRS, 38000 Grenoble, France
b Oviedo Efficiency Group, Department of Economics, University of Oviedo, 33006 Oviedo, Asturias, Spain c
CEMOI, University of Reunion
Preliminary results
June 2020
Abstract. As tariff schedules used by public utilities to price goods like electricity, gas or
drinking water are often complex, with increasing or decreasing block rates and fixed charges, an important issue discussed in the literature is the choice of the relevant price variable used by households for their consumption choice. Using data from a household survey carried out in the French overseas territory of Réunion, and on the basis of two empirical methods, we propose two indicators measuring the knowledge of the price of drinking water by households. We distinguish and compare price knowledge based on beliefs from that based on observed consumption behaviors, which are conditioned by the degree of attention of the consumer. Both methods confirm the hypothesis of price misperception, and argue in favor of price informational nudges. However, they reveal contradictory results. If a large number of households think that the price is much higher than it actually is, they base their consumption choices on an underestimated price, lower than marginal price. Nudges must therefore be deployed during periods of water consumption if a rebound effect on consumption is to be avoided. Finally, using econometric models, we identify the main determinants of price knowledge.
2
1. INTRODUCTION
According to the World Bank (2016), 1.6 billion people suffer from water scarcity. Projections to 2050 underline that demand for water will increase due to population growth, urbanization and agricultural uses. At the same time, climate change will affect rainfall, with increased variability. All in all, water availability could be reduced by two thirds compared to 2015 levels. Indeed, in 2050, 4 billion people could live in water-stressed areas, including in both developing and developed countries (OECD, 2016). Finally, ensuring sufficient water availability is essential to reducing poverty, maintaining economic growth, avoiding water conflicts and guaranteeing food security (World Bank, 2016).
The OECD (2016) has made policy recommendations to deal with the current and future challenges concerning water scarcity, and the European Union provided the water framework directive. Indeed, European laws and policies intend to favor a « dehydrate » economy. For this purpose, most of the water utilities have developed policies based on price incentives. Utilities generally adopt an increasing block rate (IBR) pricing scheme. In its conventional form, this pricing scheme breaks down the metered volume of water during the billing period by ordered blocks with increasing unit prices. Such a tariff scheme, which can achieve the goals of environmental protection and social equity, is currently implemented in the United States, as well as in many European and developing countries. Water preservation can be promoted if high tariffs are used for non-basic water uses. However, the proper use of an IBR water schedule implies that the consumer is perfectly informed about the tariff scheme, making him able to assess the impact of changes in water consumption on his invoice. If information to the consumer is not perfect, there may be insufficient behavioral changes, which could challenge the conservation goals being sought through this peculiar tariff scheme.
In the empirical literature, two methods are used to measure households' knowledge of the price of water, but they were applied on different data, ,collected from different geographic areas. The first method is based on survey data, in which households are asked about their price knowledge, which corresponds to their beliefs. Brent and Ward (2019), find that consumers overestimate the cost of using water. Therefore, they observe that small consumers in particular, increase their consumption after receiving information on their true pricing and costs. Such a rebound effect is also observed in papers using field data from water utilities, and examining the impact of treatments, such as increasing tariff progressivity (Mayol, 2017)
3
or billing frequency (Wichman, 2017), on consumers behaviors. In particular, Wichman (2017) considers the impact of receiving more frequent information about price and consumption level on water consumption. He finds that such a treatment effect induces a 3.5-5% increase in average water consumption.
The second method aims at estimating in a econometric model of demand, the perceived price which is the best price variable to fit observed households’ consumption and which is thus revealed by consumption behaviors. Using this method, Ito (2014) and Binet et al. (2014) showed that water customers respond to average price. In the same vein, Wichman (2014) find the same result. Therefore, the price perceived by consumers subject to an IBR tariff scheme, if obtained by dividing the water bill, excluding fixed services fees, by the consumption level, is lower than the price perceived by a perfectly informed consumer (the marginal price, i.e., the price of the last unit consumed). As a consequence, water consumption tends to be far greater than the optimal level for the consumer.
These two methods reveal two main psychological biases, which are incorrect beliefs and inattention, and which may lead consumers to make mistakes in incorporating the IBR tariff scheme into their decision choice, see Gabaix (2014, 2019), Gabaix and Laibson (2006), DellaVigna (2009). They also lead to opposite results, price underestimation by econometric methods measuring consumer inattention and price overestimation by asking households about their beliefs).But as these results are obtained with different data, it is therefore not easy to know whether they are related to individual differences in price appreciation or to cognitive biases indicating that behaviors deviate from beliefs.
To empirically assess the importance of these two issues, we implement and compare, for the first time to our knowledge, the two empirical methodologies to measure water price accuracy on the same data base. This allows us to compare the beliefs and behaviors of the same consumers. Finally, both methods confirm the hypothesis of price misperception and argue in favor of price informational nudges. However, they reveal, as in the literature, contradictory results. If a large number of households think that the price is much higher than it actually is, they base their consumption choices on an underestimated price, lower than marginal price. Our results thus contribute to the literature in two ways. First, they confirm that household beliefs are at odds with their behaviors. Then, we can make practical recommendations on the implementation of informative price nudges for drinking water consumers. Nudges in the
4
form of a marginal price recall as in Binet et al. (2020), must therefore be deployed during periods of water consumption if a rebound effect on consumption is to be avoided. Indeed, outside these periods, the household's awareness of the marginal price may lead them to believe that the price of water is lower than they thought it was and thus favor a rebound effect. Indeed, nudges must be concomitant with consumption, with the price display fluctuating with consumption volume. Finally, using econometric models, we identify the main determinants of price knowledge. The objective of this last section is to identify the individual characteristics of households according to their errors of appreciation of the price of water in order to target nudging policies.
The remainder of the paper is organized as follows. Section 2 is devoted to the presentation and implementation, using survey data, of the two empirical methods used in the literature to assess the knowledge of the price of water by households faced with complex pricing. Next, using econometric models, we identify in section 3 the main determinants of price knowledge. Section 4 concludes.
2. TWO INDICATORS OF CONSUMER’S PRICE KNOWLEDGE OF WATER MEASURED BY SURVEY DATA
Using data from a household survey carried out in the French overseas territory of Réunion, and on the basis of two empirical methods, we propose two indicators measuring the knowledge of the price of drinking water by households. We first offer a description of the survey context and sampling design, then we introduce the two empirical methodologies retained and compute our price knowledge indicators.
2.1 The Réunion Household Water Consumption Survey
Réunion is a French overseas territory lying in the Indian Ocean. Reunion Island has a humid oceanic climate and very important water resources, with an annual rainfall of more than 9 billion cubic meters. Nevertheless, the island faces many difficulties. Indeed, rainfall differs considerably according to the geographical location: the northeast of the island receives about 70% of the total rainfall. And urban development mainly occurs in the northwest of the island, where the weather is dry. Next, household water use appears quite high: with a daily
5
consumption of 169 liters per day and per inhabitant in 2004, Reunion Island ranks first among all the French regions.
Based on these findings, some of the authors of this article were commissioned by Regional Directorate for the Environment (so-called DIREN from the French term ‘DIrection Régionale de l’ENvironnement’) to plan and carry out a survey of a representative sample of households to study their consumption habits. The paper uses data from this household survey. The objective of the survey was to identify the reasons for the overconsumption of water on the island compared to consumption in mainland France.
Data were collected from several sources. A two phase survey was used. First, on the basis of a municipal stratification, 2000 households, i.e. 1% of the population of each municipality the island of Réunion were questioned about their socio-economic characteristics, their water consumption habits, their housing characteristics, and their beliefs in terms of water price knowledge. In a second step, we collected 456 invoices from voluntary households, paid 15 Euros each. The data describing the pricing that is specific to each municipality was provided to us by the utilities. In this way, for each invoice, the volume consumed is available over the billing period, and we can deduce the corresponding marginal price and corresponding individual consumption level. The average price is also computed by dividing the invoice amount, excluding the fixed part, by the volume consumed. The perceived price is estimated within an econometric model fitting the individual consumption measured on the bills.
2.2 Perception price as the price used to make consumption choice
Following Shin (1985), perceived price can be estimated through perception parameter k by assuming that perceived price * is a linear combination of marginal price and average price :
Value for perception price parameter k is estimated jointly with other parameters in the econometric model of demand to fit observed individual water consumption. If k=0, perceived price is marginal price whereas if k=1, it is equal to the average price. Next, as for an
6
increasing block pricing scheme, < if we exclude the fixed part, the perceived price is all the more lower than marginal price that perception parameter k is greater than zero and, accordingly, the water demand greater than that resulting from perfectly optimizing consumer behavior.
This approach is in accordance with the literature about inattention to true prices (see Gabaix (2014, 2019) for an overview), in which a subjectively price (here ) is a linear combination of the true price (here ) and a default price (average price when consumers are ironing according to Liebman and Zeckhauser (2004)). All in all, inattention can be explained by the limited ability to understand the bill computation or the lack of readily-accessible prices. In this literature, k is called (in) attention parameter.
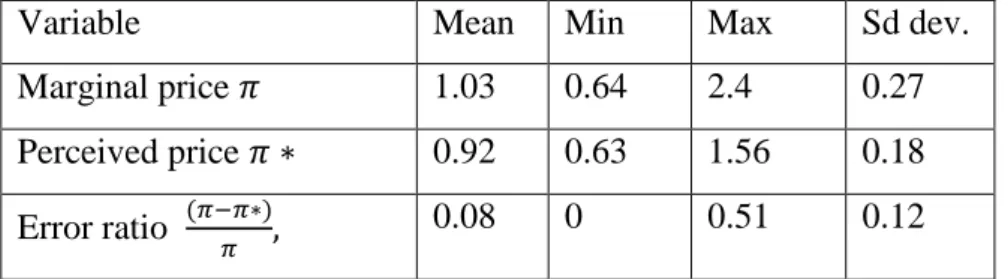
Using the survey data described in subsection 2.1, Binet et al. (2014) estimated the perception price parameter equals to 1.5, which means that the price perceived by consumers subject to an IBR tariff scheme is lower than the price perceived by a perfectly informed consumer (the marginal price, i.e., the price of the last unit consumed). Therefore, water consumption tends to be far greater than the optimal level for the consumer. Using this estimate, we are able to compute the perceived price distribution, specific to each bill as depending on the consumption level, which can be compared to the effective marginal price . Then, we are able to compute a ratio measuring the percentage of errors in household price perception which measures the size of the price misperception. Corresponding descriptive statistics, computed on the basis of 456 invoices, are given in the following Table 1:
Table 1. Price misperception indicators based on inattention
Variable Mean Min Max Sd dev.
Marginal price 1.03 0.64 2.4 0.27
Perceived price 0.92 0.63 1.56 0.18 Error ratio 0.08 0 0.51 0.12
Mechanically, as perceived price is computed using the estimates k=1.5, we observe price under-estimation. The percentage of errors is therefore positive with an average value equals
7
to 8%, and is between 0 and 51%, as following equation (1), households consumption in the first block have a perceived price equals to the effective marginal price,
2.3 Price knowledge based on beliefs
Price knowledge is measured by comparing the answers to the following question What do
you think is the price of one cubic meter of water i.e. 1,000 liters? to effective marginal and
average prices. Four answers are proposed 1/ It’s free, 2/ Less than 1 euro, 3/ Between 1 and 5
euros, 4/ More than 5 euros. For most of households, choosing the first two answers lead to
price underestimation as the value chosen is lower than the marginal price. Moreover, choosing the last answer reveals a very high price over estimation, as the marginal price never exceeds 2.4 according to Table 1. The comparison of the answer to this question to two marginal prices (with or without sanitation) and average price, allows us to build the corresponding three dummy variables:
percep1 equals to 1 if the household has a perfect marginal price knowledge, excluding sanitation, 0 otherwise.
percep2 equals to 1 if the household has a perfect marginal price knowledge, including sanitation, 0 otherwise.
percep3 equals to 1 if the household has a perfect average price knowledge, 0 otherwise
Then we have also built 2 other dummy variables:
overpercep=1 if the interval chosen by the respondent is greater than, at least, one of the effective prices, 0 otherwise.
underpercep=1 if the interval chosen is the interval chosen is lower than, at least, one of the effective prices.
Tables 2 gives the corresponding descriptive statistics:
Table 2. Price misperception indicators based on mistaken beliefs
Variables percep1 percep2 percep3 Overperc Underper
Mean 0,287 0,423 0,399 0,711 0,064
8
71.1% of the respondents overestimate the price of 1,000 liters of water, and declare than the unit price is either between 1 and 5 euros, or greater that 5 euros. This result is in accordance with Brent and Ward (2020). More precisely, respondents are relatively bad informed about their marginal price excluding sanitation which is the lowest one (percep1). Indeed, only 28.7% of respondents choose the interval including that price whereas around 40% have a more accurate knowledge of their average price and marginal price including sewage, which are higher than the previous. We thus observe heterogeneity in price knowledge. Conversely, few respondents, only, 6.4%, have an under-perception of price. Indeed, they declare the unit price is lower than 1, whereas their effective marginal price without sanitation is greater than 1.
Finally, the comparison of the two methods reveals a contradictory result. Indeed, it would appear that households' beliefs lead them to consider that the price of water is higher than it is, while their consumption choices seem to be based on a price lower than the actual price. By applying both methods on the same survey database, the hypothesis of cognitive bias indicating that behaviors deviate from beliefs is therefore validated here.
These results therefore however, these results converge on the finding of poor price perception and argue for a better information for households on the price of water. Nudges in the form of a price reminder as in Binet et al. (2020) are therefore to be recommended. However, if we want to avoid an increase in consumption due to a rebound effect, such price informational nudges should be offered to households at the time they use the water, and not outside this time. If the nudge is deployed outside consumption periods, appearing on the water bill for example, implying a comparison of the effective marginal price to their own price knowledge and beliefs, this may lead them to overestimate the price. Indeed, if nudges are not concomitant with consumption if the nudges are not deployed in real time, with the price display fluctuating with consumption volume, the price reminder may tell consumers that the price is actually lower than they think it is, thus encouraging them to increase their consumption. The objective of the next section is to identify the individual characteristics of households according to their types of errors of appreciation of the price of water in order to target nudging policies.
9
3. INDIVIDUAL DETERMINANTS OF PRICE KNOWLEDGE
To identify the individual determinants of price knowledge, we first run probit regressions with a dependent variable that is each of the price misperception indicators based on beliefs, which are the binary variables described in subsection 2.3. Next, we implement a fractional probit model to identify the determinants of the ratio measuring the percentage of errors in household price perception based on inattention, i.e. The explanatory variables collected from the survey realized in Réunion island are fully described in Binet et al. (2014). Summary statistics computed on the basis of the 456 water bills are shown in Table 4.
Table 3.Variables used in the probit regressions, 456 water bills, summary statistics
Acronym Description Mean Min Max St. Dev
Income Monthly household income in Euros 2073 426 7374 1745
Hsize Household’s size 3.16 1 8 1.44
Hcons Household’s monthly water consumption in
liters
659 10 5204 0.56
Billsem Binary variable equals to 1 in case of half-yearly invoice
0.61 0 1 0.49
Block Block rate number 1.68 1 4 0.78
House Binary variable equals to 1 if household is leaving in a house
0.77 0 1 0.42
Know Binary variable equals to 1 if the household declare knowing his bill amount
0.75 0 1 0.43
Swim Binary variable equals to 1 if household has a swimming pool
0.09 0 1 0.29
Retired Binary variable equals to 1 if household is retired
0.24 0 1 0.43
Sanit Binary variable equals to 1 if the if the dwelling is connected to a sewerage system
0.45 0 1 0.49
Owner Binary variable equals to 1 if household is homeowner
0.54 0 1 0.50
10
spent little time outside Reunion island (less than 6 months in total)
3.1 Explaining price misperception in behaviors
We have built five price misperception indicators based on households’ beliefs, namely
percep1, percep2, percep3, onverperc and underperc. The main determinants of
corresponding price knowledge indicators are identified using tobit models and are shown in the following table:
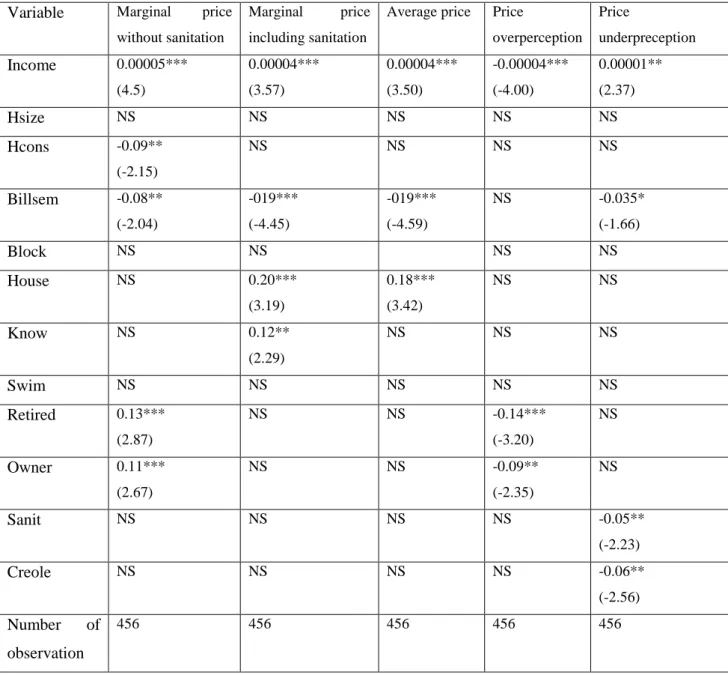
Table 4. Price knowledge indicators based on beliefs: probit results, average marginal effects
Variable Marginal price without sanitation
Marginal price including sanitation
Average price Price
overperception Price underpreception Income 0.00005*** (4.5) 0.00004*** (3.57) 0.00004*** (3.50) -0.00004*** (-4.00) 0.00001** (2.37) Hsize NS NS NS NS NS Hcons -0.09** (-2.15) NS NS NS NS Billsem -0.08** (-2.04) -019*** (-4.45) -019*** (-4.59) NS -0.035* (-1.66) Block NS NS NS NS House NS 0.20*** (3.19) 0.18*** (3.42) NS NS Know NS 0.12** (2.29) NS NS NS Swim NS NS NS NS NS Retired 0.13*** (2.87) NS NS -0.14*** (-3.20) NS Owner 0.11*** (2.67) NS NS -0.09** (-2.35) NS Sanit NS NS NS NS -0.05** (-2.23) Creole NS NS NS NS -0.06** (-2.56) Number of observation 456 456 456 456 456
11
NS means statistically insignificant. Backward stepwise regressions are implemented and the final estimation model excludes all the insignificant variables. Variance Inflation test are used to check the absence of multicolinearity.
First, Income level is a robust significant factor in explaining the level of household knowledge of the price of water. Indeed, we observe a positive effect of household income level (imp3) on the probability to have a good appreciation of average and marginal price levels, but the marginal effect is weak. Being rich also reduces the probability to overestimate the water price but increases the probability to underestimate it. the gap between beliefs and behaviours regarding water consumption therefore tends to narrow with income level. Next, if we assume that poorer households have lower levels of water consumption than richer ones, because they have less housing and garden space, and fewer water-consuming appliances, this result highlights the risk of a rebound in consumption if poor households revise their beliefs about the true price of water.
Next, a second robust result emphasizes the importance of billing frequency on price knowledge and thus on household consumption choices. Indeed, the factsem variable relates to the billing period, which occurs twice a year when factsem=1, and 3 times a year otherwise, and has a negative and significant effect on the knowledge of the three price définitions considered. Our result is in accordance with Wichman, (2017), as decreasing the billing frequency reduces price accuracy. Otherwise, individuals could better infer their true marginal price by looking more frequently at their bills to see how their amounts change from period to period in response to changes in consumption. Moreover, when billing is delayed (factsem=1), each bill is of course greater than when the billing frequency is higher. Therefore, decreasing billing frequency makes the true marginal prices less readily available, and especially the higher amount billed, as it relates to a longer period of time. In total, the probability to underperceive price is reduced.
Other results are more specific to some specifications than others. First, the accurate marginal price perception excluding sanitation arises when the individual is retired and is home owner, and reduces their price overestimation. But this time, corresponding average marginal effects are high with estimates around 0.12. Next, high consumption levels reduce marginal price knowledge (without sanitation only), and are insignificant in other cases. This result contradicts those obtained by Brent and ward (2019), who explain that consumption helps to acquire endogenous information according the idea that households with high water bills may have a larger incentive to acquire accurate price information. This mechanism is not validated
12
in our study There are two potential explanations for our findings. The complexity of the tariff schemes may be one alternative explanation to interpret our result. Indeed, high level consumers belong to higher tiers than lower consumption levels consumers, and thus face a more obscure tariff scheme. Next, the specific context of Reunion island can also explain this difference, as high consumers generally live in houses including a garden, or a swimming pool. Corresponding levels correspond to a captive part of the water consumption, which is not varying with prices, see Binet et al. (2016) for more details. If we include sanitation, two new significant variables appear. Individuals leaving in a house are aware of the marginal price compared to others. Finally, declaring having a good knowledge of the bill amount has the same positive effect on price accuracy.
We observe a good average price accuracy (39.9% of households) when we exclude the fixed part of the tariff scheme). The main determinants of average marginal price knowledge are similar to those relating to marginal price including sanitation. Indeed, households facing a multipart schedule and leaving in a house increases their probability to correctly perceive the average price. And a higher income has a positive impact on the probability to be perfectly informed about average price. Finally, facing a bill frequency quarterly (factsem=0) might help individuals inferring the true average price by providing more information about the tariff scheme. As mentioned before, looking more frequently at their bill amount may help people forecasting the average price which is obtained by dividing the bill by the consumption level. Liebman and Zeckhauser (2004) talk about ironing in that case. Finally, when the household has access to a sewage network (Sanit=1), the unit price increases, because of the additional cost of this service, which is passed on to the water bill. Therefore, the probability to believe the price is low is reduced. The Creole variable is intended to distinguish Reunion Islanders, who have been natives of Reunion Island for several generations, from metropolitans, who have settled on the island more recently as part of their professional activity. The latter, unlike the Creoles, are more often required to stay in mainland France. Being creole reduces the probability to declare that water price is lower than the true value, compared to metropolitan people.
Our second empirical test addresses the price misperception issue looking at the comparison between the estimated perceived and marginal prices.
13
3.2 Explaining price misperception in behaviors
The ratio measuring the percentage of errors in household price perception, is the difference between current marginal price and the one taken into account by households in choosing their water consumption level, i.e. the perceived price, in relation to marginal price.
On the one hand, the method of estimating the perceived price leads us to conclude on average that the marginal price is underestimated, without being able to differentiate parameter k according to individual situations. On the other hand, the second method based on people's beliefs reveals that the majority overestimates the price of water and a minority underestimates it. By crossing the two variables, it appears that the percentage of error is higher and price equal to 16% when the household underestimates its marginal price against 7.6% otherwise.
Fractional probit model is used to identify the main determinants of the percentage error of price perception as the ratio has values between 0 and 1. Table 5 gives our empirical results.
Table 5. Marginal price misperception from the ratio, fractional probit model
Variable Pourcentage error
ratio Income NS Hsize NS Hcons 0.54*** (5.84) Billsem 020** (2.33) Block NS House NS Know NS Swim NS Retired NS Owner NS Sanit NS Creole -0.19** (-2.12) Number of observations 456
14
NS means statistically insignificant. Backward stepwise regressions are implemented and the final estimation model excludes all the insignificant variables. Variance Inflation test are used to check the absence of multicolinearity.
The results obtained confirm a part of results yet obtained. However, only three results stand out. First of all, being a high level consumer increases the underestimation of the price revealed by consumption choices. As explained before, it may be explained by the invariant share of the consumption, which is particularly important for large consumers in Réunion island according to Binet et al. (2016). This incompressible, price-invariant consumption was in fact estimated using an econometric model based on a Stone-Geary utility function, which allows it to be estimated using a specific parameter. This incompressible consumption mainly concerns outdoor uses, including garden watering. The result for billing frequency confirms the role of billing frequency in understanding water pricing, already highlighted by Whichman (2017). Indeed, billing twice a year increases the error of appreciation of the price of the last unit consumed compared to billing three times a year. Last, the result for the creole variable contradicts those obtained in Table 4. The role of this variable must therefore be considered with great care.
4. CONCLUSION
The objective and the originality of our paper are to compare the two different methods using the same survey data, carried out by the authors on Reunion Island. This allows us to compare the beliefs and behaviors of consumers all facing an complex increasing block tariff pricing scheme, and to give recommendation about the implementation of efficient nudging policies. To do so, we first are able to build and compare two indicators measuring the knowledge of the price of drinking water by households. We distinguish price knowledge based on beliefs from that based on observed consumption behaviors, which are conditioned by the degree of attention of the consumer. Then, we provide econometric estimation to identify the determinants of misperception.
Our results thus contribute to the literature in two ways. First, they confirm that household beliefs are at odds with their behaviors. Then, we can make practical recommendations on the implementation of informative price nudges for drinking water consumers. Nudges in the form of a marginal price recall as in Binet et al. (2020), must therefore be deployed during
15
periods of water consumption if a rebound effect on consumption is to be avoided. Indeed, outside these periods, the household's awareness of the marginal price may lead them to believe that the price of water is lower than they thought it was and thus favor a rebound effect. Indeed, nudges must be concomitant with consumption, with the price display fluctuating with consumption volume. Finally, using econometric models, we identify the main determinants of price knowledge. The objective of this last section is to identify the individual characteristics of households according to their errors of appreciation of the price of water in order to target nudging policies.
REFERENCES
Binet M.E., Denant-Boemont L., Hammiche S. (2020), The Incidence of Tariff Schedules and Price Information on Inattentive Consumers: A Laboratory Economic Experiment, working paper.
Binet M.E., Carlevaro F., Paul M. (2016), "La demande d’eau potable à La Réunion : estimation à partir de données d’enquête", Revue d’Economie Politique, vol. 126, pp. 155-91. Binet M.E., Carlevaro F., Paul M. (2014), Estimation of Residential Water Demand With Imperfect Price Perception, Environmental and Resource Economics, 59 (4), 561-81.
Brent, D. A., & Ward, M. B. (2019). Price perceptions in water demand, Journal of
Environmental Economics and Management, 98.
DellaVigna, S. (2009), Psychology and economics: Evidence from the field, Journal of
Economic Literature, 47 (2), 315-372.
Gabaix X. Behavioral Inattention. In: Handbook of Behavioral Economics, edited by D Bernheim, S DellaVigna and D Laibson. Vol. 2. Elsevier ; 2019. pp. 261-343.
Gabaix X. and Laibson D. (2006), Shrouded attributes, consumer myopia, and information suppression in competitive markets, Quarterly Journal of Economics, 121(2), 505-540. Gabaix, X. (2014), A sparsity-based model of bounded rationality, Quarterly Journal of
Economics, 129 (4), 1661-1710.
Ito K (2014) Do consumers respond to marginal or average price? evidence from nonlinear electricity pricing. The American Economic Review 104 (2), 537-563.
16
Mayol A (2017), Social and Nonlinear Tariffs on Drinking Water: Cuibono? Empirical Evidence From a Natural Experiment in France. Revue d’Economie Politique, 127(6):1161-1185.
OECD (2016), Recommendation on Water OECD Council, Technical Report, December. Shin J.S. (1985), Perception of Price When Price Information is Costly: Evidence From Residential Electricity Demand. Review of Economics and Statistics, 67(4), 591-598.
Wichman CJ (2017), Information Provision and Consumer Behavior: A Natural Experiment in Billing Frequency, Journal of Public Economics 152, 13-33.
Wichman CJ (2014) Perceived Price in Residential Water Demand: Evidence From a Natural Experiment. Journal of Economic Behavior & Organization 107: 308–323.
World Bank (2016), High and Dry: Climatic Changes, Water and the Economy, World Bank Group.