Delivery Optimization for a Make to Order Custom Wire Mill
by
Andrey L. Slivinskiy
M. S., Physics,
Lomonosov Moscow State University, 1996
Submitted to the Sloan School of Management and the
Department of Materials Science and Engineering
in Partial Fulfillment of the Requirements for the Degrees of
Master of Science in Materials Science and Engineering
and
Master of Business Administration
In Conjunction with the Leaders for Manufacturing Program at the
Massachusetts Institute of Technology
June 2005
@2005 Massachusetts Institute of Technology.
All rights reserv d.
Si gnature of Author _________________________
Sloan School of Management
Department of Materials Science and Engineering
Ma-v6, 2005
Certified by
Donald Rosenfield
Senior Lecturer, Sloan School of Management
Thesis Sunervisor
Certified by
(J
Thomas W. Eagar
Professor of Materials Engineering
Thesis,Supervso
Accepted by_
/
David Capodilupo
Executive Director of Masters Program
Sloan School of Management
Accepted by
TGerbrand
Ceder
R.P. Simmons Professor of Materials Science and Engineering
MASSACHUSETTS INSTVTTEChair, Departmental Committee on Graduate Students
OF TECHNOLOGY
SEP
0
1 2005
A
Delivery Optimization for a Make to Order Custom Wire Mill
by
Andrey L. Slivinskiy
Submitted to the Sloan School of Management and the Department of Material Science and Engineering in Partial Fulfillment of the Requirements for the Degrees of
Master of Science in Materials Science and Engineering and
Master of Business Administration
Abstract
In the face of growing competition in the Tantalum business, H.C.Starck's management is minimizing the delivery time for custom-made capacitor-grade tantalum wire products. H.C. Starck, Inc., Newton, Massachusetts faces challenges in its production environment to meet customer demand in an effective manner. Specific challenges include poor forecasting abilities, variation in customer demand, long component lead time, and expensive components.
For this study, the desired delivery time reduction is to be achieved by establishing intermediate inventory buffers, setting appropriate inventory targets in an order-up-to-level inventory management model that considers sources of variation, time requirements, and customer service goals.
We addressed a number of goals. First, we tied demand variability into traditional demand-focused models. Second, we develop more standardized and simplified inventory targets. Finally, we develop a production scheduling system that smoothes production, simplifies the
scheduling process, and helps in achieving desired customer service level and the inventory targets.
Thesis Supervisor: Donald Rosenfield
Title: Senior Lecturer, Sloan School of Management Thesis Supervisor: Professor Thomas W. Eagar
Acknowledgements
There are several people that I would like to acknowledge and thank for helping me conduct my research and complete this thesis. Their help, guidance and support made the internship experience a positive one and without them I would not have been able to complete this work.
First, I would like to thank H. C. Starck Inc. for sponsoring this project and making this thesis possible. The success of this project and its timely completion are very much due to the complete support and guidance given to me by my company supervisor Bob Balliett. He ensured I had access to all the resources I needed to complete my work and facilitated my smooth transition into the organization. Bob always made time to answer my questions and share his thoughts. I appreciated his efforts and valued his patience, insights and guidance.
I particularly want to thank the following people of the wire department who went out of their
way to help me and made me feel part of the team: Tony Parise, Kathleen Mullen, Thomas Morse, Muriel Lacroix and Marcia Casta.
I would also like to thank my advisors at MIT for their help, advice and support. Donald
Rosenfield was extremely helpful through numerous emails, face-to-face meetings, and on-site visits. I would also like to thank my other advisor, Thomas Eagar for his comments, guidance, face-to-face and on-site meetings and encouragement.
Finally, I would like to thank the Leaders for Manufacturing program for giving me the opportunity to go though this unique experience. This experience has opened my eyes to a bigger universe of issues, opportunities, and responsibilities.
Table of Contents
A b stract ... 3
Acknowledgements... 5
Table of Contents... 6
List of figures and tables... 8
Chapter 1: Introduction... 9
1.1 Thesis Objective . ... 9
1.2 Problem Statem ent... 9
1.3 Thesis Overview... 10
Chapter II: Background... 11
2 .1 S ettin g ... 1 1 2.2.1. Tantalum ... 11
2.2.2. Tantalum business... 11
2.2.3 Competition... 13
2.2.4 Capacitor M anufacturers... 15
2.2.5. Tantalum Processor Value Chain ... 15
2.3.1. Company overview... 16
2.3.2. Product overview... 19
2.3.3. Process overview ... 21
2.3.4.. Order fulfillm ent process... 23
Chapter III: Application of fram ework at H.C.Starck... 26
3.1 Understanding Customer Service M easurement... 26
3.2 Understanding Demand and Supply Parameters Which Affect Customer service level and inventory ... 31
3.2.1 .Dem and Variability... 31
3.2.2.Random Orders ... 33
3.2.3.Rolling horizon orders ... 37
3.2.4.Trends Seasonality... 37
3.2.5 Lifecycle... 38
3.2.6 Lead Time Variability... 39
3.2.7 Forecasts... 40
3.3 Use Power Chain Inventory Model to Evaluate and Design the Supply Chain... 41
3.4 Choose appropriate inventory models... 45
3.4.1 The Base Stock M odel... 45
3.4.2. Application of the Base Stock M odel... 50
3.4.3. W hen should the Base Stock model be applied? ... . . . . .. . .. . . .. . . .. . . 52
3.5.1. Pseudo-Heuristic approach... 52
3.5.2. Traditional (Probabilistic) approach... 55
3.6. Anticipation stock ... 58
3.6.1. W ire Availability... 58
3.6.2. Capacity... 60
IV. Summary... 62
4.1. Identify and make necessary changes to meet inventory targets... 62
4.2. Outstanding .issues... 64
4.2.1.Training ... 64
4 .2 .2 .S y stem s... 6 4 4.3. Establish regular review process... 64
4.3.2.M odel m aintenance ... 65
4 .4 . R esu lts... 6 5 4.4.1. Low er inventory... 65
4.4.2.Im proved custom er service . ... 65
4.4.3.Im proved inventory control... 65
4.4.4.Sim plified m anagem ent processes ... 65
4.5.Identify improvem ent opportunities... 65
4.5.1.Global Supply Chain opportunities... 66
4.5.1.Identify improvem ent opportunities... 66
Chapter V .Conclusion... 67
5.1 .Recom m endations ... 67
5.1.1. Process Developm ent... 67
5.1.2.Wire Technology and Manufacturing Department : Visual Inventory System... 67
Appendix A . SCOR M etrics Fram ework... 68
Appendix B. Month to month calculations for Base Stock Application for a "A" Item... 69
Appendix C. Month to month calculations for Base Stock Application for a "B" Item... 71
List of figures and tables
Figure. 1.1. Estimated worldwide resources of Ta in ore... 12
Figure 1.2 Wire sales volumes for H. C. Starck... 13
Figure 1.3 Tantalum demand by end market (2004)... 14
Figure 1.4 Tantalum Powder and Wire/Capacitor Value Chain... 16
Figure 1.5. Com pany Structure... 18
Figure 1.6. Custom Made Capacitor Grade Tantalum Wire Hierarchy ... 20
Figure 1.7. Current Tantalum Wire Process Flow... 21
Figure 1.8. Current Order Process Flow ... 24
Figure 1.9. Academic definition of "service level... 27
Figure. 1.10. Wire On Time Shipment Rate By Line Items... 27
Figure 1.11 On Time Shipment and Capacity Constraint.... ... 27
Figure 2.1 Sample of the H.C.Starck monthly On Time Shipments report... 28
Figure 2.2. Custom made Ta wire sales trend (lbs) (1995-2004)... 32
Figure 2.3. Types of D em and... 32
Figure 2.4. "A"- and "B"-types Wire Demand... 35
Figure 2.5. Inventory Building Roadm ap... 36
Figure 2.6. D em and Seasonality... 37
Figure 2.7. Ta Wire Manufacturing process flow... 38
Figure 2.8.1. PCI Model Proposed and Optimized Configuration of WMTD's manufacturing design (Proposed Configuration with 3 buffers) ... 41
Figure 2.8.2. PCI Model Proposed and Optimized Configuration of WMTD's manufacturing design (Proposed Configuration with 2 buffers after stages 1 and 2) ... 42
Figure 2.8.3. PCI Model Proposed and Optimized Configuration of WMTD's manufacturing design (Optimized Configuration with 1 buffer after stage 1) ... 43
Figure 2.9 Graphical representation of the base stock model... 46
Figure 2.10 Sources of Variability in the Supply Chain... 48
Figure 2.11. Graphical representation of the periodic review base stock model... 49
Figures 2.12. Base Stock Application for a "A Item"... 50
Figures 2.13. Base Stock Application for a "B Item"... 51
Figure 2.14. Pseudo-heuristic way of setting inventory targets... 53
Figure 2.15. Inventory targets calculator... 54
Figure 2.16. Traditional (probabilistic) way of setting inventory targets... 56
Figure 2.17. Monte-Carlo generated FGI distribution for "parent diameter" 0.0287 wire... 56
Figure 2.18. A nticipation stock... 58
Figure 2.19. "B-type" Order Calculator... 61
Figure 3.1. "Parent diameter 0.02 87" wire Actual and Target Inventory... 63
Figure 3.2. "Parent diameter 0.0346" wire Actual and Target Inventory... 63
Figure 3.3. "Parent diameter 0.0422" wire Actual and Target Inventory... 64
Table. 1: W ire B reakdow n... 33
Table 2. Service level and the safety factor Z... 46
Table 3. Summary of Base Stock application for"A" and "B"-types wire... 51
Table 4. Results of Base Stock application for"A" -type wire... 55
Table 5. Comparative results of two approaches to Base Stock application ... 57
Table 6. Unstable Demand Order Example... 59
Table 7: Proposed Anticipation Stock Targets (relative lbs)... 59
Chapter I. INTRODUCTION
1.1 THESIS OBJECTIVE
The objective of the work described in this thesis was to minimize the delivery time for custom made capacitor grade tantalum wire products produced in the wire manufacturing facility of H. C. Starck Inc. (a wholly owned subsidiary of Bayer Material Science Company) in Newton, Massachusetts and sold worldwide. Specifically, the desired delivery time reduction was to be achieved by establishing intermediate inventory buffers, setting appropriate inventory targets in an order-up-to-level inventory management model that considers sources of variation, time requirements, and customer service goals.
This work is the product of collaboration between H. C. Starck and the Leaders for Manufacturing program at MIT. The data presented in this thesis was collected in the wire
manufacturing facility of H. C. Starck in Newton, Massachusetts.
1.2 PROBLEM STATEMENT
Shortening order-to-delivery (OTD) times is a strategic business goal for companies in many industries and the wire production industry in particular. Advantages of shorter delivery times include the ability to respond more quickly to the customers requirements, avoidance of the lost sales due to lack of raw materials and semi-finished products and elimination of manufacturing inefficiencies related to excessive or unusable inventory. On the other hand the pressure to reduce inventory investments in supply chains has increased as competition expands and product variety grows. Managers are looking for areas they can improve to reduce inventories without hurting the level of service provided to customers as supply chains become leaner.
In the face of growing competition in the Tantalum business, H.C.Starck's management is minimizing the delivery time for custom-made capacitor-grade tantalum wire products. The company faces challenges in its supply chain and production environment to meet customer demand in an effective manner. Specific challenges include poor forecasting abilities, variation in customer demand, long replenishment and production lead times, and expensive raw material.
Inventory serves as a buffer against for uncertainty and variability in the supply chain In order to provide the customers with high levels of service, the manufacturer needs to maintain increased amounts of inventory. Also by carrying inventory manufacturing firms can insulate or buffer their performance from the effects of supply chain variability. The amount of inventory a company must hold to meet required or a desired customer service level (CSL) depends on the level of variability in supply and demand.
In the face of these challenges the company must answer these fundamental questions:
What is the best way to maximize the probability of meeting the customer's delivery time expectations at minimum cost?
Where inventory should be held to effectively meet delivery targets at minimum cost? What is the appropriate level of inventory on a production floor to meet customer demand? Once these inventory targets have been set, how can they be met and maintained?
By answering these questions H.C.Starck is able to successfully improve customer
responsiveness of its supply chain. This thesis analyzes the customer-facing aspects of H.C.Starck's manufacturing design and will focus on optimization of inventory levels and inventory placement using the concept of "service level".
1.3.THESIS OVERVIEW
This thesis has four main sections. Sections 1 and 2 include background material describing the setting for this research. Section 3 describes the framework that was used to set appropriate inventory targets and the application of this framework at H.C.Starck's Wire Manufacturing and Technology Department production floor. Section 4 provides conclusions and recommendations. For reasons of confidentiality some data (including volumes, forecasts, etc.) in this thesis has been disguised.
Chapter 11. BACKGROUND:
2.1. SETTING
I conducted the research for this thesis at wire manufacturing facility of H. C. Starck Inc. (a
wholly owned subsidiary of Bayer Material Science Group) in Newton, Massachusetts, from June through December, 2004.
H.C. Starck is a major international producer of tantalum and niobium products for the
electronic, semiconductor, chemical, pharmaceutical and other specialized industries. Capacitor grade tantalum wire is a critical component in the manufacture of capacitors for the electronics industry. A leader in the global passive electronic components industry since its inception, H.C. Starck has continued to maintain its strong position through high quality product offerings in demanding applications.
Subject of my research was the H.C. Starck Wire Technology and Manufacturing Department (WTMD) capacitor grade tantalum wire production process.
2.2.1. TANTALUM
Tantalum is a rare metal, gray in color, malleable, ductile, behaves mechanically similar to steel, has a very high melting point (2,996 'C), and has a resistance to corrosion superior to Titanium. These unique physical properties and high cost define its uses.
Tantalum was discovered in 1802 by Anders Gustav Ekeberg of Sweden using an ore sample from Kimito, Finland. He named the newly discovered element after King Tantalus of Phrygia, from Greek mythology, who was condemned to eternal frustration by standing up to his neck in water that receded when he tried to drink it. Ekeberg shared King's Tantalus frustration when he tried to isolate tantalum (Hunziker, 2002).
Tantalum has many uses due to its particular physical properties. Its oxide exhibits exceptional dielectric properties such as very high volumetric efficiency and reliability. Tantalum's corrosion-resistant character, similar to glass, is ideal for chemical processing, and makes it one of the best materials for body implants. Tantalum improves the refractive index of lenses to make them thinner, and it provides X-rays with a brighter image, while reducing the radiation dosage to the patient (Hunziker, 2002).
2.2.2.TANTALUM BUSINESS
The business challenges faced by a tantalum wire producer are better understood once one is aware of the whole tantalum value chain. Tantalum starts off in the earth as a mineral; tantalite, microlite, and wodgilite primarily. However, it is common practice to use the name tantalite for the tantalum mineral (Tantalum-Niobium International Study Center website). Tantalum is usually bound to Oxygen forming a tantalum oxide.
Tantalite is mined, and it goes through the common beneficiation processes to separate the tantalite mineral from all the other minerals that together made the specific rock formation mined. For example, to separate metal from ore the solvent extraction technology is utilized. Tantalum is separated from niobium by reacting the ores with a mixture of hydrofluoric and sulfuric acids at high temperatures. Tantalum is then recovered as either potassium tantalum fluoride (K2TaF7), or tantalum oxide (Ta205), and niobium is recovered as niobium oxide
(Nb205). After the tantalite is separated, it is sold to a specialty materials company such as
H. C. Starck Inc., which transforms it to the tantalum powder.
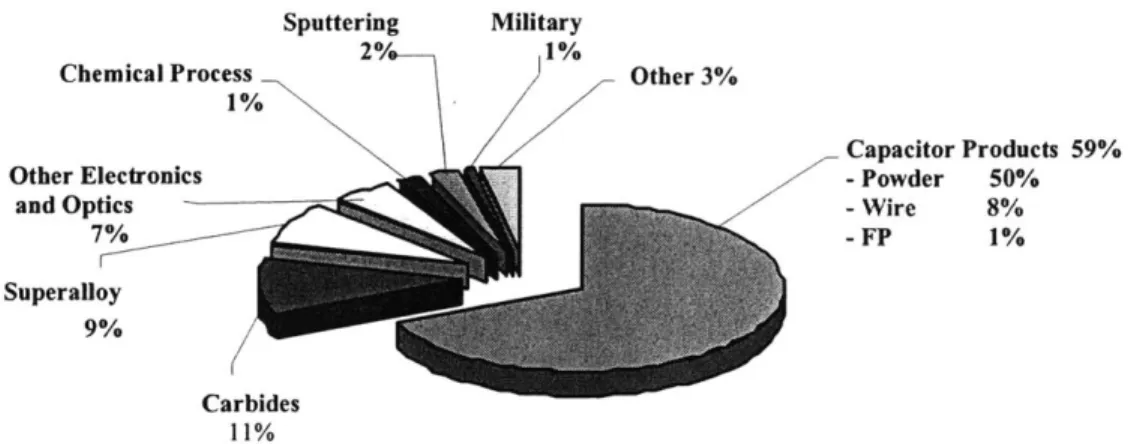
Because of tantalum's high melting temperature and high affinity for oxygen, a number of tantalum metal products are produced through powder metallurgy methods. Tantalum powder is usually produced by reducing potassium-tantalum-fluoride with sodium in a molten salt system at high temperature. Tantalum powder is sintered (consolidated) into bars to produce wire. A significant portion of the tantalum produced, about 50% (Tantalum-Niobium International Study Center website), is sold as capacitor grade powder and only 8% is sold as tantalum wire. More than 90% of the tantalum wire produced is used for capacitor anodes. The consolidation of metal powder for ingot and processing into various metallurgical products begins with either vacuum arc melting or electron beam melting of metal feedstock; comprised of powder or high purity scrap where the elements with boiling points greater than tantalum are not present. Double and triple melt ingots achieve a very high level of purification.
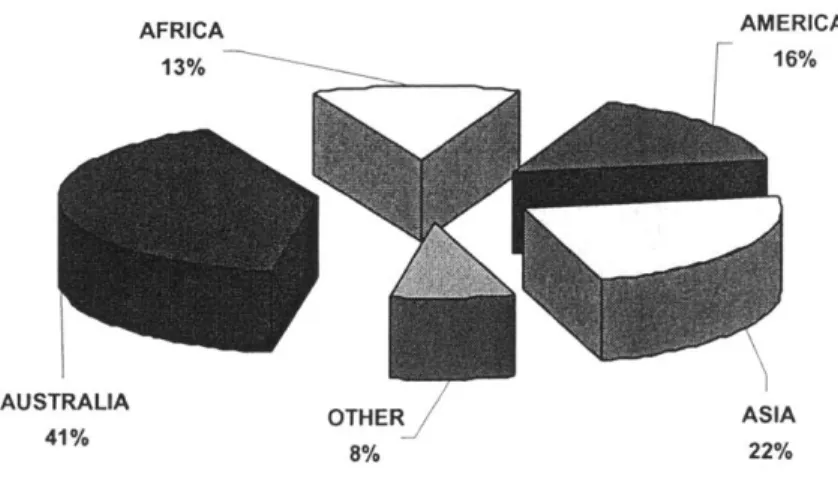
Tantalum ores are found primarily in Australia, Canada, Brazil, and central Africa, with some additional quantities originating in Southeast Asia. The average yearly growth rate of about 7 to 11% in tantalum demand since about 1995 has caused a significant increase in exploration for this element.
The Sons of Gwalia Ltd. from its Greenbushes and Wodgina mines in Western Australia operates the largest source of tantalum mineral for the moment. These two mines combined produce between 25 and 35% of the world's supply, with production in 2004 reported at approximately 2.5 million pounds.
Tantalite is also mined in Canada, Ethiopia, China, and Brazil. The central African countries of Democratic Republic of Congo, and Rwanda used to be source of significant tonnages.
AFRICA AMERICA
13% 16%
AUSTRALIA OTHE ASIA
41% 8%
22%
Figure 1.1. Estimated worldwide resources of Ta in ore
(633mln lbs of Ta contained ore) (2000)
Representatives passed a resolution in September 2001 that banned the purchase of tantalum from the Congo. Tantalum's price skyrocketed to over $500! pound, an increase of ten-fold within several months, in the face of distorted news stories about shortages. Slogans, like "Blood Tantalum" and "No Blood on my Mobile," became haunting symbols of the scramble for tantalum among major corporations that locked in astronomically high contract prices for future delivery of the rare metal from legitimate sources. In June 2003, The UN Security Council issued a statement on the "Illegal exploitation of natural resources and others forms of wealth of the Democratic Republic of the Congo." In that statement, the panel of experts recorded the reactions of individuals, corporations and countries involved in the tantalum business.
The Tantalum capacitor market, along with the rest of the electronics industry collapsed at the beginning of 2001. The wire part of the business has been the first to "recover." The WMTD has led profitability for the site for the last 3 quarters of 2003, while many other departments were loosing money. That was the first indicator of the market recovery in 2003. During 2004 the Tantalum wire business not only "recovered" from the collapse at the beginning of 2001 but also the sales exceeded its 2000 demand-peak in the second part of
2004, when all wire manufacturers had to operate at theirs capacities.
Figure 1.2 shows the recovery in wire sales volume. 2003 was already an improvement in wire sales, and 2004 sales exceeded shipments in 2000.
Thousands of Pounds 160 142 140 80 20 0 1999 2000 2001 2002 2003 2004
Figure 1.2.Wire sales volumes for H. C. Starck
The effect of the market collapse of 2001 was a price war not seen before in the industry. Unfortunately this effect will probably not fade away. The average tantalum wire selling price has been going down consistently since 2000, and it is predicted to keep going down in the following years. This creates a tremendous pressure on wire producers to reduce cost in a way that they had not seen before. As a result, the custom made wire production was below break-even in the second half of 2004.
2.2.3. COMPETITION
Tantalite, the raw material, is a commodity and there are no supply issues at this time. The moderate influence that suppliers have is reflected by the fact that a large portion of Tantalite is purchased on long term take-or-pay contracts. Capacitor factories can produce Tantalum capacitors with Tantalum wire from any of the four producers, there are virtually no switching costs.
The tantalum industry is well established and there are considerable barriers to entry due to the complexities of Tantalum production technology and high capital investment required. For space constrained applications, Tantalum capacitors have no current substitute. The market for Tantalum products used to be controlled by only three firms. In general, this would point towards low rivalry; however, Ningxia Metals (People's Republic of China) has steadily grown from a small player to a major one and is threatening the status quo of competition in this industry.
Sputtering Military
20/ 1%
Chemical Process Other 3%
1%
Capacitor Products 59%
Other Electronics -Powder 50%
and Optics -Wire 8%
7% - FP 1%
Superalloy
9%
Carbides 11%
Figure 1.3. Tantalum demand by end market (2004)*
*Approximate Yearly Tantalum Demand - 5,000,000 lbs
Ningxia Metals' low cost structure has enabled them to be a low cost provider of Tantalum products, with the net effect of eroding average selling prices. As a result Ningxia Metals aggressive marketing policy led to wire production below break-even in second part of 2004. H. C. Starck's main competitors in the Tantalum business are Cabot Performance Materials,
Showa Cabot Supermetals and Ningxia Non-Ferrous Metals. Together with H. C. Stack they are the most significant players in the Tantalum business. Below is a short description of these two key competitors in the Tantalum powder and wire businessi.
a. Cabot Performance Materials, http://www.cabot-corp.com. In 1978 Cabot acquired a tantalum processing facility in Boyertown, Pennsylvania. Cabot has an interest in a number of raw materials suppliers (producers of concentrate). This includes an equity investment in Sons of Gwalia, as well as the Tanco Mine. Cabot Corp. is a publicly traded company whose shares trade on the NYSE under the symbol CBT.
b. Showa Cabot Supermetals produces capacitor grade tantalum powder by the sodium
reduction of imported potassium flourotantalate at its plant in Kawahigashi-Machi, Kawanuma-Gun, Fukushima Prefecture of Japan. The plant produces Ta powder, Ta tubes rods and sheets. The company also acts as an agent for the marketing of imported tantalum products from Cabot Performance Materials (USA).
manufacturers; Vishay Intertechnology. Ningxia is headquartered in the People's Republic of China and has operated for many years as a low cost producer. Tantalum powder and tantalum wire are the main products offered by Ningxia.
2.2.4. Capacitor Manufacturers
Company Name Description Website
AVX Tantalum AVX makes the world's smallest http://www.avxc Corporation tantalum capacitor. It is controlled orp.com
by Kyocera.
Kemet Electronics Corp. Kemet specializes in solid
tantalum and multi-layer ceramic http://www.keme capacitors. The company began t.com
publicly trading its shares in 1992,
and is the largest manufacturer of solid tantalum capacitors.
NEC Corp. NEC's tantalum capacitors
provide advanced technological http://www.necel. design and performance com
characteristics such as filtering,
bypassing, decoupling, blocking
and RC timing circuits for industrial, entertainment and medical electronics use.
Vishay Intertechnology Vishay makes most of the small
components necessary to build a http://www.visha typical mobile phone. Its y.com
components are in many products including wireless devices and military products.
2.2.5.TANTALUM PROCESSOR VALUE CHAIN
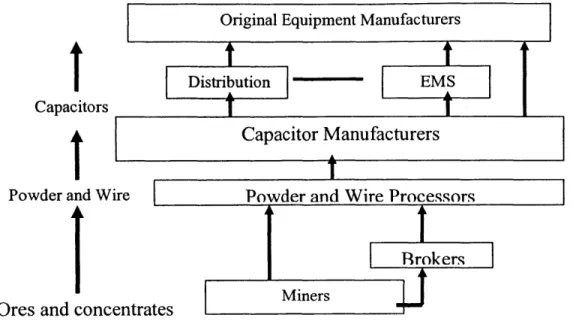
H. C. Starck, GmbH. (Goslar, Germany) buys ore from Sons of Gwalia Ltd. (Western Australia) who operates the largest source of Tantalum and is responsible for separation of the tantalite mineral mined. Tantalum mineral is shipped to Germany, where the company concentrates and refines it into oxide. Tantalum "double salt", K2TaF7, free-flowing white powder, is shipped from Germany in pallet-sized containers to the Ta powder production operations worldwide, including to the company plant at Newton, MA. A large portion of the powder is further refined and graded, and sold for the production of sintered tantalum capacitors. Some of the powder is sintered into bars for the production of wire, also mostly for capacitors. Finally, H.C.Starck sells powder and wire based on the needs of the capacitor makers. This wire is sold to the capacitor manufacturers, who in their turn sell their products to the original equipment manufacturers (OEMs) of computers, upscale cellular phones and
PDAs who in their turn sell their products to the end consumer. Figure 1.4 shows the tantalum powder, wire and capacitor value chain.
SDistributio
EMSCapa
Ir
Original Equipment Manufacturers
Capacitor Manufacturers
APowder and
Wire
Powder and
Wire
Processors
I
Ir
Brokers
Miners
Ores and concentrates
Figure 1.4. Tantalum Powder and Wire/Capacitor Value Chain
2.3.1. COMPANY OVERVIEW
In the 1980s, H.C. Starck GmbH was purchased by Bayer AG (Germany), and H.C. Starck Inc. became a wholly owned subsidiary of H.C. Starck. HC Starck controls the majority of their production from their facilities in Germany, Japan and the United States.
The company is organized into departments aligned with the industry and customers they serve: hard metals (HM), chemicals and mill products (CH), electronics and optics (EO), surface technology and advanced ceramics (OK), and fabricated products (FP).Two of these business units operate at the Newton site; Electronics and Optics (EO) and Fabricated Parts (FP). There is also a Site Services group in Newton that consists of all the service functions at the plant such as human resources, accounting, maintenance and engineering, quality control and safety. The EO group is primarily responsible for the production of tantalum powder, and tantalum wire. The FP group is primarily responsible for the production of fabricated tantalum parts such as alloy additives and sputtering targets.
The wire department reports to the EO group in Newton. The wire department owns research and development as well as production of Tantalum, and Niobium wire. The Newton wire factory is the only wire manufacturing facility at H. C. Starck. Therefore it produces wire sold in North America, Europe and Asia. More that 90% of the Tantalum wire produced is sold to the capacitor manufacturers; a small quantity is sold to medical implants companies. The wire department is operated and managed by small group of people. There are 300 people on site. The factory runs 3 shifts Monday through Friday, and 2 shifts Saturday and Sunday. H.C.Starck has a very engineering and data-driven culture. Originally being founded
by two MIT grads, H.C.Starck ( former NCR ) successfully continues to thrive and prosper through the tradition of innovative production and products quality.
BAYER GROUP
I
Bayer Material Science - Operating Sub-Group I.C. Starck Gmb I- Wholly owned subsidiaryO.C. Starck Inc. - Division of H.C.Starck GmbH
lectronics & Optic bricated Products Iardmetals Chemicals
Surface Technology & Ceramics -Five HCST Business Groups
H.C. Starck GmbH & Co.
KG
MI Corpit Staff flpnaItmottS
CH Chemicals and Mill Prnefisete OK Surface Technology and Advanced FP Fabricated Products MSO and RV Marketing Services Public Relations
Law and Insurance
FR FE
Finance and Research and Accounting Develoment
MW PT
Procurement Production and Engineering
PS
Human Resources Central Divisions
H.C. Starck Inc
HM Hardmetal-Industry EQ Electronics and Optics Business GroupsE~ **EEhI~ I I - II
--2.3.2. PRODUCT OVERVIEW
The Tantalum wire made from powder is the main component of tantalum capacitors. The tantalum powder is mixed with a binder material and pressed around a small piece of tantalum wire to make a "slug." Then, the binder material is driven off by vacuum at about
1500 C. This is followed by sintering at high temperature (15000 C- 20000 C) under vacuum. A very dense and high surface area tantalum anode is created. The next step is anodization,
which would create a thin amorphous, dielectric layer of tantalum pentoxide on the sintered powder structure. Tantalum is valve metal, and the amorphous pentoxide grown is able to form a uniform, closely coupled layer over the tantalum surface. Figure below shows an SEM picture of a slug which has been cracked into two pieces to show the dielectric layer.
SEM showing dielectric layer
Tantalurn metal
Tantalum Pentoxide (Dielectrie)
The cathode plate is produced next. This is achieved by pyrolysis of manganese nitrite into manganese dioxide. The "slug" is dipped into a manganese nitrate solution and then baked in an oven at approximately 250* C to produce the manganese dioxide layer. Usually several external contact layers are applied; a graphite layer, a silver coating, and a silver-loaded epoxy layer. The anode and cathode wires are dipped in solder, and finally the assembly is dipped in an epoxy resin leaving exposed the anode and cathode terminations (Gonzalez,
2004).
By manufacturing utilizing powder metallurgy processes, H.C. Starck wire meet the rigid
requirements of the electronic capacitor industry by offering high performance in demanding applications. The two types of tantalum wire produced by H.C. Starck, TPX and GPX, have been specifically developed for use as lead wires in wet-, solid- and foil- type tantalum capacitors.
H.C. Starck's specially engineered capacitor grade tantalum grade wire provides improved
straightness, grain size stability and ductility over a wide range of sintering temperatures. The company plant at Newton currently produces its capacitor grade tantalum wire in three different alloys and four different tempers which together with a large number of required finished diameters result in more than 100 different custom-made final products (Figure 6.).
Alloys: TPX 97% Tempers: TPX Annealed 41% 1.1" 0 1 -- Half- Hard
hard
Extra-Hard - 0.1030" -- 0.0693" - 0.0346" - 0.0287" -- 0.0568" pI
* I
arent Diameters:0.0422" TPXAealed 52%
0.0422"
0 Finished Diameter: 0.0 114"0 0.0114" TPX Annealed 7%Figure 1.6. Custom Made Capacitor Grade Tantalum Wire Hierarchy
Example: Wire 0.0114" TPX Annealed GPX
FPpy
Main Parent Diameter: 0.103" TPX Annealed 100%
1 0.1030"0
I I
2.3.3. PROCESS OVERVIEW
Tantalum wire is produced by pulling a tantalum bar through subsequent rolling and drawing operations. Annealing is needed several times to relieve stresses generated by the significant deformation that goes on during rolling and drawing (accumulation of dislocations in the lattice), and to restore Tantalum's ductility. A process unique to Tantalum and perhaps unique to H. C. Starck is the deposition of a thin oxide layer on the surface of the wire to help the material flow through the rolling and drawing dies. Tantalum is a very malleable metal, which helps in the wire making process. It means that it can undergo significant deformation without cracking and/or breaking. On the other hand, Tantalum is a very reactive metal as well, therefore, it would react with almost any surface that it becomes in contact with. This is particularly challenging for the drawing operation where the Tantalum coil/wire is pulled through a small aperture of a tungsten carbide die. If no precautions are taken, such as coating the tantalum wire with an oxide layer, the Tantalum would react with the die material and quickly "gum-up" the die leading to a wire break.
At H. C. Starck the starting bar is 1.1 inches in diameter and about 28 inches long and weights 20 lbs. The processes used to convert this bar into capacitor grade tantalum wire are shown below in Figure. 7 and described in the text below.
The processes currently used to make Tantalum wire at H. C. Starck involves the following process-steps (The process steps correspond to the numbers on each process shown in Figure
7.):
1. Point: The two ends of the bar are "pointed" (reduction in diameter) to prevent cracks during the following rolling operation.
2. Rod Roll: The first rolling operation takes the bar from 1.1 inches in diameter down to 0.42 inches in diameter. This operation produces a square bar due to the shape of the rollers. Due to adiabatic heating this first rolling step is paused half-way through to let the bar cool down so it is safe to be handled by the operator.
3. Coil: The resulting bar is formed into a coil. The purpose of this operation is to
maximize the throughput of the cleaning, oxidizing baths as well as the annealing furnace.
4. Clean and Etch: The coils are cleaned to remove the lubricant used during rolling as well as any dirt from the surface of the coil. The surface of the wire is etched away in
a chemical bath to remove contaminants and leave a fresh Tantalum surface.
5. Batch Anneal: The coils are then annealed at a very high temperature to relieve the
stresses build up during rolling.
6. Rolling 2: This second rolling operations takes the coil and further reduces its
diameter in 3 passes. Each pass lead-time is twice more than that of previous one. It
takes 4 hours to draw a 1,800.00 pounds of wire once. Second and third passes average 8 and 16 hours correspondingly. The coil has still a square cross section after this operation. This mill has 3 sets of groves that are aligned for each pass, stretching the wire to smaller and smaller diameter.
7. Rolling 3: The final rolling operation takes the coil down to 0.103 inches in diameter
and gives it a semi-round cross section in a single pass.
8. Clean and Etch: The coils are cleaned to remove the lubricant used during rolling as
well as any dirt from the surface of the coil. The surface of the wire is etched away in a chemical bath to remove contaminants and leave a fresh Tantalum surface.
9. Batch Anneal: The coils are then annealed at a very high temperature to relieve the
stresses build up during rolling.
10. Batch Oxidize: In order for Tantalum to be drawn (pulled through a small orifice) a
smooth homogeneous coating is needed. At H. C. Starck, a process was developed to grow a thin Tantalum oxide layer on the surface of the wire to accomplish this. Exposing the coils to oxygen at high temperatures grows an oxide layer. Both temperature and time and carefully controlled to produce the right type and thickness
of oxide in the surface.
11. Coarse Drawing: A wire drawing machine is used to pull the coil through a series of
dies with increasingly smaller apertures. These drawing machines are typically used in every standard wire making operation such as steel or aluminum wire.
12. Clean and Etch: The coils are cleaned to remove the lubricant used during rolling as well as any dirt from the surface of the coil. The surface of the wire is etched away in a in a chemical bath to remove contaminants and leave a fresh Tantalum surface.
13. Batch Anneal: The coils are then annealed at a very high temperature to relieve the
stresses build up during rolling.
14. Oxidize: a thin Tantalum oxide layer is growing on the surface of the wire.
15. Final Draw: Final draw is mechanically and conceptually the same process as coarse
draw, but the wire is taken to its final diameter. It is the most critical process step because: it determines the mechanical properties of the final product (elongation, and
tensile strength), and is the only process where defects in the wire would not be erased
by the next operation.
16. Strand Anneal: Annealing after final draw is necessary to achieve high elongation and
ductility required by some customers. Therefore, some of the wire goes through an annealing process in which a single strand of wire is passed through a vertical heating element under inert atmosphere at very, very high temperatures. The temperature needs to be even higher than in the batch annealing process because of the short time the wire spends in the hot zone. There are two annealing work stations with different machine rate (lbs/hr). To minimize lead-time of its operation about 80% of processed wire goes through the faster strand annealing machine #1.
17. Spooling: The finished wire, with the right diameter and mechanical properties is
re-spooled into smaller quantities, and specific spool geometries depending of the customer. An assumption was made here that 70% of finished product is required to be made on a pattern level which is characterized by less fine winding, but takes half as much time than level grade- spooling does.
18. Inspection: Diameter, chemical composition, mechanical properties, and current
surface leakage are checked on a sample of every shipment of wire.
19. Package: Each spool of wire is wrapped, bagged, and put into a box to protect the
wire during travel.
2.3.4. ORDER FULFILMENT PROCESS OVERVIEW
Order Generation and Order Processing Stage
The supply chain starts with the generation of customer orders. Order generation involves a multitude of activities and interactions. Developing a relationship with the customer to determine their needs and how the organization can best meet them is critical. This function is most often performed by the sales and marketing groups through two-way interaction with the customer. In addition, the product development and engineering groups play a key role in this stage through their interactions with both the customer and the sales and marketing groups. Since product development and engineering are responsible for developing solutions to the customers needs, it is essential that they are involved in this stage of the supply chain. It is important to note that sales, marketing, product development and engineering must continually communicate with manufacturing to ensure that the organization can produce what the customers want when they want it.
H.C. Starck's order fulfillment process starts when the customer places an order directly with
H.C.Starck either through the phone, fax or face-to-face with a sales representative. Orders are then prioritized for scheduling purposes.
A new schedule for manufacturing is made every week. The materials are also received from
the suppliers almost weekly according to the schedule. The orders are built based on customer requirements.
Once the orders are generated from customer needs, they need to be processed in a way that enables the other stages of the supply chain to satisfy the orders. Order processing primarily revolves around information flow and information management. In a more traditional sense, customer orders are sent to manufacturing in a timely manner with all pertinent information clearly stated so manufacturing can initiate production. The customer order must be tracked from its origin until the order is complete (i.e. the customer need has been satisfied). In
addition, order processing involves capturing customer data so that the information can be utilized in a useful way (i.e. to improve forecasting accuracy, to quantify demand variability, and to identify potential customers for new products).
At H.C.Starck the information flow, as shown in Figurel.8, is controlled by SAP/R3. A custom ABAP (SAP's programming language) report was created to control all steps in the process, reducing a period of time starting from first step (CO) to the third step (PO) to one business day. Even though SAP is used, not all information flows were handled by the system in a real-time mode. For example lead time data for each stage was input in SAP only at the end of production cycle. As a result of it the lead time was distorted and elongated almost by 25%.
Manufacturing Stage
Manufacturing involves a number of substages. The product may go through several different operations and processes before it reaches its end state. Each separate operation can be considered as an individual substage within the overall manufacturing stage.
Customer Order Sales
Order
ProcessOrder(s)
Material Issue(s) & Test Products Receipt(s)Products
Shipping(s)Figure 1.8. Current
Order Process Flow
The company uses a fixed production schedule to minimize equipment downtime. Depending on batch size, wire type and diameter and the lead time of tantalum wire production can vary significantly. WMTD has a lead time between 28 and 47 days for its products (from receiving the sale order to the shipment). There was pressure from the Sales Department to reduce it to one week in an attempt to increase customer service satisfaction level. There are several reasons that contribute to the long lead times. The long lead time is mostly the result of the succession of steps necessary to obtain a final product. Also, the equipment traditionally used for wire making such as rod rollers, wire mills, and wire drawing machines involve long set-up times. Careful analysis of this data showed that lead times were not as high as initially thought. Both mean and median lead times were less than 33 days vs. the general perception of at least 40 days.
In order to reduce lead time from production to customer, we recommend positioning intermediate inventory of partially finished goods down stream along the production process flow to satisfy customer demand faster while reducing demand variability through the risk-pooling effect. Risk-pooling effect reduces demand variation since demand variability on more high aggregate level ("parent diameters wire") is less than on the lowest level ("finished wire")
As we aggregate demand across different types of finished wire, it becomes more likely that the high demand from one finished wire will be offset by low demand from the other wire.
The company manufactures its product in successive operations, each one having its own ordering process, with apparently no intermediate inventory between the phases. So, for each final product, several sequential steps have to be completed. This widespread use of "make-to-order" at each stage is justified by the company because
there are "too many types of finished wire": implementation of a "make-to-stock" policy thus does not make a sense. We can question this assumption because less of the half customers generate the majority of the demand. Most importantly, we can question why every finished wire, even with the smallest diameter, is made from the 1. 1" bar and not from some intermediary stock of so-called "parent diameters" wires of smaller diameter. Placing partially finished wire inventory into the buffer separating final production stage from preceding, we would have only one order to reach the final diameter. So, each product will be made to order, but from a closer stock in the manufacturing process.
The company thus needs to conduct an analysis of the parts for each alloy and for each diameter range (l.l"-0.42", 0.42"-0.103", 0.103"-0.0346", etc...) in order to determine at which stage they must place intermediate inventory, and which quantity. Recommendations are made later in this paper. Finally, manufacturing needs to work with the logistics group to ensure their products are delivered to the customer when promised
Logistics Stage
The logistics stage is responsible for delivering the products that are produced in the manufacturing stage to the end customer. This stage may involve the use of warehouses or distribution centers to hold the product until the customer's desired delivery date. In addition, distribution may involve interactions with outside entities such as transportation carriers (truck, rail, ship, and air), distributors, third party logistics providers, and end customers. The logistics stage may also involve participation at the front end through the delivery of raw materials and components.
Logistics operations can be classified into four main areas: Acquisition of Material: Initial purchase and reprovisioning; Management of Resources; Warehousing; Distribution and
Redistribution of material; Maintenance (Repair or Overhaul); Disposal.
H.C.Starck logistics comprises its logistics department, tracking and air carrier companies. Logistics operations that can be classified into four main areas: acquisition of material, initial purchase and reprovisioning, management of resources, distribution and redistribution of material; maintenance (repair or overhaul), disposal for the receiving incoming materials, The goal of logistics department is to reduce supply chain costs while enabling warehouse management system and transportation management system advanced supply chain processes
by integrating WMS and TMS. H.C.Starck's warehouse management system includes
activities related to inbound logistics such as receiving, inventory control, physical count and inbound quality assurance. Another goal of the logistics department is to reduce labor associated with receiving and inventory control functions, reduce on-hand inventory, eliminate write-offs, and improve order fill rates through increased inventory accuracy, The transportation management system focuses on outbound logistics activities such as loading, pallet build, carrier selection and shipping. The goals of the transportation management system are to lower outbound logistics costs by enabling carrier re-evaluation after an order is completed, reduce labor associated with order release, picking, packing, staging, and shipping, improve customer service by reducing shipping errors, improving lead times, ensuring customer compliance and increase throughput by optimizing fulfillment processes.
Chapter III. APPLICATION OF FRAMEWORK AT H.C.STARCK
While at H.C.Starck I developed a set of tools that are appropriate for setting inventory targets throughout the wire production process. My long-term goal is to embed these tools into the Wire Technology and Manufacturing Department's (WMTD) production and inventory management processes. This set of processes would then constitute an effective framework for providing required level of customer service and managing the inventory level. This section also discusses the progress that we made while I was at H.C.Starck, and highlights the work that remains to be done. The steps that we followed to implement the framework are:
1. Understand measuring customer service
2. Understand demand and supply parameters which affect inventory
3. Evaluate and propose an enhanced manufacturing design
4. Choose an appropriate inventory model and use it to establish the appropriate inventory targets
5. Use the base stock model base stock model adapted to account for lead time variation to
determine the appropriate inventory targets for WMTD
6. Develop an anticipation stocking strategy for orders with unstable demand 7. Identify and make necessary changes to meet inventory targets
8. Identify improvement opportunities 9. Establish a regular review process
Section 3 corresponds to these steps. The final section describes projected results.
3.1 Understanding Customer Service Measurement
One of the prerequisites for increasing customer responsiveness is understanding, implementing corresponding delivery fulfillment performance metrics and ensuring that proper indicators are in place to measure and provide visibility to those aspects of the supply chain that impact customer service the most. This section will examine how H.C.Starck measures customer service today from a supply chain perspective, and provide recommendations for implementing a comprehensive set of customer-focused metrics.
How "service level" is defined for H.C.Starck's WMTD wire business? One of the first challenges in applying traditional inventory models to H.C.Starck's wire business is coming up with a specific and clear definition for "service level" since this term can be used to refer to many different aspects in customer service.
The dimension of "service level" that is the most relevant to inventory modeling is availability of product (e.g. Did we have exactly what the customer wanted when the customer wanted it?). How much product that is available in safety stock inventory directly impacts a company's ability to fulfill customer demand (i.e. the service level).
From an academic standpoint, the level of safety stock will affect a company's probability of meeting demand during the replenishment lead time. Figure 2.1 .illustrates this.
The next step is to relate the ideas of product availability and service level to H.C.Starck's business.
robability of
meeting demand during lead time
Probability of a stockout toku an=O +3a I -ftdfLT +
a
d where, A = average demandALT= lead time
Ud = standard deviation of
demand over lead time Z= number of standard deviations for desired service level
Z*
a
d =SS
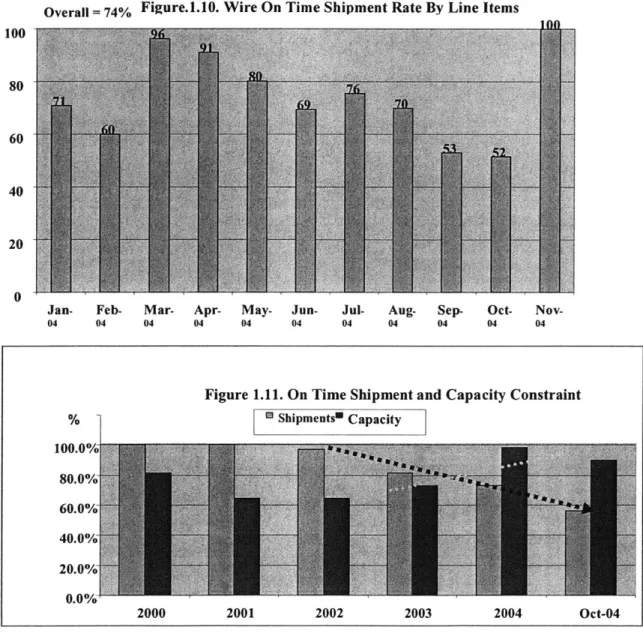
- safety stockOne of the customer-focused metrics that H.C.Starck, including WMTD, monitor regularly is
one that relates to delivery performance "% On Time Shipments":
Overall=
74% Figure.1.10. Wire On Time Shipment Rate By Line Items 100~60
40
20
0
Jan- Feb- Mar- Apr- May- Jun- Jul- Aug- Sep.- Oct-
Nov-04 04 04 04 04 04 04 04 04 04 04
-3,u
Figure 1.9.Academic definition of "service level"
Figure 1.11. On Time Shipment and Capacity Constraint
% I Shipments" Capacity 100.0%_ 80.0%0 60.0%0 40.0% 0. 0% 2000 2001 2002 2003 2004 Oct-04
On Time Shipments (OTS,%) measures the percentage of total shipments where finished goods have left the production floor on the estimated date needed to give the transportation provider enough time to meet the requested delivery date (e.g. the best possible delivery date that H.C.Starck could have achieved given current logistics and manufacturing design). H.C.Starck tracks the indicator by product line items monthly and publishes it to a large
email distribution list that includes staff as well as executives within H.C.Starck. Figure 2.1 is a sample of the monthly OTS report.
I
{
Cut Reues HCSTMaterial Description Batch Sales Billing Date PromisDate Weight Value Customer Order ocument vs Billing Date vs Billing Date
Material Group Z60785 NRC®TPX .01083"/.275mmDia Ta Wire Anneal TPX144B 33961 7039310 18 -3 33.00 $ 2 NRC®TPX .01083"/.275mmDia Ta Wire Anneal TPX131J 33961 7039310 18 -3 14.64 $ 2 NRC®TPX .0075"/.19mmDiaTa Wire Half-Hard TPX144C 33963 7039312 -3 -3 365.77 $ 3 NRC TPX.0059"/.15MM Ta Wire Hard-Samsung TPX142F 34832 7039313 -3 -3 38.05 $ 4
Df 77 shipments, 76 were ontime and I were late for a rate of 99% using the Customer Requested Date and the 0 day tolerance. Df 77 shipments, 77 were ontime and 0 were late for a rate of 100% using the HCST Promise Date and the 0 day tolerance.
f $ sold, $ was ontime and $ was late for a rate of 89% using the Customer Requested Date and the 0 day tolerance.
Df $ sold, $ was ontime and $0.00 was late for a rate of 100% using the HCST Promise Date and the 0 day tolerance.
Of the 10146.44 pounds sold by weight, 8998.913 were ontime and 1147.525 were late for a rate of 89% using the Customer Requested Date
and the 0 day tolerance.
Of the 10146.44 pounds sold by weight, 10146.44 were ontime and 0 were late for a rate of 100% using the HCST Promise Date and the 0 day
tolerance.
Figure 2.1 Sample of the H.C.Starck monthly OTS report
Since performance bonuses for sales and production executives are tied to these metric, executives are held accountable and incentivized to monitor how well some or other H.C.Starck department has performed to these metrics.
At H.C.Starck, customers place requests for product directly either through the phone, fax or face-to-face with a sales representative. These requests are supported (turning into purchase orders) or not supported (sale is potentially lost). Each product request has a quantity (e.g. the number of pounds) and desired timing (e.g. the desired delivery date).
Based on this reasoning, the definition for service level determined to be most appropriate for H.C.Starck's current business is:
Service level = % of demand requested by customers with requested date and requested
quantity satisfied
This definition of service level is what many companies equate to "fill rate" (e.g. percent of demand that is filled). Fill rate is a concept that is often more familiar and specific to supply chain and logistics professionals. We will use "fill rate" and "service level" interchangeably from this point forward, and apply it to this analysis.
Once this base definition has been determined, the next step is to translate this service level definition into concrete and measurable terms that relate and fit best with H.C.Starck's wire business. After research of literature, Internet and informal interviews with supply chain professionals, the service level measurement can be presented in couple ways (see table below) (Chow, 2004) Each of these methods has its merits and potential flaws. A company should select the one method which will provide the richest information that can drive action and can impact the bottom line the most. For H.C.Starck, market share and volume are
extremely significant so method 1 "by total % of units fulfilled" would be most appropriate. The delivery fulfillment performance metrics that the company has in place today as
described above can be varied in dependence of a goal and functions.
For example, the OTS delivery performance metric used today by WMTD focuses on "internal" performance. This key performance indicator answers how well WMTD is performing in getting goods out the door in time to be delivered by transportation companies to customers, but it does not provide any visibility into whether the customer actually received their goods by their requested and promised dates. Whereas sales department captures data on when customers actually receive their goods and whether the quantity is what was requested. The Sales Department has a commitment for a 24 hours response for every customer and corresponding indicators that allow controlling a customer response By keeping multilayer delivery fulfillment performance metrics the company is able to meet its shipping date for an order and get the goods out of the production facility to give haulers adequate lead time.
Methods to Places Advantages Disadvantages Measuring importance on
Service Level
1.
by total % as many units -incentivizes employees to - may bias towards fulfillingof units of demand as give priority to largest large custofirst and putting fulfilled* possible are orders (and largest smaller customers second
-fulfilled customers) potential for fulfilling few very large voluorders and ignoring mansmall volume orders
2. by total % as many order -theoretically gives all line - missing an order line item of order line line items as items (no matter what size of
100K
units is worse than items possible are of customer) equal weight - missing an order line item of fulfilled* fulfilled treats every line item and 10 units- may incentive every custimportant - data employees to fulfillmay be more easiaccessible smallest/easier orders first scompanies track delivery and put large orders
by order
line
item /customers second3. By total % as many time - encourages 100% demand -if 100% demand fulfillment of time periods as fulfillment every time is missed within a time periods possible have period period, employees not where 100% 100% incentivized to care whether it of demand fulfillment is 95% or 50% fulfillmen
To H.C.Starck, missing 10 units or 100 units is a huge difference, which is why method 2 "by total % of order line items fulfilled" would not be ideal. For another company where customer service is the main differentiator and it matters that every order, whether large or small, is fulfilled with the same importance, method 2 may be more appropriate. Method 3 is the most appropriate in companies where tracking the total of all time periods in which there was 100% demand fulfillment is more important than tracking units or order line items.
I came into conclusion that the most suitable service level measurement for our case is to
calculate a total percentage of units fulfilled. For H.C.Starck, market share and volume are extremely significant so method "by total % of units fulfilled" ("fulfilled" here refers to fulfilling both quantity requested and date requested) would be the most appropriate.
Thus, for H.C.Starck's wire business:
Service level = % of all units requested by customers with requested date and requested
quantity satisfied
As it was discussed earlier (section 3.1) H.C.Stark current system of Key Performance Indicators includes "On Time Shipment" indicator.
On Time Shipment = % of wire (ibs) requested by customers with requested date and
requested quantity satisfied
The definition of H.C.Starck's service level metric coincides with the definition of service level indicator for "total % of units fulfilled".
-'I--- Ii~ -
--3.2. Understanding Demand and Supply Parameters Which Affect
Customer Service Level and Inventory
3.2.1. Demand Variability
A critical element in determining a proper inventory policy for a particular item or set of
items is an analysis of past demand (or usage). For semi-finished wire one must ask how the usage changes with time or with other factors. Time patterns in the usage (e.g. once every two weeks) and the amount and type of variation of usage are also important. If the usage patterns are repeating in time, then a fixed ordering pattern may be used. Additionally, if the variation of usage fits an existing statistical model (e.g. a normal distribution), then the determination of a proper inventory policy may be greatly simplified.
We begin by analyzing the available data relating to the finished wire usage. First, we select the items we want to analyze. Then, we perform trend analysis for each item to see whether there is an increasing or decreasing usage trend with time or whether the usage exhibits regular or distinct patterns.
Having analyzed historical sales volume and value over the last three years we noticed that out of 31 different customers 9 represented 90-94% of the volume (lbs) sales and 84-86% of value ($) sales. In order to ease detailed monitoring and forecasting we decided to concentrate on those 9 primary customers.
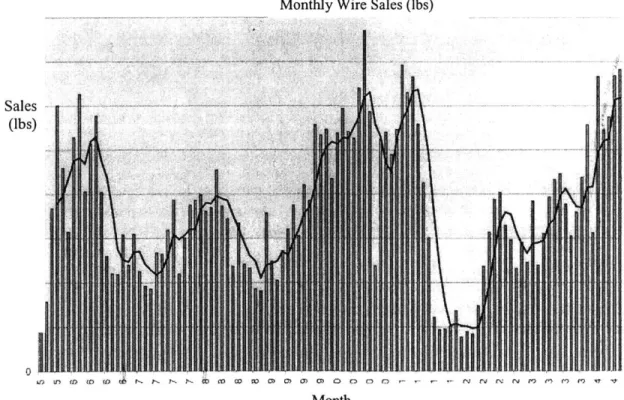
Monthly Wire Sales (lbs)
Sales (lbs)
n, iD CC) ( C6 . f P : C C O CC O D C C M 0) CD C .- Ci N C.1 N M C C C W
Month