HAL Id: hal-00955384
https://hal.archives-ouvertes.fr/hal-00955384
Submitted on 4 Mar 2014
HAL is a multi-disciplinary open access
archive for the deposit and dissemination of
sci-entific research documents, whether they are
pub-lished or not. The documents may come from
teaching and research institutions in France or
abroad, or from public or private research centers.
L’archive ouverte pluridisciplinaire HAL, est
destinée au dépôt et à la diffusion de documents
scientifiques de niveau recherche, publiés ou non,
émanant des établissements d’enseignement et de
recherche français ou étrangers, des laboratoires
publics ou privés.
Experimental evaluation of a naturally ventilated PV
double-skin building envelope in real operating
conditions
Léon Gaillard, Stéphanie Giroux-Julien, Christophe Ménézo, Hervé Pabiou
To cite this version:
Léon Gaillard, Stéphanie Giroux-Julien, Christophe Ménézo, Hervé Pabiou. Experimental evaluation
of a naturally ventilated PV double-skin building envelope in real operating conditions. Solar Energy,
Elsevier, 2014, 103, pp.223-241. �10.1016/j.solener.2014.02.018�. �hal-00955384�
Experimental evaluation of a naturally ventilated PV
double-skin building envelope in real operating conditions
Leon GAILLARD1*, Stéphanie GIROUX-JULIEN2, Christophe MENEZO1, Hervé PABIOU3
1
INSA-Lyon, CETHIL UMR 5008, INSA-EDF Chair "Habitats and Energy Innovations", 69621
Villeurbanne, France
2
University of Lyon 1, CETHIL UMR 5008, 69621, Villeurbanne, France
3CNRS, CETHIL UMR 5008, 69621, Villeurbanne, France
*
corresponding author: Leon GAILLARD
E-mail: leon.gaillard@insa-lyon.fr
Tel. +33472438813
Fax. +33472438811
Abstract
Building integrated photovoltaic systems are fast becoming a feature of urban landscapes in France and other countries tackling similar pressures to improve the energy footprint of residential and commercial building sectors. As active components of building envelopes, the technology represents a promising solution to the local electrical and thermal demand. However, despite significant recent interest and investment into the technology, few studies have been undertaken to study full-scale installations operating under real conditions.
In this paper we present an experimental evaluation of a prototype naturally-ventilated photovoltaic double-skin facade, designed to maintain favourable operating conditions for electrical performance by utilising the stack effect to cool photovoltaic components whilst improving the thermal performance of the building to which it is attached. Developed to meet both technical and aesthetic specifications, the prototype comprises a two-storey, vertically pleated, tinted glazed facade with a heterogeneous arrangement of photovoltaic cells electrically grouped into a vertical stack of three arrays. Installed on the west-north-west facade of an occupied office building in Toulouse, France, the component was tailored to the specific requirements of building into which it was incorporated. The result is a complex system in terms of geometry and environment. The objectives of the study were to test the assumption that the behaviour of simplified double-skin components can be generalised to real multifunction systems, and to propose analysis techniques suitable for this context. The prototype was instrumented to monitor the minute-wise thermal, electrical and air flow behaviour during the first year of operation. We present an analysis approach adapted to both the complexity of the system and the size of the dataset, wherein data were first classed according to daily indicators of environmental conditions using
visualisation techniques. As well as assessing the daily and seasonal variation in performance, the predictability of system was also tested as a function of environmental conditions by means of stationary empirical models for heat extraction and array temperature. Despite the inherent complexity and the limitations of approximate or incomplete instrumentation, the system was found to behave in a predictable manner and could be described by simple relationships between environmental conditions and system state.
Keywords: Building integrated photovoltaic system; Natural ventilation; Chimney effect; Monitoring
1. Introduction
France is undergoing an energy transition towards technologies with a lower environmental impact. Within the framework of international and European commitments, by 2020 renewable energy should account for 23% of total energy consumption in the country, and by 2025 reliance on nuclear energy should have fallen by 50%. To these ends, significant investments are being made into solar energy, which is seen as a promising solution for heat and electricity generation. The optimisation of this technology and its deployment is an ongoing subject of research. Indeed, the choice of configuration has been shown to depend on whether performance should be optimised for certain weather conditions or for different times of the year (Kelly et al. 2011). Two classes of photovoltaic installations are actively promoted: “photovoltaic energy systems”, comprising ground-based
facilities; and “photovoltaic systems for building integration” that include small to medium scale arrays mounted
on rooftops and facades. Since residential and commercial buildings account for a significant fraction of the total energy demand in France, building integrated photovoltaic systems (BIPV) are increasingly becoming a feature of urban environments in the early 21st century as a means to decrease the energy intensity of this sector. This deployment is also in line with the BEPOS (energy positive buildings) national objective.
Producing electricity whilst improving the thermal performance of buildings and limiting the thermal effect on the aging of PV components, BIPV systems are an example of locally available energy resources being used to partially accommodate local energy demand. In the context of net zero energy buildings (NZEB), the building envelope is a key element that must be active in terms of energy production and adaptive in terms of function according to season: acting as a thermal barrier, recovering heat or discharging it to the surroundings. From the perspective of energy generation in urban environments, facades represent a significant potential for solar energy, thanks to the large surface areas that could be available and a favourable orientation for production in winter (Redweik et al., 2013).
In this paper we explore the opportunity and also some of the possible issues regarding BIPV through the detailed study of one particular type of PV building envelope component: a double skin facade with solar photovoltaic elements integrated into a significant portion of the outer glazed surface and with openings at the top and bottom of the structure to allow natural ventilation by stack or wind effect. To date, relatively few studies are available in the literature for active PV/T double-skins with a winter function (Mechanical Extract Ventilation, air pre-heating, coupling to a heat pump) as well as a summer function (natural cooling of the PV wall, cross-ventilation). For the summer configuration, the optimization of the stack effect and heat transfer by natural convection is mainly sought to maintain the nominal efficiency of PV cells, which depends on the temperature (-0.45%/°C for typical crystalline silicon cells). For a winter operating configuration, the system may be used for heat recovery as well as electricity production.
In 2001, Bazilian et al. compiled a review on photovoltaic/thermal (PV/T) hybrid systems, in which various methods of building integration are ranked as well as their persistent physical, technological and economic requirements (Bazilian et al., 2001). For building facade integration the authors point out the difficulties related to the optimization of heat disposal or recovery according to the season, the adequacy of the system performance and the comfort of occupants. They also stressed the importance of architectural integration on facades for occupied buildings. The overall performance of such systems derives from multiple parameters, including climate and site features, the orientation and inclination of the roof/facade, PV module properties (opaque crystalline, semi-transparent) and their geometrical arrangement, the nature of heat transfer mechanisms (natural, mixed or forced convection). Currently, most of the models developed evaluate in a simplistic manner the performance of these BIPV components through a global energy or enthalpy balance between the inlet and the outlet of the device. Generally, they are dedicated to one particular operating mode corresponding to the main seasons, winter or summer. The potential improvement in building energy performance offered by PV double-skin facades was investigated by Young Yun et al. in 2007. In this numerical work the overall energy performance of PV double-skin facades was studied for different ventilation strategies, and for various design choices, including the proportion of glazed surfaces (Young Yun et al. 2007). The authors highlight the opportunity of varying use according to season, the overall benefit for PV components being cooled throughout the year, and the importance of taking wind effect into account for a given site. The impact of wind and the overall air-flow performance was explored comprehensively for conventional double-skin facades by Gratia and De Herde in 2007 and in previous studies by the same authors. The sensitivity of stack induced flows to external
strongly dependent on wind direction during the day. At night the behaviour of the air cavity was shown to be more reliable, as a result of lower outdoor temperatures and the thermal mass of the building (Gratia and De Herde, 2007).
Considering numerical approaches, for natural ventilation configurations we can cite the well-known model of (Brinkworth et al., 1999). In their paper, the authors predict the mass flow rate and the temperature evolution in laminar regimes within the chimney like configuration through the resolution of a cubic equation. This equation depends on several parameters that are difficult to evaluate: the stratification parameter, the pressure coefficients due to wind effect, and the regular and singular pressure losses coefficients. Sandberg and Moshfegh developed a similar model associated with an air gap behind PV panels (Sandberg and Moshfegh, 2002). This model was adapted for laminar and turbulent flow and an experimental study was carried out to test predictions of the mass flow rate. Considering the heat recovery, the classical model of Hottel-Whillier-Bliss dedicated initially to solar air collectors and also based on a global energy balanced remains a reference. In 2003, Mei et al. have considered the transient character of such systems and have developed a dynamical model of a PV double-skin facade and air collectors coupled to a single-zone building (Mei et al., 2003). They introduce a simplified control strategy (such as on/off) on the heating/cooling of the building. This strategy is based on maintaining the internal comfort temperature according to season and occupation or vacancy of the building. They show in particular that the heat recovered in winter in the double skin can reduce by 12% the heating energy consumption. Finally, after simulations for Stuttgart and Loughborough latitudes, the authors emphasize the extreme sensitivity of the performance of these systems and models to climate.
Despite the essential information they provide, numerical approaches and laboratory studies cannot demonstrate the full range of behaviour a real system is likely to exhibit, and full-scale field studies are needed to validate the expectations developed from studies under controlled conditions. To date, few data are available for the monitoring of real scale prototypes. One reference study concerns the mechanically-ventilated PV facade of the Mataro library near Barcelona, a study that was used by (Mei et al., 2003) to validate their dynamical model. As part of the thermal performance evaluation of this building, Infield et al. developed an expression depending on the loss coefficients of the building, the solar radiation gain and coefficients to characterise forced convection (Infield et al., 2004). For an air velocity fixed at 0.3 m/s, thermal energy recovery attained 70 kWh/m2 in winter and about 170 kWh/m2 in summer, a production that in this case was used for cooling via an adsorption machine. Athienitis et al. present a contemporary study, comprising the monitoring of an aspirated double-facade system in Montréal, composed of horizontal bands (9 cm width) of PV components attached to a perforated surface
(affording a porosity of ~0.6%) (Athienitis et al., 2011). These PV components alone were characterized in real conditions without integration to a building. Two prototypes which differ only by the PV bandwidth, 2 and 6 rows of PV modules respectively, were studied. Athienitis et al. showed that the heat recovery is greater on the two PV rows prototype (33% maximum). This result is coherent with the one obtained by (Giroux-Julien et al., 2009) on a reduced-scale device in fully controlled conditions: an enhancement in heat transfer is observed when the number of alternating heated/non-heated zones is increased. In 2013, Peng et al. have presented an experimental investigation into a prototype PV facade operating in Hong Kong, comprising a semitransparent amorphous silicon solar cell attached to a glazed surface in front of an air cavity (Peng et al., 2013). The prototype was constructed such that comparative assessments could be made of the system performance under different ventilation regimes simultaneously. The authors showed that these kinds of systems offer reduced solar heat gains in summer and less heat loss in winter, and that the performance for each function depended strongly on the type of ventilation.
This paper addresses the general challenges of a developing technology as it is implemented in the realistic context of an architectural element that serves both functional and aesthetic purposes. The building envelope becomes increasingly complex as it incorporates design features such as variable semi-transparency (related to PV cells density), novel geometry, colour, etc. In order to meet the energy needs of the attached building, the behaviour of the system must be essentially predictable and stable, despite its inherent sensitivity to external excitations such as the wind. These qualities are evaluated experimentally, via the analysis of a full-scale prototype system that was fitted to an occupied office building in southern France. As a prototype, the system was not energetically coupled to the building. Even so, the experimental evaluation of this component will help to provide new information on the likely performance of realistic PV double facades and help improve future models developed from those previously cited studies. Despite the coupling between non-linear phenomena, this paper assesses the ability to characterise a real and complex system using simple analytical techniques for a dataset spanning one year. The data allowed the thermal and electrical behaviour of the system to be analysed for a range of environmental conditions.
The remainder of this paper is structured as follows. The experimental setup, data acquisition and processing are described in section 2, and the analytical approach is presented in section 3. System behaviour is presented first in detail for typical sunny summer and winter days in section 4.1, and over a complete year in section 4.2 to illustrate the seasonal variation in electrical and thermal performance. A preliminary study of wind effect on the
then performed in section 4.4 and steady-state behaviour models for heat recovery and PV temperature are proposed. An overall evaluation of the prototype’s performance and its predictability is discussed in section 5.
2. Experimental setup
2.1. General description of prototype and site
Supported by the French Environment and Energy Management Agency (ADEME), the project RESSOURCES formed a consortium of research laboratories, architects, and photovoltaic and building component manufacturers. The aim of the research project is to redefine the building envelope (for new and existing buildings) in order to make it an active building component (in terms of power generation) that is scalable and that can be seasonally adaptive to meet varying needs over the course of a year. Of the different scenarios that can be considered, building renovation was chosen as it is the most restrictive case and the one that poses the greatest challenge in terms of energy performance. A series of 5 prototype photovoltaic double-skin systems were designed to cover a broad range of configurations that respond to different design criteria. The monitoring and evaluation of the first of these is the subject of this article. The prototype reflects the necessary compromise sought between the visions of each actor, and in this respect represents a realistic configuration likely to result from typical building renovation projects. From a purely energetic perspective, the prototype is not an optimal solution, but rather one that is adapted to the requirements of a particular renovation scenario. Indeed the design demonstrates technical innovations that have arisen from this challenge, and allows certain possible technical constraints to be investigated.
The prototype active double skin facade was installed on an existing occupied tertiary building situated in Toulouse, France. The system is a multifunction component of the building envelope, designed to improve the electrical and thermal performance of the building whilst also providing shade for occupants (visual comfort) and achieving specific aesthetic requirements. Set to a “summer cooling” configuration, from an energetic perspective its main purpose was to cool the PV arrays whilst removing the heat via the cavity. A photograph of the complete system is provided in the left frame of Fig. 1 accompanied by a schematic side view of the system. The glazed primary wall visible in the photo is identical to the section behind the prototype.
As shown by the diagram in Fig. 1, the double skin was installed on a West-North-West wall. The facade is in direct sunlight during the afternoon and early evening. In order to improve the orientation for photovoltaic elements, the prototype comprises a series of adjacent prism columns constructed from metal and tinted glass,
and with PV modules installed on west-facing surfaces. The PV modules constituted a stack three horizontal
arrays, or “blocs”, each connected to a fixed resistive load. The double-facade is 7.40 m tall and 4 m wide, and
positioned to give an air gap of 60 cm to 80 cm, with openings to the exterior at the upper and lower ends of the structure. Natural ventilation driven by the stack effect is expected to cool PV components. Regarding the thermal performance of the building, the double skin reduces the incident solar flux on the building and may be utilised to help drive ventilation inside the building.
The prismatic configuration was chosen to compensate for facade azimuth and improve electrical performance by a more favourable orientation of solar cells. For times when direct solar radiation meets the facade at a glancing angle, overshadowing by adjacent columns may however counteract the electrical performance gains due to orientation at certain times of day depending on the position of the sun. In effect, overshadowing by adjacent prisms only impacts periods where a planar facade would also have a low electrical performance due to high reflection losses (Assoa, 2008). For the case in study, if the solar azimuth is less (more southerly) than the bearing given by the glazed faces, a shadow will be cast on the PV faces. As shown in Fig. 1, the orientation of the glazed surfaces is at 32.4° relative to the facade, corresponding to a bearing of 230.4° (288-90+32.4) for a line parallel to these faces. For Toulouse, the time at which the solar azimuth traverses this bearing ranges from 13:30 in June and 15:30 in December. Before these times, the electrical output of the PV arrays should be greatly reduced due to optical mismatch resulting from partial shade. The prototype allows this time-dependent effect to be studied and reported so that it may be considered in real renovation projects facing similar requirements.
The test site also provides the opportunity to investigate the phenomenon of shadowing by neighbouring structures: the site is an industrial estate, with two and three storey buildings and trees in the vicinity of the prototype. In front (West-North-West) of the prototype is a 60 m wide car park. Considering structures beyond the car park, in summer the prototype should be clear of shadows except in the early evening (local sunset is at 21:00). The angle from the roof of the building on the opposite side of the car park to the base of the prototype corresponds approximately to the position of the sun at 18:00 in summer. In winter months, the effect of local shade may be visible at specific times in the afternoon. Indeed, since these shadows are cast by fixed obstacles, they should be distinguishable from random variations in sunlight (cloud conditions) by their recurrence at similar times of day for consecutive periods. By this means, the impact of local shade can be analysed in terms of the electrical and thermal performance of the facade.
The geometrical complexity of the prototype and its surroundings are interesting as they represent a realistic example of photovoltaic double-skin facades deployed in urban areas. Photovoltaic systems are inherently sensitive to shadowing, either caused by neighbouring structures or the component itself. It is thus an important issue to be considered during the design process of facade-integrated PV systems. In real renovation projects, energy efficiency interests may be compromised by existing structural features and aesthetic goals. In the context of urban redevelopment objectives it is therefore important to demonstrate whether such systems can make an effective contribution building electrical and thermal performance. The complexity also represents a significant experimental challenge, and robust analysis techniques must be developed for this scenario, for performance evaluations and later for building management systems.
Fig. 1. Prototype pleated PV double facade installed in Toulouse, France. Left: the complete system. Centre: zoom of repeated prism
2.2. Instrumentation
The apparatus was equipped with instrumentation to meet the general objective of monitoring the electrical, aerodynamic and thermal behaviour of the prototype as a function of environmental conditions, continuously for a period of one year. The double facade was instrumented along the central prism column of the prototype using 1mm diameter K-type thermocouples, protected from radiation by aluminized pellets, and bidirectional anemometers, affording measurements of the vertical air velocity component within the range [0,2] m/s. Voltage readings across the reference resistances of each PV array provided a measure of electrical performance.
Fig. 2. Instrumentation of the HBS photovoltaic pleated double skin facade. Upper left: front view indicating arrangement of ‘bloc’. Lower
left and right: top view showing instrumentation of central prismatic column.
Thin tube frame assemblies, hereafter referred to as “peignes” (combs), were hung from the metal structure,
allowing velocity and temperature probes to be added in the air gap along axes perpendicular to the facade at three vertical locations: 1.4 m, 3.75 m, and 6.0 m from the top of the facade, as shown in the left diagram of Fig. 2. The horizontal arrangement of sensors at each location is illustrated in the right diagram of Fig. 2. Thermocouples were attached to the anemometers. A further 16 thermocouples are located on each side of the double-skin: 10 thermocouples attached to the PV surface in the middle of modules, and 6 on glass surfaces, and 10 thermocouples were attached to the primary building facade at the same vertical positions as the PV thermocouples.
A suite of meteorological sensors was installed on the roof of the building, including a mast-mounted weather station (temperature, pressure, humidity, and wind conditions), one sun-tracking pyrheliometer, and one pyranometer to measure horizontal global radiation. These were complemented by two more pyranometers fitted on the upper and lower sections of the double facade in the plane of the PV modules.
2.3. Data acquisition and processing
The above suite of instruments were connected to a Keithley 3706 datalogger (equipped with two 60-channel cards) and two Almemo dataloggers that were used to record and calibrate the bidirectional anemometers. These devices were governed by a data acquisition programme developed in Labview, comprising a single loop of data requests, and including safeguards to avoid the misinterpretation of corrupt data. The acquisition loop was stable at the desired time-step of 2 minutes. Raw data were stored in separate files per bloc and weather station, with new files generated at intervals of 10MB.
The system was managed and monitored remotely with the aid of a virtual network connection (VNC). Raw data files were transferred by FTP to a local machine in Lyon, where they were cleaned and imported into a MySQL database. Prior to analysis, data were synchronised by the creation of a static synchronised concatenated data table in the database.
The open source software package Scilab was used to interface with the database and analyse the results (Scilab 2012). This approach offered the dual advantages of using a MySQL server for filtered data requests, and handling vectors and matrices using the Scilab kernel. Scilab additionally provided the graphic output of results.
On average, data recovery exceeded 95% per day. Data loss was mostly accounted for by communication problems between the weather station and the data acquisition cards. During the monitoring period only one event required direct on-site intervention: an area-wide power cut that severed the internet connection and thus required a manual reboot.
The methodology and technology implemented for the current study was thus found to be appropriate for the monitoring of full scale double skin facades over a period of one year, and with data rates of order 10² channels sampled with a time step ~1 minute. In principle, the inbuilt multithreading of Labview would permit higher sampling rates, but may result in a higher occurrence of communication errors with peripheral devices such as the weather station used in this project. Larger systems may also benefit from integrating database updates into the data acquisition system.
2.4. Derived measures
Spatial averages of air temperature and speed were calculated to obtain mean values per bloc. The weighted average of individual readings was used, with a weighting derived from the effective cross-sectional area of the cavity attributed to each sensor. Such a weighting was chosen to minimise errors resulting from a steep horizontal profile. The vertical mean air temperature was estimated from the average temperatures per bloc and the ambient (inlet) air temperature by interpolating between each value and calculating a centroid of the resulting distribution.
Heat recovery by the air cavity was calculated as the product of measured mass flow rate, specific heat capacity and measured air temperature difference between bloc 1 and the inlet. Mass flow rate was derived from the spatial average air velocity and the local air density, approximated from a standard equation for humid air, using atmospheric conditions measured by the weather station and the spatial average air temperatures.
As illustrated by the coloured arrows in Fig. 1, the PV facade may not be the only nor dominant source of heat to the cavity. In particular, the building may make a significant contribution. If so, any simple relationship between the measured recovered heat and incident solar radiation may be masked by uncorrelated heat fluxes. In order to evaluate the apparent contributions of these two sources, a simple energy balance equation is adopted following the approach presented by (Zöllner et al., 2002). As for the case of a box window in that study, here the heat recovery of the double skin facade is assumed entirely accounted for by exchanges with the PV facade and the building primary skin, defined in terms of a global heat transfer coefficient and surface-air temperature differences. Equating the heat fluxes with the net enthalpy change of the cavity (recovered heat), Equ. (1) is obtained
(1)
where Tair is the temperature difference between inlet and outlet, subscripts e, f and b denote the outer facade, cavity air, and building wall respectively, h is a convective heat transfer coefficient and A the surface over which heat is transferred. Note that direct coupling to incident radiation (semi-transparency of PV facade), and wind effects are neglected, as is any mass transfer with the building interior. Further approximating he=hb, and Ae=Ab yields
e f
b b
b f
e e air pT
h
A
T
T
h
A
T
T
C
m
(2)
Hence the heat flux from each surface is given by a simple relation involving air and surface temperatures. In the study by (Zöllner et al., 2002), the global heat transfer coefficient was then used to estimate the mean Nusselt number of the box window. Here it will only be used to estimate the relatively contributions of each heat source.
3. Analysis methods
An important question regarding the future development of PV-integrated double skin facades is whether a simple description of typical behaviour during one day or over different seasons can be obtained despite varying and approximately defined environmental conditions, and an incomplete set of physical properties for the system components. Although electrical output, PV module cooling and heat recovery are the principle measures of performance for the double skin facade, the present study was thus directed more specifically to identifying the range of conditions under which the prototype performed well.
The analysis proceeded by first considering the daily and seasonal variations in system behaviour. Recall that the configuration of the double skin facade unchanged throughout the monitoring period, with both upper and lower inlets open to the exterior. Following the study of system evolution as a function of time, relationships between environmental conditions and performance measures sampled every 120 seconds were investigated with the aid of simple behaviour models. Comparisons of linear regression fits to data served to demonstrate the predictability of the double skin facade, and provide an indication of features that should be incorporated into more thorough simulations, such as the need to thermal capacity or response lags.
3.1. Visualisation of daily cycle and seasonal variation
Two techniques were implemented to characterise system evolution as a function of time: comparison of typical days, and carpet plot visualisations of the dataset. Typical days were retrieved from the database via metadata indicating daily environmental conditions and system performance. Examples of such measures include the cumulated incident solar energy, and the mean wind speed in the direction perpendicular the facade. These indicators were generated by aggregated database queries, and then combined to classify days as ‘sunny’, ‘windy
and sunny’, and so on. Qualitatively similar days were then retrieved by filtering the database using the daily
indicators. By the same means, rare events could also be found, although that was outside the scope of the
e b f
air p f b f e air pT
2
T
T
A
T
C
m
h
T
T
T
T
hA
T
C
m
present study. Carpet plot visualisations of data on axes of date and time of day provided complementary information on both daily and seasonal trends and additionally enabled to resolve features common to consecutive days. For recent examples of this visualisation technique applied to building performance data, see (Rafferty et al., 2011) and (Colmenar-Santos et al., 2012).
Overall thermal performance of the prototype was evaluated by the instantaneous thermal efficiency of the double skin facade, defined as the ratio of heat recovery to the total incident solar radiation.
, (3)
where Qg is the recovered heat, Gi the incident solar flux, and A the effective surface of the external facade. The thermal efficiency has been used in the evaluation of various solar energy technologies, for example it was introduced by (Ong and Chow 2003) to evaluate the performance of a solar chimney. For the present study, th describes the ability of the cavity to remove heat from the PV array. Note that the measured heat recovery includes the heat flux from the building as well as the PV facade, and thus thermal efficiency may be modulated by this unknown source. It was therefore appropriate to consider the statistical distribution for different seasons and classes of day, rather than instantaneous values.
3.2. Parametric analysis of input-output relationships
Periodic or regular variations in the system state imply causal or coincidental relationships between system state and environmental conditions. In order to expose such correlations and to determine whether a consistent functional description respected over a reasonable period of time, parametric behaviour models of heat recovery and PV module temperature were developed and solved for certain classes of days.
As a precursor, performance measures for each bloc are displayed as a function of incident radiation. The distributions serve to illustrate the simple relationships that may exist. If data exhibit dispersed distributions or several correlation features superposed over the same range, system behaviour may depend strongly upon another independent variable, or transient effects may be important.
Behaviour models for heat recovery were based on a consideration of energy balance and observed correlation features. Temperature models were developed purely from correlation features. For each model, parameter
i g th
G
A
Q
identification was performed by constructing a design matrix and calculating the linear regression solution by the standard equation in matrix form
, (4)
where y is the vector of measured response variable for a set of data points, the vector of common correlation coefficients for the least square solution, and X the design matrix. The latter is composed of columns for each input variable and rows for each data point. The method is equivalent to solving a set of simultaneous polynomial equations where each equation corresponds to a single data point (up to 720 per day for the present dataset). Residual model-data errors and variance were used to compare solutions. The long term validity of the best models was tested by fitting to summer days and extrapolating the solution to data spanning one year. For the temperature model, sensitivity to wind was also considered by solving the model for various classes of wind conditions.
Rather than searching for an optimal model to predict the response of the prototype, the objective was to assess the general validity of such an approach, whilst testing the hypothesis that a stationary linear model is appropriate for the case in study. If proven robust, the method offers a first order prediction of system performance without a detailed knowledge of the physical properties of each component, nor the specific geometric of the structure.
4. Results
4.1. Presentation of typical sunny days
In Fig. 3, the behaviour of the double skin facade is shown during typical sunny days. The left column of graphs corresponds to one day in summer, and the right column to one day in winter. Fig. 3a) and 3f) provide a summary of incident solar radiation measurements during these typical days: in-plane (bloc) and total horizontal radiation measurements made by pyranometers, and the direct component of collimated radiation measured by the sun-tracking pyrheliometer installed on the building roof. In summer peak incident radiation on the PV facade occurs around 17:00 for sunny days, and exceeds total horizontal radiation during the late afternoon. Overall, the data are characterised by an electrical and thermal response that is limited to the afternoon, as a result of the orientation of the building.
X
X
X
y
ˆ
T 1 TThe daily cycle in electrical performance during summer is summarised in Fig. 3b). Electric power output is limited by the period of significant incident radiation, from 14:00 to 20:00 for the selected day. However, its variation is a non-linear function of measured incident radiation. This is shown by the power outputs of blocs 1 and 2, which approximately saturate for up to 3 hours. Such a trend is due to use of constant resistive loads for each PV array. Intermittent drops in power are also visible that are uncorrelated to pyranometer measurements. Bloc 3 is the most affected. These losses suggest the presence of local horizon features that have not obscured the pyranometer; this hypothesis shall be further tested in the following section. Otherwise, the peak power output of bloc 3 during the summer is anomalously high relative to the other blocs, despite receiving the less incident radiation than the upper arrays. The rated power of blocs 1 and 3, and the resistive loads are identical. In order to account for the discrepancy, it may be necessary to evoke secondary radiation sources or faulty PV cells in bloc1.
The effect of overshadowing caused by adjacent prisms, as introduced in section 2.1, can be identified by comparing electrical output to incident radiation measured by pyranometers attached in the plane of the PV surfaces. Note that, since the pyranometers are located at the most southerly end of the component, they are free of overshadowing. For the typical day in summer, the onset of electricity generation when the facade is directly illuminated (from 13:30) is observed to lag measured radiation by a few minutes. As a result, the instantaneous performance ratio (defined as the conversion efficiency normalised by the rated efficiency) of all blocs is below 20% until 14:00 at which time it rises rapidly as expected from considerations of overshadowing.
Surface and air temperature trends are presented in Fig. 3c). As expected, during periods of strong incident radiation the highest temperatures are attained by the PV facade. Peak temperatures of the outer facade and the cavity air coincide with periods of maximum irradiance. A smooth evolution is observed for all trends: the intermittent drops in electrical power output have no corresponding feature in PV facade temperatures. Building wall temperatures are delayed by over an hour relative to these trends; the upper section of the building wall is also generally hotter than the ambient air during the night and early morning. Outlet air temperature appears correlated to the temperature difference between ambient air and the outer facade, and also the building wall. On sunny days in summer, the cavity air temperature reaches more than 10°C above ambient temperature.
In Fig. 3d), spatial weighted averages of the air speed measured within the cavity are shown superposed by the local wind speed measured by the rooftop weather station, and the wind speed component perpendicular to the
wind speeds. Both wind and air flow readings exhibited a high degree of fluctuations. Thus, a centred period-10 moving average was applied to filter short timescale variations from the data presented in the figure. Typical sunny days in summer exhibited significant cavity air speeds from 10:00 until 22:00. The corresponding Reynolds number during this period is of order ~104, suggesting air flow is turbulent.
Note wind speed tended to be strongest in the mid-afternoon for sunny days, which gives rise to an apparent dependence of air speed on wind. However, no clear correlation is observed between the magnitude of air and wind speed. Although fluctuations in wind and air speed also do not appear to be simply correlated, the degree of fluctuations in air speed was enhanced during windy days with a strong facing wind.
Differences between averaged air speed at each level in the cavity may indicate a degree of recirculation within the cavity, either in the space immediately behind the PV facade or by horizontal flow. Note also that only bloc 3 air speed reduces to zero during the night. Air speed profiles indicate that in the middle and upper sections of the cavity, air flow near to the building wall persists through the night, indicating heat transfer from the building to the cavity.
With both upper and lower inlets of the cavity open to the exterior, air flow could be disrupted or enhanced by the wind. The measured temperature differences and air flow rates provide information on the relative strength of the stack effect (natural convection) and wind effect (forced convection) in the cavity. (Zöllner et al., 2002) used the Archimedes number, defined as the ratio of Grashof to the square of the Reynolds number, to assess the performance of a box window with a controlled air inlet. In that study, a value superior to unity, indicating dominance of the stack effect, was observed throughout the period of significant heating. Adopting the same approach for the present analysis, but using a modified Grashof number scaled by the form factor of the cavity, Equ. (5) was used to assess the resilience of the stack effect in the pleated double skin facade
, (5)
where Te is the mean (centroid) temperature of the PV facade, Ta the ambient air temperature (assumed equal to the inlet temperature), the thermal expansion constant defined as the reciprocal of the mean (centroid) bulk air temperature inside the cavity, H is the cavity height, the kinematic viscosity of the fluid (assumed constant), Dh the hydraulic diameter of the cavity, g is the standard acceleration due to gravity, and U is the spatial mean air velocity. The form factor of the prototype, given by the ratio of Dh to H, was 0.153.
H
D
U
D
T
T
g
D
U
H
D
D
T
T
g
Re
Gr
Ar
2 h h a e 2 h h 2 3 h a e 2
The Archimedes number was calculated for a subset of sunny, windy days in summer, with mean wind speeds exceeding 4 m/s (or 2 m/s perpendicular to the facade). For all days in the subset, the Archimedes number varied in the interval [2,5] during periods of incident radiation. The stack effect is thus resistant to solicitations from the wind. Moreover, fluctuations in air flow that appear causally linked to wind conditions do not appear to significantly disrupt natural convection flow.
In Fig. 3e), the heat recovered by the cavity is shown together with the estimated contributions from the outer facade and the building. A maximum heat recovery of 7 kW was attained during sunny summer days. In the early afternoon, the stack effect is driven by the PV facade. Heat flux from the building to the cavity is significant in the late afternoon, and on some days dominated in the early evening. As a result, the total heat recovery by the cavity in the late afternoon is only weakly correlated to incident radiation.
Adjacent to the graphs for a typical sunny summer day, the same measures are shown for a typical sunny day in winter. In addition to the expected variation in direct and global horizontal sunlight, and ambient temperature, an important seasonal difference in incident solar radiation is also observed: the upper and lower pyranometers both appear to be partially shaded during the afternoon. Electrical production of the PV arrays is severely penalised by the reduced incident radiation; negligible power output is also observed during periods with non-zero pyranometer readings, suggesting the presence of additional shadowing features on the arrays. In winter the effect of overshadowing due to adjacent prisms (described above for summer days) is also more pronounced. As can be seen in Fig. 3g) the onset of significant electricity generation occurs after 15:00, whereas the pyranometers indicate incident radiation from 13:00.
Poor electrical production in winter results in little heating of the PV arrays. Conversely, the building wall temperature is more significant relative to ambient temperature and the cavity air. Indeed, night time heat flux from the building to the cavity is visibly enhanced in winter.
4.2. Visualisation of seasonal variations electrical and thermal performance
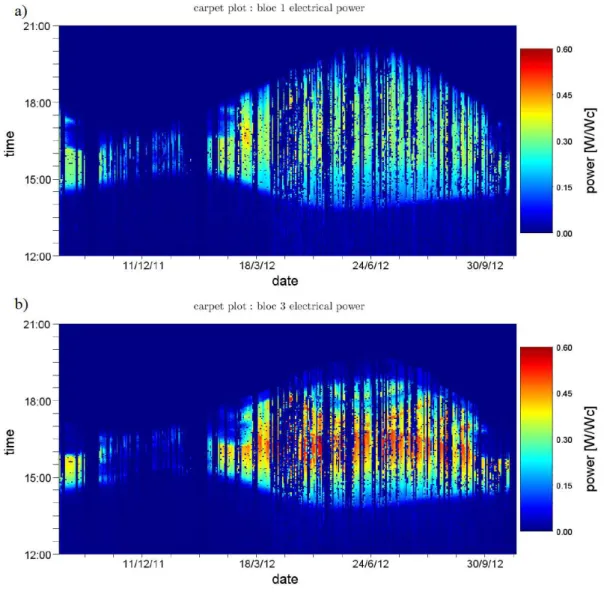
In (Colmenar-Santos et al., 2012) carpet plots of energy consumption were used to identify faults in building temperature control systems. In the present analysis, the same technique is used to identify seasonal trends in the data issues in energy generation. In particular such visualisations reveal losses that are correlated with time of day.
In Fig. 4 and 5, the annual variation of system performance is represented by carpet plots on axes of date and time. For each performance measure, a colour scale indicates the absolute value at a given instant. Note that the colour scales of Fig. 5 are set by the upper and lower limits of the data and thus differ between figures. Points corresponding to missing or erroneous data were assigned a value of zero.
Fig. 4. Carpet plot visualisations of seasonal variation in electrical performance of the double façade
The bitmap representations of results show that the variation from summer to winter performance is fairly smooth, and that the effective active period of the double facade is from March to September inclusive. Fig. 4a) and b) present the variation in electrical power generation during one year, normalised to the rated power of each array. An approximately sinusoidal variation in the envelope is clearly visible, as expected from the annual variation in incident sunlight. The duration of electrical power generation therefore increases to a maximum in
temperature and the observed saturation of power output observed for incident radiation exceeding 700W/m². Peak power during sunny days in late spring and early autumn tend to be higher than during summer. Similarly, intermittent high peaks in electrical power output occur during sunny periods of partially cloudy days, such as during mid-April.
Fig. 5. Carpet plot visualisations of seasonal variation in thermal performance of the double facade
Local horizon effects inferred by the study of typical days are clearly visible in the carpet plots. For both blocs 1 and 3, horizontal troughs are visible in the data. These correspond to fixed obstacles that partially shade the PV arrays. Such features are more apparent for bloc 3 than bloc 1, and all blocs are severely penalised during the winter. These observations are consistent with studies of Digital Elevation Models in Urban environments (Morello et al., 2009). For example, for bloc 3 from early May until early August, at 18:00 every day the
electrical power output is observed to drop significantly. The feature appears slightly later in May and August than in June, which can be accounted for by the variation in the position of the sun.
Array temperature difference to ambient air is displayed in 5a). In comparison to electrical power output, PV heating varies more gradually during the course of a single day. For instance, the intermittent maxima in electricity generation during partially cloudy days do not have an analogue in module temperatures.
Fig. 5b) presents cavity heat recovery. A moving average filter was applied to the heat recovery results, in order to suppress short term fluctuations. Overall, heat recovery appears to increase with cumulated electrical power generation, and a long active period and a short inactive period are clearly visible in the carpet plot. From March to September, the double facade may be able to contribute to the heating or ventilation requirements of the building during the late afternoon. During sunny days in this period, heat recovery is observed to exceed 5kW for a period ranging from 2–4 hours from spring or autumn to summer. In contrast, heat recovery during winter is essentially negligible. The same features that disrupt electrical production during this period are highly detrimental to the development of an air flow driven by the stack effect. Consequently, the overall thermal performance of the double facade may also be reduced in winter. This shall be estimated in the next section.
4.3. Thermal performance
Fig. 6 presents histograms of the instantaneous thermal efficiency during the afternoon for sunny days grouped according to season (using the equinoxes and solstices) and two classes of wind conditions. Sunny calm days were defined as having a cumulated incident solar energy exceeding 6 kW/m² and a mean wind speed with a magnitude less than 1m/s. For sunny windy days, the latter criterion was changed to select days with a mean wind speed greater than 1m/s. For both classes, the centroids of the histograms indicate that the thermal efficiency of the double facade in Spring-Summer is greater than in Autumn-Winter. For sunny calm days the mean thermal efficiency ranges from 16% in Autumn-Winter to 25% in Spring Summer, with similar standard deviations. Note that this seasonal difference may in part be due to local horizon effects discussed in the previous sections: pyranometers tend to overestimate incident radiation in winter. Considering the energy demand of the building, the double facade may therefore contribute to natural ventilation during hotter months and to heating at other times and in particular during Spring. The effect of the wind is to slightly improve thermal efficiency in Autumn and Winter. These observations are consistent with the emergence of a stronger stack effect in Spring and Summer, which is fairly resilient to perturbations from the wind.
Fig. 6. Histograms of instantaneous thermal efficiency for sunny days with different wind conditions. Left: calm, sunny days for 4 seasons.
Right: windy, sunny days for 4 four seasons.
The PV double skin facade can be compared to a solar chimney with a similar form factor, studied by (Ong and Chow, 2003). The efficiency of that component, which comprised a flat, transparent outer facade without PV elements, was reported to vary in the range [30.0%, 43.0%] for an incident solar radiation ranging from 200 to 800 W/m². The PV double facade thus has a lower thermal efficiency than a comparable simple glazed arrangement. Therefore, the current prototype cannot be justified purely in terms of heat recovery.
4.4. Parametric analysis of system behaviour
The clear daily cycle and seasonal variations suggest the existence of simple relationships between certain environmental conditions and performance, representing system inputs and outputs respectively. In the next sections, these are studied first via visualizations of outputs as a function of inputs, followed by empirical behaviour models that were based on the apparent correlations and physical assumptions.
4.4.1. Visualisation of input-output correlations
Electrical power, PV module heating, and air flow are shown as a function of incident radiation in Fig. 7. respectively. Electrical production for each PV array is dominated by a monotonic rise with incident radiation, with a S-shape consistent with the expected performance of PV arrays connected to constant resistive loads (Duffy and Beckman, 1991). The main distribution of bloc1 data appears distorted; such a trend can result from mismatch effects due to faulty PV cells. In addition to the main trend, all three blocs also feature a narrow
distribution of points at low power and radiation up to 500 W/m², corresponding exclusively of data from 12:00
– 15:00, plus a dispersed set of points below the main trend. Such features are consistent with local horizon
effects observed in the typical days and carpet plots presented in previous sections.
Fig. 7. Electrical production, array heating and air flow rate as a function of incident radiation, for each bloc.
As can be seen in the middle row of graphs in Fig. 7, the heating of bloc 3 is well described by a linear dependence on incident radiation. However, the temperature evolution of blocs 1 and 2 is characterised by two distinct distributions: two approximately linear trends are visible, describing two different temperatures for a given intensity of solar radiation. For example at 500 W/m², the temperature difference between bloc 1 modules and ambient air tends to either 12°C or 20°C. The two groups of data are distinguished by time of day, and correspond to periods before and after the daily peak radiation. During the latter, the heat flux from the building is more significant, and thus results in a different energy balance for some PV modules. The lower row of Fig. 7
incident radiation. A significant air flow is also observed for incident radiation below 200 W/m², which appears to be driven by the building heat flux.
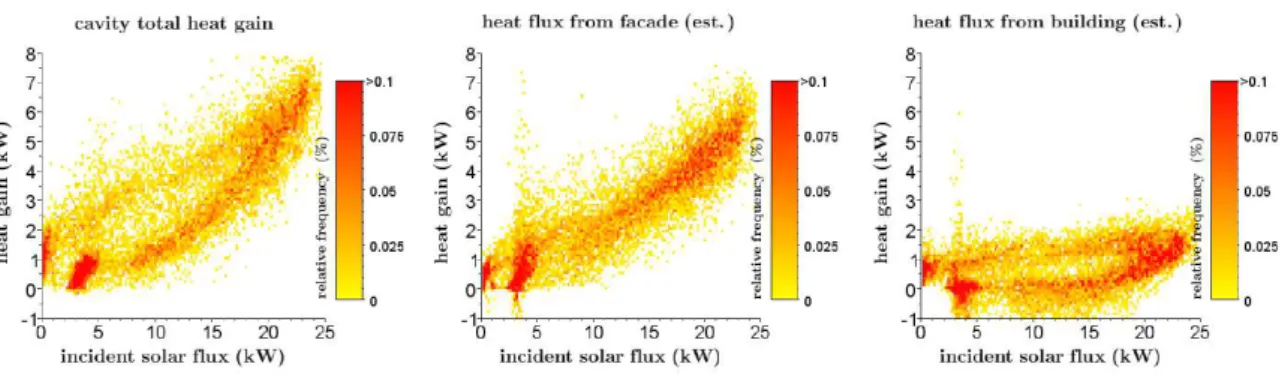
Fig. 8 presents the heat recovery and the estimated contributions from outer facade and building as a function radiation. A similar two-part distribution is observed, identified with the building heat flux. The upper and middle sections of PV facade are heated by the building during the early evening.
Fig. 8. Heat recovery of the cavity as a function of total incident radiation. Centre and right figures present estimate contributions from the
outer facade and the building, respectively
4.4.2. Stationary behaviour model for heat recovery
Equ. (6) describes the energy balance of the outer facade of the double skin structure, assuming negligible thermal mass. Similar approximations have previously been used in simulations of PV-T collectors, for example (Guiavarch et al., 2006; Chow, 2003). Some experimental studies have also implemented such models, such as (Guiot et al., 2012). The net heat recovered by the cavity air from all sources, Qg, is defined in terms of the independent variables ambient temperature Ta, facade temperature Te, building wall temperature Tb, incident radiation Gi, and the sky temperature Ts:
(6)
The plane projection of the outer surface was used for the effective area A. Model coefficients, shown enclosed by square braces, are related to the physical properties of the system: the absorption coefficient of the double skin, the photo-conversion efficiency of PV modules, hconv,ext the convective heat transfer coefficient to the exterior (coupling to the ambient air temperature), and hrad,ext & hrad,int describe radiative heat transfer from the double skin wall to the sky and to the building wall respectively. All were assumed constant to first order. Solutions were not improved by modulating external convection by measured wind speed, hence this dependence
i 4 b 4 e int , rad 4 a 4 s ext , rad e a ext , rad ext , conv gG
1
T
T
h
T
T
h
T
T
h
h
A
Q
was excluded from the model. External convective and radiative terms were grouped in order to reduce sensitivity to Ts, which was approximated from ambient temperature using the relation
(7)
where temperatures are in Kelvin, and the sky emissivity s is a function of relative humidity and the dew-point temperature. In terms of the general solution presented by Equ. (4),
(8)
Recall that elements of y and X are vectors representing time series data.
The parametric model for heat recovery was solved using a dataset of 10 sunny summer days with little wind. In the upper graph of Fig. 9, the solution is shown superposed over experimental data for a sequence of calm sunny days in June 2012. The fit was applied to daytime data from 12:00 to 21:00 for each day (during which a significant heat flux is observed). In general, the model faithfully reproduces the daily trend in heat recovery. However, the physical interpretation of the regression coefficients is not evident: for this model, the parametric dependence on incident solar radiation is found to be negligible. This result is due to the causal relationships or correlations of the other variables with radiation intensity. Since the model is stationary, short term fluctuations in the data are not predicted by the model. The inclusion of transient behaviour would require modifications to the model, such as the inclusion of autoregressive terms. Other anomalous features were found to correlate with electricity generation and not pyranometer readings. The uncertainties associated to local meteorological conditions are therefore an important source of error to such data-dependent models.
The solution for sunny days in summer was extrapolated to predict performance during similar days spanning one year. In the lower graph of Fig. 9, a comparison of measured and predicted daily cumulated heat recovery is presented together with the absolute error. For most days, the prediction is accurate to within 14%, and in general underestimates heat recovery. Absolute errors are not strongly correlated with the cumulated energy;
25 . 0 s a s
T
T
n i n 4 b 4 e n 4 a 4 s n e a i i i 4 b 4 e i 4 a 4 s i e a T int , rad ext , rad ext , rad ext , conv T n g i gG
T
T
T
T
)
T
T
(
G
T
T
T
T
)
T
T
(
X
1
h
h
)
h
h
(
,
A
Q
A
Q
y
hence relative errors tend to be more significant in winter. The model-data comparison shows that the double skin facade behaves in a consistent and predictable manner throughout the year for days with little wind.
Fig. 9. Linear parametric model for heat extraction as a function of measured environmental conditions and facade surface temperatures.
Top: regression fit to calm sunny days in June 2012. Bottom: extrapolation of solution to similar days spanning one year.
4.4.3. Stationary behaviour model for PV module heating
The model represented by Equ. (9) was found to provide a good description of PV module heating for the same set of sunny summer days that were considered for the heat recovery model. It was found necessary to include building wall temperature in the behaviour model in order to reproduce the daily cycle. More elaborate models including quadratic and interactions between variables (such as the product of radiation and temperature), and wind terms were all found not to improve the quality of the solution
(9)
Incident radiation is normalised to a reference value, Gref=800 W/m². The values of correlation coefficients and T0 are therefore given with units of temperature, whereas coefficients and are dimensionless.
Fig. 10. Linear parametric model for PV array temperature. Top: regression fit to calm days in June 2012. Bottom: regression fit to windy
days in June 2012.
Fig. 10 provides a visual comparison of the model to data for the bloc 1 PV array, for two sets of days in June 2012: sunny days with little wind, and sunny days with a mean wind speed exceeding 2 m/s. The solution predicts module heating to a mean accuracy of 5% of the measured temperature in °C. As for the heat recovery
0
1
T
2
T
T
0G
G
T
a b ref i e
electricity production and pyranometer readings. Occasional fluctuations in array temperature are observed, which result from intermittent cloud cover. The model reproduces this behaviour, but is out of phase with the data by a few minutes (as shown by the absolute errors).
When solved for sunny days with different wind conditions, the behaviour thermal model described the data to a similar precision. The correlation coefficient for incident radiation appears slightly weaker for windy days, suggesting a slight enhancement of PV cooling for some wind conditions.
The behaviour model presented above is analogous to PV temperature models that are based on measured Normal Operating Cell Temperatures (NOCT). Many correlations have been proposed during previous studies; for a recent review, see (Skoplaki and Palyvos, 2009). Comparing typical formulations of these models with Equ. (9), the normalised coefficient for incident radiation, 0, is equivalent to the difference between PV module temperature and ambient air temperature under NOCT conditions. Under such conditions, (typically GNOCT = 800 W/m2, Ta,NOCT = 20°C and wind speed V = 1m/s) the operating temperature of crystalline Silicon PV modules are typically reported within the interval 53±7°C (Fuentes, 1987). Installed NOCT temperatures are generally higher, but vary widely for different installations, for example, +18°C for direct integration or -3°C for rack mounting. Note that for the behaviour model applied to the prototype double facade, the impact of the installation is taken into account by including the building wall temperature as a variable.
Adopting the solution to Equ. (9) for sunny days with little wind, and allowing the building wall to lie in the range Tb=(30,40)°C (at Ta=20°C, the mean Tb=34°C for this data selection), the operating temperature of bloc1 under NOCT temperature and radiation conditions is 47.1±4.5 °C. The double skin facade is thus a significantly more effective configuration for module cooling than direct integration. Indeed, the observed NOCT is somewhat lower than conventional crystalline PV modules installed in an open field. The lower absorptivity of the double-glass PV modules may also partly account for the improved cooling relative to opaque modules (Notton et al., 2005).
5. Discussion
The objectives of the present study have been to assess the electrical and thermal performance of the prototype PV double skin facade, but also to ascertain whether the behaviour of such a system can be easily predicted from typically available data.
5.1. Performance evaluation
The system is characterised by an active season of at least 7 months, and a shorter inactive season in winter when both electrical and thermal output are reduced. Considering building energy requirements, the performance during spring and autumn is encouraging. Importantly, the seasonal variation appears strongly linked to the influence of local horizon effects, which are visible throughout the year but are more severe in winter. The Longer daylight hours during summer result in greater cumulated electrical and power generation during this season. Transient peak output show a weaker seasonal variation, due to the vertical orientation of the component, and higher mean ambient temperatures during mid-summer (which decrease PV efficiency).
There is some evidence to that some wind conditions contribute favourably to cooling the PV facade via heat transfer to the exterior. However, both inlets are fairly sheltered from the wind, and those perturbations to air flow in the cavity that appear to be caused by gusts of wind do not alter air flow over timescales of many minutes. This is demonstrated by the insensitivity of the behaviour models to wind speed. Further studies are required to reveal the relationship between transient air flow behaviour and local wind conditions.
As a consequence of a minimal wind effect, the stack effect dominates air flow in the cavity. The actual air flow rate in the cavity is thus the net air flow due to buoyancy forces, and losses due to pressure drops at inlets, and frictional losses along the cavity (Gratia and De Herde, 2004). The theoretical air flow rate induced by the stack effect can be estimated by the equation
, (10)
where h is the vertical distance between the inlet and outlet, To and Ti are the outlet and inlet temperatures, and
the thermal expansion coefficient of the air in the cavity. For a sunny day, vstack calculated using Equ. (10) is larger than measure flow rates by a factor of 5, during the period of maximum flow rate. Air flow could therefore be increased through modifications to the geometry of the prototype (inlets, depth of cavity, changes to prism configuration, or other structures to limit possible horizontal air flow and recirculation). Providing such alteration would not render the cavity overly sensitive to disruptions from the wind, it would be possible to improve the thermal performance of PV double facade.
5.2. Predictability of the PV double skin facade
The clear regularity in behaviour suggested by daily cycles was verified by the parametric analysis of the data:
o i
stack