Correct identification of a myocardial perfusion
SPECT lesion leads to early diagnosis of lung cancer
Suresh Viswanathan, FRACP,a Jan Mueller-Brand, MD,aMatthias E. Pfister, MD, FACC,b and Michael J. Zellweger, MDb
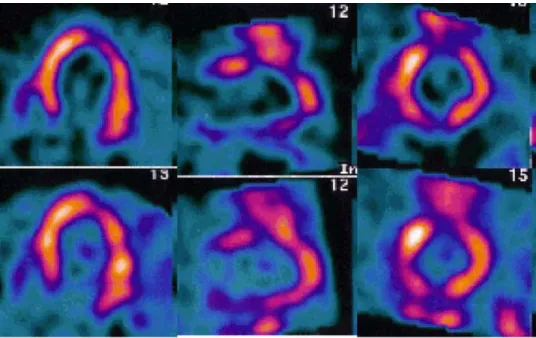
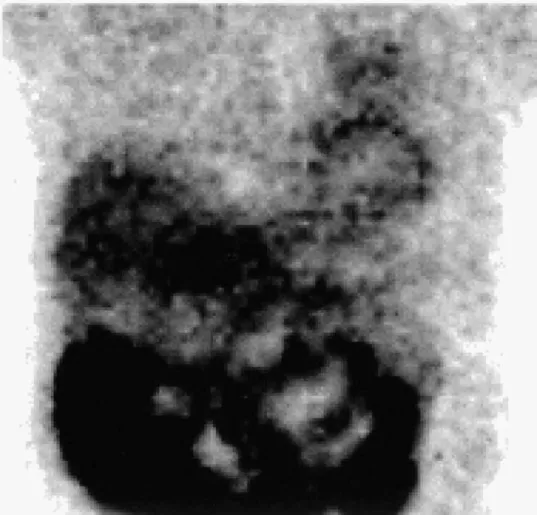
Case presentation. A 62-year-old man presented with recent onset of typical angina. Dual-isotope myo-cardial perfusion scintigraphy (MPS) was performed. The rest and stress images are shown in Figure 1. The raw data image of the thorax is shown inFigure 2.
The findings were consistent with an inferior wall scar with a small amount of peri-infarct ischemia; however, the anterior wall was difficult to interpret because of the promi-nent overlying extracardiac activity. This activity can be seen in the anterior projection image ofFigure 2. The single photon emission computed tomography–reconstructed im-ages of Figure 1 confirm that the extraneous activity is within the chest cavity and located above the left ventricle.
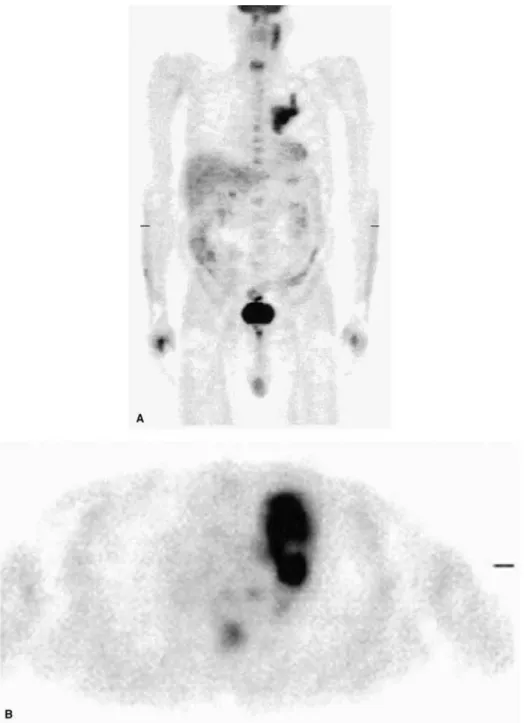
This abnormal activity was present in the thallium 201 and technetium 99m sestamibi raw data. Because of the high likelihood of malignancy, a chest computed tomogram was ordered (Figure 3). Bronchoscopy fol-lowed, from which the lesion was diagnosed as non– small cell carcinoma, and in addition, the patient underwent positron emission tomography for staging purposes (Figure 4). On the basis of the positron emis-sion tomography result, the patient was staged as N2 M0. The relatively early diagnosis allowed the patient to proceed to surgery with curative intent.
Discussion. Noncardiac lesions are present in about 1.7% of MPS studies.1This illustrates the
impor-tance of examining all of the information provided by MPS, as Tl-201 and Tc-99m sestamibi are taken up not only by the myocardium but also by a wide variety of benign and malignant lesions.2
Acknowledgment
The authors have indicated they have no financial conflicts of interest.
From the Departments of Nuclear Medicineaand Cardiology,b
Univer-sity Hospital, Basel, Switzerland
Reprint requests: Michael Zellweger, MD, Department of Cardiology, University Hospital, Petersgraben 4, CH-4031 Basel, Switzerland;
mzellweger@uhbs.ch.
J Nucl Cardiol 2004;11:361-3. 1071-3581/$30.00
Copyright © 2004 by the American Society of Nuclear Cardiology. doi:10.1016/j.nuclcard.2004.03.003
Figure 1. Horizontal long-axis (left), vertical long-axis (middle), and short-axis (right) images of the left ventricle, with stress images (Tc-99m sestamibi) shown in the top row, and the corresponding rest images (Tl-201) shown in the bottom row.
Figure 3. Chest computed tomogram shows a mass in the left upper lobe with enlarged pericarinal lymph nodes and complete atelectasis of the left upper lobe and part of the lingula.
Figure 2. Raw data view of the thorax (Tc-99m sestamibi).
362 Viswanathan et al Journal of Nuclear Cardiology
References
1. Williams KA, Hill KA, Sheridan CM, et al. Noncardiac findings on dual-isotope myocardial perfusion SPECT. J Nucl Cardiol 2003;10: 395-402.
2. Sutter CW, Joshi MJ, Stadalnik RC. Noncardiac uptake of techne-tium-99m MIBI. Semin Nucl Med 1994;24:84-6.
Figure 4. Positron emission tomography study, with fluoro-2-deoxy-D-glucose (F-18 FDG) used as the tracer, shown in the whole-body projection view (A) and transaxial view (B), demonstrates intense tumor uptake in the left upper lobe, near the left hilum, with lower-grade uptake in the surrounding atelectasis. F-18 FDG uptake outside the lung in the whole-body view is physiologic with no evidence of distant metastases.
Journal of Nuclear Cardiology Viswanathan et al 363