Water Pollution Monitoring Of Nitrates Leaching From Agricultural Fields
With Industrial Crop Harvesting Practices. The Belgian Case Of Onsite
Lysimeters As A Monitoring Tool.
Fonder Nathalie*(1), Jean Marie Marcoen(2), Dimitri Xanthoulis (3)
(1) Epuvaleau npa, Avenue de la Faculté d’Agronomie, 5030 Gembloux ; tel :+32 81 62 2557 ; Fax : +32 81 62 2195 ;
fonder.n@fsagx.ac.be
(2) GRENeRA, Geopedology Laboratory, Gembloux Agricultural University, Passage des déportés, 2, 5030 Gembloux ; Tel / Fax :+32 81 62 2540 ; Marcoen.jm@fsagx.ac.be ;
(3) Gembloux Agricultural University, Department of Hydrology and Rural Hydraulics, Passage des déportés, 2, 5030 Gembloux ; tel :+32 81 62 2186 ; Fax : +32 81 62 2195; Xanthoulis.d@fsagx.ac.be
ABSTRACT
The European Nitrate Directive (91/676/CEE) aims at moderating or preventing water pollution from nitrates released by agricultural practices. The Belgian Walloon region transposed it into law and initiated a Sustainable Nitrogen Management Program in 2002 (also called PGDA in French). The non-profit association NITRAWAL amongst others, is in charge of providing support to farmers to implement and respect this program. GRENeRA is one of the organizations designated for scientific studies. In this frame, GRENeRA and its partners implemented six lysimeters in agricultural open fields, operated under real conditions of industrial harvest crops, especially vegetables. The lysimeters are used as follow up tools to monitor and quantify the amount of nitrates leaching beyond the root zone towards underground water reserves.
This study demonstrates that lysimeters are efficient and permit the collection of representative samples of seepage water. On a quality stand point, nitrate content combined with data related to agricultural practices, fertilisation rates applied and advised, climate, the defined environmental indicator (APL) provide a global approach to link agricultural practices and underground water protection from nitrate pollution. The lysimeters validate the reliability of the environmental indicator (APL) with the nitrate content in leaching water, which will not be uptaken by the next crop. Unfortunately, it is also demonstrated that even when the nitrogen management is respectful of the current legislation, the goal to comply with the targeted standards of water quality is not ensured. The lysimeter tool clearly show that the respect of seepage water quality standards issued from industrial agriculture does not have to be considered per crop but rather from an integrated and global perspective of the complete crop sequence and rotations, in respect with best agricultural practices, reasonable fertilisation rates, inset crops, etc., for each individual crop being part of the overall rotation. Some favourable and non favourable crop sequences with respect to nitrates content of underground water are summarized. Experiments are in progress on crop sequence evaluation and fertilisation levels and recommendations for Belgian Walloon industrial crops and their associated impacts on the leaching water quality and nitrate content collected by lysimeters.
Key words . Nitrate lixiviation, lysimeters, water pollution, industrial agriculture, nitrogen fertilisation, environmental indicator.
INTRODUCTION
The increase of agricultural productivity has generally been linked with a non-rational use of agro-chemicals in general and nitrogen fertilisers especially. The excess of nitrified nitrogen, not uptaken by root absorption, is subject to nitrate leaching with depth and generate the risk of nitrate pollution of underground water reserves (Soudi et al., 2005). It is understood that the intensity of the phenomena is dependent on the soil texture, the absorption capacity of the crops, the rainfall and/or irrigation amounts, and the amount of mineral nitrogen applied and/or mineralised from the native organic matter either in the soil or in the supply water (Fonder et Xanthoulis, 2005).
The European Community Economic Council ordered on December 1991 the Nitrate Directive (91/676/CEE). Its aim is to reduce water pollution from nitrates released from agriculture. The State members have to evaluate the sensitivity of their water bodies to nitrate pollution from agriculture and designate sensitive areas where an action programme has to be defined. The Walloon government of Belgium transposed it into law and initiated the 2002 Nitrogen Sustainable
Management Programme (PGDA in French). This first quadrennial action plan set standards on mineral and organic fertilisation rates and a recommended agricultural practices code. By 2005, like some other state members, the Walloon Region was condemned by European commission for non complete transcription into the law of the nitrate directive. The boundaries of sensitive areas and the conditions and procedures for farm fertilisers were judged inadequate. An important work of the PGDA review process, under the authority of the agricultural ministry, has since been undertaken by the numerous Walloon stakeholders concerned by the application of this legislation. The second PGDA action plan was launched in February 2007 and retroactively applied from January 2007. This new legislation could have a new impact on operation managements by farmers (Thirion, Mulders, 2006).
The non profit association NITRAWAL created in 2000 by the initiative of Environment and Agriculture ministries to provide support to farmers to apply this second action plan. Nitrawal has 4 regional centres and is supported by 2 scientific partners from two different Walloon universities; it has 2 partners relaying towards the Water sector and finally, the agricultural sector.
GRENeRA, one of the two scientific partners, and its collaborators have set up and used six lysimeters in open field on agricultural lands being utilized by farmers with real operational conditions of industrial harvest crops, mainly vegetables. The lysimeters provide a tool which permits a quantitative follow-up of the nitrate percolation beyond the root zone. The quantification of the nitrate nitrogen leaching aims at:
- quickly and accurately providing to the agricultural sector confidence about the relevance of APL standards
- verifying the adequacy between standards and the objective of water quality preservation - providing advices on crop rotation and sequences which are respectful of the water quality
goal of 50 mg NO3-/L of nitrate in seepage water, and those to avoid or review. MATERIAL AND METHODOLOGY
The lysimeters
The analysis of advantages and disadvantages of lysimetric systems has driven the choice for a closed system. It is the only system that simultaneously permits measurement of the drainage solution and its concentration in an exactly defined volume. Collected samples allow an appreciation of the effect of some agricultural practices on the environment, as recommended by the PGDA. An initial study implemented in situ lysimeters (in open fields), in order to measure the quality of water that leaches towards groundwater, and most importantly the nitrate concentration. After having compiled practical works data and parameters for a quality lysimetry study according to FAO (1986), three lysimeters in a non-disturbed soil system and three lysimeters in a disturbed soil system have been placed in open fields in pilot farms. The setting of non-disturbed soil systems was done by a vertical staving in of the lysimeter cylinder with a hydraulic shovel. Afterward, the bottom plate has been horizontally slid under the cylinder and the water tightness has been realized with solder joints (Figure 1.). The disturbed systems were installed by digging a hole in which the lysimetric tank (soldered beforehand in the workshop) was placed. The tank was then filled with the successive soil layers, carefully separated at the same time as the hole was dug, following pedologic profile observations. The lysimetric tank is an open cylinder with a cross-section area of 1m² (diameter of 1,13 m), made in stainless steel of 5 mm thick, and with a height of 1,5m. The tank is placed vertically 50 cm under the soil surface, to be in actual operating conditions and to avoid any intereferences with the agricultural practices, set in the open field and outside headlands. The water flows through a pipe from the draining base for the disturbed systems and from 3 connected draining pipes located 30 cm apart and 10 cm above the bottom of the non disturbed systems, into a polyethylene sampling container, placed in a manhole on the outside of the field. They are set in the Hesbaye region on two different farms which belongs to the “Survey Surface Agricole” (reference farms annually setting the environmental indicator values) partly in an
irrigation perimeter and under industrial vegetable crops rotating with classical cultivations. A weekly data reading frequency has been validated with sampling tests. Data readings consist of on-site measurements of physical parameters (temperature and precipitation), of chemical parameters (pH, electrical conductivity and nitrate concentrations) and samples are brought to a reference laboratory for a precise analysis of nitrate in the water.
Figure 1 : Sketch of the lysimeter tank, non disturbed system
Pedological classification
The six lysimeters are implemented on soils classified by the Belgian Pedological Maps as loamy soils, with a textural soil development, named AbA or Abp according to their location on a plateau or on a slope; their profile developments are more or less deep with variable drainage conditions.
Climate data
Climate data are issued from the Royal Belgian Institute of Meteorology (IRM, Institut Royal Météorologique) and collected since the implementation of the lysimeters on 2003. The data are related to: Average Temperature (°C), rainfalls (l/m²), rain frequency (days) and insolation time (hours). Briefly, those records show a global tendency to extreme events (warm summer and cold winter) and a deficiency in global rainfalls. Monthly records of rainfall frequency and quantity unfortunately often hide the successions of extreme events, showing normal values in average. Those data are collected also to assess the infiltration rate of water inside the lysimeters, in relation with seasonal crops and the water needs of plants.
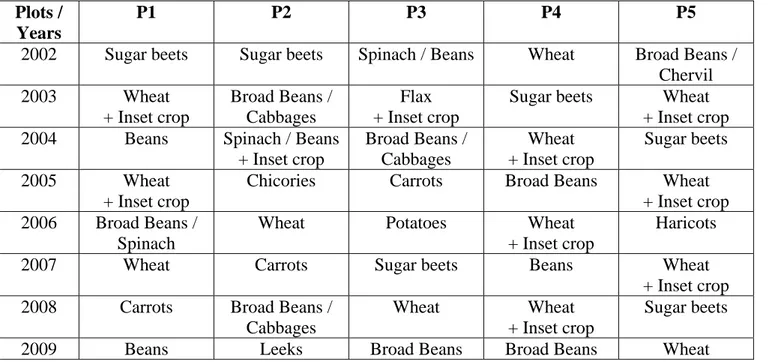
Crops rotations
Being on real operational conditions, the crops which are cultivated above lysimeters are depending on farmers’s decision only. The crops sequences are briefly presented by Table 1. The collected data related to crops are sowing and harvesting dates and yields obtained. Nitrogen fertilisation is defined as mineral or organic with its quantity and composition, as well as dates of supply. Dates for inset crops and their destruction are also noted. Out of the six plots, five only will be discussed within this paper as the sixth lysimeter has never provided constant and reliable data. It has currently been removed out of the field and re-installed on another plot in order to avoid the encountered technical problems.
Draining pipes
Perforation holes 0,6cm
30 cm, diameter 1’ Total Height
1,5 m Belt for joints 10 cm height
Radius = 56 cm
Table 1 : summary of the crops rotation on plots above lysimeters implementation.
Plots / Years
P1 P2 P3 P4 P5
2002 Sugar beets Sugar beets Spinach / Beans Wheat Broad Beans /
Chervil 2003 Wheat + Inset crop Broad Beans / Cabbages Flax + Inset crop
Sugar beets Wheat
+ Inset crop
2004 Beans Spinach / Beans
+ Inset crop Broad Beans / Cabbages Wheat + Inset crop Sugar beets 2005 Wheat + Inset crop
Chicories Carrots Broad Beans Wheat
+ Inset crop 2006 Broad Beans /
Spinach
Wheat Potatoes Wheat + Inset crop
Haricots
2007 Wheat Carrots Sugar beets Beans Wheat
+ Inset crop
2008 Carrots Broad Beans /
Cabbages
Wheat Wheat + Inset crop
Sugar beets
2009 Beans Leeks Broad Beans Broad Beans Wheat
Lysimeters have voluntary been installed within a vegetable industrial agricultural area. The master of nitrogen management is lesser known (Xanthoulis et Guillaume, 1996) and they request strict nitrogen supplies. The sixth lysimeter has been re-installed on classical industrial crops in the Belgian Walloon region.
RESULTS AND DISCUSSION Quantity of seepage water
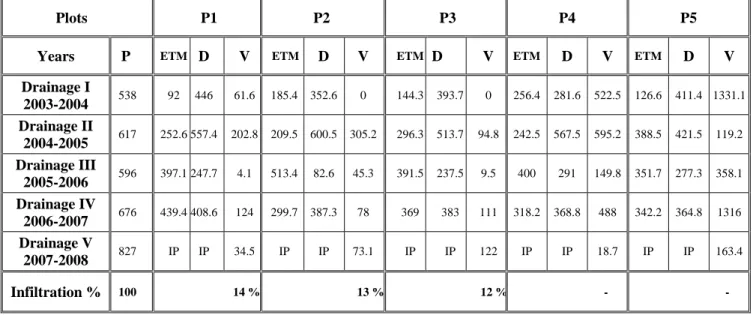
Meteorological data of precipitation (P), additionally with decade data of evapotranspiration (ET) allow the calculation of the water deficiency of soils (P-ET). Rainwater falling on soil surface cannot infiltrate when (P-ET) is negative, what means that the evapotranspiration is higher than precipitation. However, when (P-ET) is positive, it means that the soil water stock is replenished, and the infiltration will occur when the field capacity (specific to the soil type) is exceeded.
Table 2 summarises rainfall (P), Maximum Evapotranspiration (ETM), and volumes collected per plot. ETM is obtained by the multiplication of ET with a crop water consumption coefficient (Kc). The Kc coefficient varies with individual crops and their development stages (germination, growth, maturation). The water budget also takes into account the water supplied by irrigation. This drainage calculation method does not take into account phenomena like runoff, unsaturated flows, water distribution within soils, etc. which require mathematical modelling (which was not the purpose of this research). The drainage value D is thus over-estimated. This water budget is done with the purpose to assess the global efficiency of the lysimeters and to verify that the amount of seepage water collected at the bottom of the lysimeters at 2 meters depth is representative of the amount of water migrating towards groundwater reserves. Table 2 gives the water budget of collected seepage water per plots. It shows that plots P2 and P3 have required one year before the start of infiltration process inside the lysimeter cylinders. Plots P4 and P5 have collected seepage water from the first drainage season, but the amounts were higher than the rainfalls. They trap a temporary winter water table, which was demonstrated by a piezometer monitoring network. Those two lysimeters are now equipped with a tap to close the outlet of the lysimeters as soon as the fringe of the water table is trapped, inducing its drainage by the lysimeter which behave like a big drain pipe. In the Belgian context, when rainfalls are set at 100%, it is considered that 6 to 28% of the
precipitation volume will migrate towards deep soil horizons and will participate in the water recharge of aquifers (Sohier, 2007). In this case, the amounts of seepage water collected at the bottom of lysimeters, (set as a percentage fraction of the precipitation) are in the average of 13%. This indicates that the lysimeters are collecting a representative amount of water leaching towards underground water reserves. Yearly variations in percentages are related to variable drainage seasons, climatic conditions and the current crop above the lysimeters. Due to the reasons explained above, plots P4 and P5 are excluded from these calculations.
Nevertheless, results have to be carefully assessed as lysimeters are set 50 cm below the surface level, which can induce capillary upstream movement, hypodermic flows, and other hydrological processes. Lysimeters also represent a very small part of the agricultural land and finally, by the design concept of lysimeters, there is an artificial water table level which is created at the bottom of lysimeters inducing specific hydrodynamic conditions different from a regular down flow movement towards underground waters.
Table 2 : water budget for plots 1 to 5 presented per drainage seasons.
Plots P1 P2 P3 P4 P5
Years P ETM D V ETM D V ETM D V ETM D V ETM D V
Drainage I 2003-2004 538 92 446 61.6 185.4 352.6 0 144.3 393.7 0 256.4 281.6 522.5 126.6 411.4 1331.1 Drainage II 2004-2005 617 252.6 557.4 202.8 209.5 600.5 305.2 296.3 513.7 94.8 242.5 567.5 595.2 388.5 421.5 119.2 Drainage III 2005-2006 596 397.1 247.7 4.1 513.4 82.6 45.3 391.5 237.5 9.5 400 291 149.8 351.7 277.3 358.1 Drainage IV 2006-2007 676 439.4 408.6 124 299.7 387.3 78 369 383 111 318.2 368.8 488 342.2 364.8 1316 Drainage V 2007-2008 827 IP IP 34.5 IP IP 73.1 IP IP 122 IP IP 18.7 IP IP 163.4 Infiltration % 100 14 % 13 % 12 % - - P= Precipitations (mm),
ETM = Maximal Evapotranspiration (mm), V = collected volume (l),
D = (P + irrigation – ETM) (mm) IP = In progress
Quality of seepage water
Synthesis graphs like Graph 1 presented here below are drawn per plots. Graph 1 summarizes data from plot P1. It includes data from September 2003 until December 2008, related to seepage water (cumulative amount in liters); nitrate content in the leaching water (mg of Nitrates per liter, NO3-/L)
and the nitrogen residues in the soil after harvest, as well as APL measured values (Kg of nitrate nitrogen per ha, N-NO3/ha). Seasonal crops are indicated and fertilisations are mentioned above the graph. The graph shows that the cumulative collected volume of seepage water is similar to any pluviometric curve. Nevertheless, there is no direct correlation between daily or weekly rainfalls and collected volumes at the bottom of lysimeters at 2 m depth, explaining why mathematical models have to be applied. The collected volumes at the outlet of lysimeter also have to be correlated to the crops, e.g., meteorological data attest to a very warm summer and autumn with low rainfalls; the crop was wheat (which has deep roots and was able to extract its water needs from deeper soil horizon layers). This induced a low amount of seepage water collected at the bottom of
the lysimeter during the drainage season of 2005. The measurements of nitrate content were quite constant over time until 2005. Wheat was cultivated with an inset crop to catch nitrogen residues. Followed by a vegetable beans crop, the nitrate content in the leaching water was still acceptable. The same observation was seen in 2006 when wheat was followed by an inset crop and two vegetable crops in a row (broad beans and spinach). When wheat was no more followed by any inset crops and followed by the vegetable cultivation of carrots (2008), nitrate content within leaching water collected by the lysimeters drastically increased. Due to the water needs of carrots, infiltration stopped. Measurements in progress demonstrate that nitrogen residues were not caught back by carrots; nitrogen was lost and was migrating toward deep soil horizons and could contribute to underground water pollution.
Nitrogen fertilisation recommendations and residues in the soil after harvest
The APL indicator is given from the monitoring of the “Survey Surface Agricole” (Agricultural Surface Survey) constituted of 25 farms with a total of 220 fields. A strict nitrogen management is performed on all these fields and they are annually sampled for nitrogen residues in the soil first at spring to provide a nitrogen fertilisation recommendations and secondly, in autumn to assess the residues after harvest. The annual APL (environmental indicator) is established based on those results and provides the list of crops and their related acceptable nitrogen residues in the soil after harvest to be allowed or leading to penalties (fees) for the farmers having field plots presenting values beyond this level.
The global comment related to plots having lysimeters is that none of the plots received a negative assessment from the environmental indicator APL. All farmers have respected the legislation related to nitrogen fertilisation. However the good results for these farmers, indicate that the lysimeters as a follow up monitoring tool demonstrates that several times during the study, the nitrate content in the leaching water had high to very high values. This clearly demonstrates that the legislation has to be updated to avoid these situations in the long term if we want to avoid underground water pollution by nitrates.
Graph 1 : Observations and measurements for plot P1. 0 15 30 45 60 75 90 105 120 135 150 165 180 195 210 s ept-0 3 oc t-03 nov -03 déc -0 3 janv-0 4 fé vr-0 4 ma rs -0 4 av r-04 ma i-0 4 jui n -04 juil -04 août-0 4 s ept-0 4 oc t-04 nov -04 déc -0 4 janv-0 5 fé vr-0 5 ma rs -0 5 av r-05 ma i-0 5 jui n -05 juil -05 août-0 5 s ept-0 5 oc t-05 nov -05 déc -0 5 janv-0 6 fé vr-0 6 ma rs -0 6 av r-06 ma i-0 6 jui n -06 juil -06 août-0 6 s ept-0 6 oc t-06 nov -06 déc -0 6 janv-0 7 fé vr-0 7 ma rs -0 7 av r-07 ma i-0 7 jui n -07 juil -07 août-0 7 s ept-0 7 oc t-07 nov -07 déc -0 7 janv-0 8 fé vr-0 8 ma rs -0 8 av r-08 ma i-0 8 jui n -08 juil -08 août-0 8 s ept-0 8 oc t-08 nov -08 déc -0 8 AP L (k g N-N O 3 /ha ), NO 3 - ( m g/l) 0 15 30 45 60 75 90 105 120 135 150 165 180 195 210
Cum Coll Vol (
l)
APL 60-90 cm (kg N-NO3/ha) APL 30-60 cm (kg N-NO3/ha)
APL 0-30 cm (kg N-NO3/ha) cc NO3- (mg/l)
cumulative collected volume (l) Plot P1
Disturbed soil lysimeter
implementation on 8 August 2003 Crops Wheat Carrots N Fertilisation 2004 2008 2003 Spinach 66 U N-min 97 U N-min B Beans Phacelia Wheat Beans Oat 80 U N-min 58 U N-min 78 U N-min 65 U N-min 58 U N-min 200 U N-org 2005 2006 2007 Wheat
WHO Drinking water standard (50 mg NO3-/L)
CONCLUSION AND CONTRIBUTION TO LEGISLATION ADAPTATION
This study demonstrates that lysimeters can provide a relevant and efficient tool to monitor the water quality migrating towards underground water reserves. They allow collecting onsite representative amounts of leaching water from agricultural fields with industrial cultivations.
Cultivation data, fertilisation rates and recommendations, climatic data, APL environmental indicator levels and lysimeter measurements are a relevant methodology and tool for a better integrated nitrogen management of the intensive agriculture of the Belgian Walloon region, aiming at protection from nitrate pollution of underground water aquifers. Lysimeter measurements show that the APL environmental indicator provides a correct assessment on the nitrate quantity which are lost for individual crops and which will migrate towards underground water reserves. Unfortunately, it is also shown that the current legislation on nitrogen fertilisation is not a guarantee and is not accurate enough to ensure, the water quality targeted for our aquifers. The lysimeter experiments demonstrate that in order to respect the water quality standards, nitrogen management has to be evaluated within the overall crop rotation sequence and not individually by crop.
From the crop rotation standpoint, lysimeter data supports the following recommendations:
- Cereal crops with an inset crop (without organic supply) results in leaching water with a nitrate content below 50 mg NO3-/l ;
- Cereal crops without inset crops do not provide leaching water with a nitrate content below 50 mg NO3-/l. These observations are a strong argument for winter cover crops of 100% for
plots after cereals;
- Sugar beet crops result in leaching water with nitrates content below 50 mg NO3-/l ;
- Potato crops with no winter cover crops do not provide leaching water with nitrate content below 50 mg NO3-/l ;
- Bean crops without winter cover crops lead to high to very high nitrate content in leaching water; inset crops are needed and should be required;
- Winter cover crops should be promoted after any vegetable crops; in the case of beans, according to their harvest date, an inset crop should be added before winter wheat;
- The sequence of spinach followed by beans does not result in a nitrate content in leaching water with nitrates content below 50 mg NO3-/l ; according to the harvest date of beans, an
inset crops should be promoted;
- The sequence of broad beans followed either by cabbages or spinach does not provide a leaching water with nitrates content below 50 mg NO3-/l ; however nitrogen management
and distribution still can be improved on spinach and cabbage in order to reduce this impact; - The sequence of broad beans and wheat does not provide a leaching water with a nitrate content below 50 mg NO3-/l ; however an inset crop after broad beans should be promoted.
Fertilisation rates are still being tested for improvements; nevertheless, it is demonstrated that existing guidelines should be followed.
Works are in progress to further investigate specific crop sequences and rotations, as well as recommended fertilisation rates for the different crops grown in the Belgian Walloon region, with the aim of reducing the agricultural impact on underground water pollution by nitrate
ACKNOWLEDGMENTS
This paper summarises works completed in two different projects “Lysimeters set up to validate
the nitrogen fertilisation rates advised by the Sustainable Nitrogen Management program (PGDA) of the Walloon region” (referenced 3523/1) funded by the Walloon Region (March 2003
– February 2005); and “Follow up of nitrates with lysimeters’tool in the frame of the
region (March 2005 – May 2007). These works are still continuing with the current project in progress “Adaptation of agricultural practices according to the Nitrate Directive and
validation by the lysimeterstool to monitor nitrates leaching” (referenced 3523/3) funded by the
Walloon Region.
REFERENCES
1. Aboukhaled A., Alfaro J.F., Smith M. 1986. - Les Lysimètres. Bulletin FAO d’irrigation
et de drainage, n°39 . FAO Rome.
2. Fonder N., Xanthoulis D. 2005. Le bilan azoté évalué par l’outil lysimétrique. In : Soudi
B., Debouche C., Khrim L., Vanoverstraeten M., Ettalibi M. Edts. Maîtrise des flux de
matières et rationalisation des pratiques agricoles. Actes Editions, Rabat 2005.
(ISBN : 9981-801-67-4), 203-216.
3. Thirion M., Mulders Ch. 2006. Le programme de gestion durable de l’azote change. Les
cahiers de l’agriculture, n°42, Novembre 2006.
4. Sohier C. (2007). Présentation à Nitrawal Dynamique des eaux de lessivage dans la zone
vadose : processus et modélisation.
5. Soudi B., Choukr Allah R., Xanthoulis D., Krim L., Fonder N. 2005. Gestion
agro-environnementale de l’azote apportée par les eaux usées épurées : application du modèle Ecobilan de gestion des flux de l’eau et des éléments nutritifs. In : Soudi B., Debouche C., Khrim L., Vanoverstraeten M., Ettalibi M. Edts. Maîtrise des flux de matières et
rationalisation des pratiques agricoles. Actes Editions, Rabat 2005. (ISBN :
9981-801-67-4), 108-120.
6. Vandenberghe C., Mohimont A-C., Marcoen J.M. 2002. Mise en œuvre du Survey
Surfaces Agricoles - Aspects « mesures du reliquat azoté » . Rapport d’activités annuel
intermédiaire 2002, Dossier GRENeRA 02-03. 13p.
7. Xanthouils D., Guillaume Ph., 1996. Utilisation de l’azote par les cultures maraîchères
irriguées avec les eaux usées industrielles. CMH, FSAGHx UER Hydrologie et Hydraulique