HAL Id: inserm-00637109
https://www.hal.inserm.fr/inserm-00637109
Submitted on 30 Oct 2011
HAL is a multi-disciplinary open access
archive for the deposit and dissemination of
sci-entific research documents, whether they are
pub-lished or not. The documents may come from
teaching and research institutions in France or
abroad, or from public or private research centers.
L’archive ouverte pluridisciplinaire HAL, est
destinée au dépôt et à la diffusion de documents
scientifiques de niveau recherche, publiés ou non,
émanant des établissements d’enseignement et de
recherche français ou étrangers, des laboratoires
publics ou privés.
Passive leg raising can predict fluid responsiveness in
patients placed on venovenous extracorporeal membrane
oxygenation.
Pierre-Grégoire Guinot, Elie Zogheib, Mathieu Detave, Mona Moubarak,
Vincent Hubert, Louise Badoux, Eugénie Bernard, Patricia Besserve, Thierry
Caus, Hervé Dupont
To cite this version:
Pierre-Grégoire Guinot, Elie Zogheib, Mathieu Detave, Mona Moubarak, Vincent Hubert, et al..
Passive leg raising can predict fluid responsiveness in patients placed on venovenous extracorporeal
membrane oxygenation.. Critical Care, BioMed Central, 2011, 15 (5), pp.R216. �10.1186/cc10451�.
�inserm-00637109�
R E S E A R C H
Open Access
Passive leg raising can predict fluid
responsiveness in patients placed on venovenous
extracorporeal membrane oxygenation
Pierre-Grégoire Guinot
1*, Elie Zogheib
1, Mathieu Detave
1, Mona Moubarak
1, Vincent Hubert
1, Louise Badoux
1,
Eugénie Bernard
1, Patricia Besserve
1, Thierry Caus
2,3and Hervé Dupont
1,3Abstract
Introduction: In ICUs, fluid administration is frequently used to treat hypovolaemia. Because volume expansion (VE) can worsen acute respiratory distress syndrome (ARDS) and volume overload must be avoided, predictive indicators of fluid responsiveness are needed. The purpose of this study was to determine whether passive leg raising (PLR) can be used to predict fluid responsiveness in patients with ARDS treated with venovenous extracorporeal membrane oxygenation (ECMO).
Methods: We carried out a prospective study in a university hospital surgical ICU. All patients with ARDS treated with venovenous ECMO and exhibiting clinical and laboratory signs of hypovolaemia were enrolled. We measured PLR-induced changes in stroke volume (∆PLRSV) and cardiac output (∆PLRCO) using transthoracic
echocardiography. We also assessed PLR-induced changes in ECMO pump flow (∆PLRPO) and PLR-induced changes in ECMO pulse pressure (∆PLRPP) as predictors of fluid responsiveness. Responders were defined by an increase in stroke volume (SV) > 15% after VE.
Results: Twenty-five measurements were obtained from seventeen patients. In 52% of the measurements (n = 13), SV increased by > 15% after VE (responders). The patients’ clinical characteristics appeared to be similar between responders and nonresponders. In the responder group, PLR significantly increased SV, cardiac output and pump flow (P < 0.001). ∆PLRSV values were correlated with VE-induced SV variations (r2= 0.72, P = 0.0001). A 10% increased ∆PLRSV predicted fluid responsiveness with an area under the receiver operating characteristic curve (AUC) of 0.88 ± 0.07 (95% confidence interval (CI95): 0.69 to 0.97; P < 0.0001), 62% sensitivity and 92% specificity.
On the basis of AUCs of 0.62 ± 0.11 (CI95: 0.4 to 0.8; P = 0.31) and 0.53 ± 0.12 (CI95: 0.32 to 0.73, P = 0.79),
respectively, ∆PLRPP and ∆PLRPO did not predict fluid responsiveness.
Conclusions: In patients treated with venovenous ECMO, a > 10% ∆PLRSV may predict fluid responsiveness. ∆PLRPP and ∆PLRPO cannot predict fluid responsiveness.
Keywords: acute respiratory distress syndrome, fluid responsiveness, passive leg raising, extracorporeal membrane oxygenation, venovenous
Introduction
In ICUs, fluid administration is frequently used to treat hypovolaemia to enhance cardiac function by increasing preload. Many studies have demonstrated that fluid responsiveness can be predicted by using respiratory
derivative indices (pulse pressure variation (∆respPP), stroke volume (SV) variation (∆respSV) and aortic velo-city-time integral variation (∆respVTIAo)) [1-5]. From a clinical perspective, owing to altered alveolar capillary membrane permeability, fluid management is critical to the outcomes of ARDS patients [6,7]. In ARDS, dynamic indices predictive of fluid responsiveness present limita-tions related to the effects of the cardiopulmonary dis-ease on heart-lung interactions (right-sided heart failure,
* Correspondence: guinotpierregregoire@gmail.com
1
Department of Anesthesiology and Critical Care, Amiens University Hospital, Place Victor Pauchet, Amiens, F-80054, France
Full list of author information is available at the end of the article
© 2011 Guinot et al.; licensee BioMed Central Ltd. This is an open access article distributed under the terms of the Creative Commons Attribution License (http://creativecommons.org/licenses/by/2.0), which permits unrestricted use, distribution, and reproduction in any medium, provided the original work is properly cited.
pulmonary hypertension and protective ventilation) [8-12]. In addition, as fluid overload can be harmful, indices using passive leg raising (PLR) have been vali-dated [13-17]. By shifting blood from the lower limbs and splanchnic compartment, PLR is a safe, reversible manoeuvre that mimics fluid expansion [16]. In adult patients with refractory ARDS, despite ventilatory opti-misation by means of routine therapies (protective mechanical ventilation, prone position and nitric oxide) [18,19], the use of respiratory assistance such as venove-nous extracorporeal membrane oxygenation (ECMO) ensures oxygenation and decarboxylation [20-22]. Veno-venous ECMO consists of a circuit supplied by a centri-fugal pump without a venous reservoir. Venous return and pump venous injection are preload- and postload-dependent processes that run in parallel to the human right-sided circulation and may interfere with it [23-25]. In hypovolaemic patients, PLR prediction of fluid responsiveness is unclear. Blood transfer induced by PLR may be modified by the preload dependence of the ECMO. Because patients supported by ECMO are the frailest ARDS patients, because they present with several interrelated diseases that limit the use of respiratory dynamic criteria, and because fluid therapy can affect outcomes, it is necessary to validate additional man-oeuvres such as PLR that may better discriminate responders from nonresponders.
The main goal of this study was to answer the follow-ing question: Can PLR be used to predict fluid respon-siveness in ARDS patients placed on venovenous ECMO? As ECMO pump flow (PO) is a preload-depen-dent process, we assumed that changes in PO between baseline and PLR (∆PLRPO) could reflect a preload-dependent condition. Thus, we analysed the predictive value of ∆PLRPO.
Materials and methods Patients
We conducted a prospective, observational study at the Amiens Sud University Hospital surgical ICU over a period of 13 months (from November 2009 to Decem-ber 2010). ARDS patients treated with venovenous ECMO for whom the intensivist recommended volume expansion (VE) were enrolled in the study. Patients with poor cardiac echogenicity were not included. All patients had been sedated and paralysed with continu-ous infusion of midazolam, sufentanil and cisatracurium. All patients underwent invasive arterial pressure moni-toring, central venous catheterisation and echocardiogra-phy several times daily because of their various diseases.
This study was approved by the Institutional Review Board (IRB) for human subjects at our hospital. Informed consent was waived because the IRB consid-ered the protocol to be part of routine clinical practice.
Extracorporeal membrane oxygenation
The ECMO circuit consists of an inflow venous line inserted into the right femoral vein and advanced through the inferior vena cava close to the right atrium, an outflow venous line inserted into the right internal jugular vein as far as the right atrium, a ROTAFLOW centrifugal pump (MAQUET GmbH & Co. AG, Rastatt, Germany) and a QUADROX PLS oxygenator (MAQUET GmbH & Co. AG). Inflow and outflow can-nula sizes are reported in Table 1.
Measurements
The following clinical features were measured: age; gen-der; weight; surgical, medical and/or clinical problems; and the main diagnosis. Transthoracic echocardiography (TTE) was performed by a single physician using a Phi-lips EnVisor Ultrasound System (PhiPhi-lips Medical Sys-tems, Suresnes, France). The diameter of the aortic annulus (AoD) was measured using a long-axis paraster-nal view at patient inclusion. Aortic area (Aa) was calcu-lated by using the equation Aa (in cm2) = (π × AoD2)/4. The aortic velocity-time integral (VTIAo) ratio was mea-sured using pulsed Doppler ultrasonography with a five-chamber apical view. SV was calculated by using the equation SV (in mL) = VTIAo × Aa. Cardiac output (CO) was calculated using the formula CO (in mL/min-ute) = SV × heart rate (HR). Mean echocardiographic values were calculated from five measurements (regard-less of the respiratory cycle) and analysed a posteriori. The reproducibility of aortic area and VTIAo measure-ments were tested before the study. Intraindividual and interindividual reproducibility were calculated from the mean value of three of ten patients. The mean (± stan-dard deviation) intraindividual and interindividual repro-ducibility values were 4.4 ± 3.9% and 4.4 ± 3.2%, respectively. The ECMO PO was measured on the monitor screen by a physician at the different steps of the study. Maximum and minimum pump flow (POmax
and POmin, respectively) were recorded for one minute.
Mean PO was calculated as PO (in mL/minute) = (POmax + POmin)/2. PO variation was called the pulse
index (PI) and calculated as PI = (POmax - POmin)/
(POmax+ POmin/2) × 100. The PO/rotation per minute
(RPM) ratio (expressed in mL/rotation/minute) was cal-culated as (PO/RPM) × 1,000. Central venous pressure (CVP) and blood pressure were measured with a trans-ducer zeroed at the level of the midaxillary line. ∆respPP was measured on frozen waveforms on the monitor by calculating ∆respPP = (PPmax - PPmin)/
[(PPmax+ PPmin)/2)] × 100.
Study protocol
Systolic arterial pressure (SAP), median arterial pres-sure (MAP), diastolic arterial prespres-sure (DAP), ∆respPP,
Guinot et al. Critical Care 2011, 15:R216 http://ccforum.com/content/15/5/R216
CVP, CO, VTIAo and HR were recorded at baseline with the patient in a semirecumbent position (45° angle). Automatic bed raising from this position raised the patient’s lower limbs to a 45° angle while the patient’s trunk was lowered from a semirecumbent to supine position [11]. A second set of SAP, MAP, DAP,
HR, CVP, PO, ∆respPP and VTIAo measurements was recorded when VTIAo plateaued at its highest value. The patient was then returned to the initial semire-cumbent position, and VE was initiated with 500 mL of saline for 15 minutes. A third set of measurements was recorded after VE. The ventilator settings, drugs
Table 1 Main patient characteristics at the time of inclusiona
Patient Gender ARDS aetiology Outflow/ inflow cannula size (French) PaO2/FiO2 ratio at ECMO assistance Time from assistance with ECMO (days) Tidal volume (mL/kg) Respiratory compliance (mL/ cmH2O) Norepinephrine Epinephrine or dobutamine Acute cor pulmonale 1 M Community-acquired pneumonia 18/25 42 2 4 17.6 Yes No Yes 8 6 34.3 Yes No Yes 2 F H1N1 18/22 45 3 2.6 9.6 No Yes Yes 3 M H1N1 18/23 42 5 4.1 16 Yes No Yes 4 M Postoperative bacterial pneumonia
18/25 37 2 5.4 26.9 Yes Yes Yes
12 7.1 41.8 Yes Yes Yes
5 M Peritonitis 18/25 60 4 4.4 24.6 Yes No No
7 5.1 28.7 Yes No No
6 F H1N1 18/24 45 5 3.7 14.7 yes Yes Yes
7 M Postoperative
bacterial pneumonia
18/25 38 6 6 23.5 Yes Yes Yes
6 3.8 10.4 Yes Yes Yes
8 F
Community-acquired pneumonia
18/25 50 7 5.8 21.3 No No No
9 F H1N1 16/24 39 4 3.6 15 Yes Yes Yes
12 5 27.3 Yes No No
10 M Chest trauma 18/25 38 5 3.4 20.8 Yes No Yes
11 4.8 23.8 No No No 11 F Community-acquired pneumonia 16/25 58 11 5.6 16.3 No No No 15 8 24.4 No No Yes 12 M Postoperative bacterial pneumonia
16/25 45 4 2.9 12.2 Yes Yes Yes
8 4.6 15.9 Yes No Yes 13 M Community-acquired pneumonia 18/25 87 5 2.8 11.7 No Yes Yes 14 M Bronchopleural fistula
18/25 52 10 2.9 12.2 Yes Yes Yes
15 M Postoperative bacterial pneumonia 18/25 44 5 3.3 16.7 No Yes Yes 16 M H1N1 18/24 50 6 5.7 38.2 Yes No No 17 F Community-acquired pneumonia 16/23 46 3 3.4 16.7 Yes No Yes a
ARDS, acute respiratory distress syndrome; PaO2/FiO2ratio, ratio of partial pressure of arterial oxygen to fraction of inspired oxygen; ECMO, extracorporeal
and ECMO RPM were maintained at constant levels throughout the study period.
Statistical analysis
SV measured before and after VE was used to distin-guish responders from nonresponders with changes in SV of > 15% and < 15%, respectively [7,9,12]. The results are expressed as medians (25th to 75th inter-quartile ranges). Changes in haemodynamic variables were compared between responders and nonresponders before PLR and VE using the nonparametric Mann-Whitney U test. For the overall population and for each subgroup (responders and nonresponders), the nonpara-metric Wilcoxon rank-sum test was used to assess the statistical significance of changes in PLR-induced hae-modynamic parameters or VE and to compare the pre-PLR values of the variables measured at baseline (HR, SAP, DAP, MAP, SV, VTIAo, PO and PI). Spearman’s rank correlation coefficient was used to test linear corre-lations. A receiver operating characteristic curve (ROC) and its corresponding positive and negative likelihood ratios were generated for PLR-induced changes in SV (∆PLRSV), CO (∆PLRCO) and PO (∆PLRPO) [26]. Area under the ROC (AUC) values for ∆PLRSV and ∆PLRCO were compared. Differences with a P value < 0.05 were considered statistically significant. Statistical analysis was performed using IBM SPSS Statistics 18 software (IBM Corp., Armonk, NY, USA) and MedCalc 8.1.0.0 software (Mariakerke, Belgium).
Results
Twenty-five measurements were obtained from seven-teen patients. PLR manoeuvres and VE were performed twice on eight patients on different days and under dif-ferent respiratory and haemodynamic conditions. The patients had acute circulatory failure associated with septic shock and primary or secondary ARDS. The most common cause of heart failure was acute cor pulmonale, defined on the basis of echocardiographic criteria [27]. The patient characteristics are reported in Table 1. All VEs were performed on the basis of the following cri-teria: arterial hypotension (SAP < 90 mmHg and/or MAP < 70 mmHg) (n = 12), oligoanuria (urine output < 0.5 mL/kg/hour or < 20 mL/hour) (n = 9), skin mottling and/or leg coldness (n = 4).
Of the 25 patients who underwent VE, 13 (52%) were responders: SV increased by > 15%. At baseline, the hae-modynamic and echocardiographic parameters were similar in both groups. None of these parameters were predictive of fluid responsiveness. Tables 2 and 3 pre-sent the haemodynamic, echocardiographic and PO parameters. SV and CO increases during PLR and after VE were correlated (respectively, r2 = 0.72, P = 0.0001
Table 2 Comparison of haemodynamic parameters between responders and nonrespondersa
Parameters Responders (n = 13) Nonresponders (n = 12) P values HR (bpm) Baseline 95 (82 to 106) 95 (81 to 104) 0.95 PLR 95 (76 to 104) 91 (77 to 106) 0.95 Volume expansion 93 (78 to 105) 96 (79 to 106) 0.72 SAP (mmHg) Baseline 108 (99 to 121) 105 (92 to 115) 0.47 PLR 117 (93 to 121) 107 (86 to 120) 0.46 Volume expansion 120 (111 to 130)b, c 107 (99 to 126) 0.2 DAP (mmHg) Baseline 59 (49 to 71) 57 (46 to 70) 0.62 PLR 61 (44 to 67) 61 (44 to 70) 1 Volume expansion 67 (49 to 72)b, c 56 (50 to 70) 0.51 MAP (mmHg) Baseline 77 (65 to 84) 75 (62 to 83) 0.62 PLR 77 (61 to 84) 72 (58 to 84) 0.64 Volume expansion 83 (71 to 90)b, c 71 (67 to 87) 0.27 CVP (mmHg) Baseline 7 (5 to 13) 11 (8 to 15) 0.08 PLR 12 (8 to 14)b 12 (10 to 13) 0.68 Volume expansion 12 (10 to 15)b 13 (10 to 17)b 0.46 ∆respPP (%) Baseline 6 (4 to 8) 7 (4 to 10) 0.59 PLR 6 (4 to 7) 9 (5 to 11) 0.14 Volume expansion 5 (4 to 8) 7 (5 to 10) 0.11 VTI (cm/second) Baseline 20 (15.2 to 25) 16.1 (13.7 to 21.6) 0.3 PLR 24.7 (17.7 to 28.3) b 15.8 (12.9 to22.3) 0.03 Volume expansion 25.4 (19.1 to 30)b, c 16 (14 to 21.4) < 0.001 SV (mL) Baseline 72 (50 to 88) 55 (49 to 84) 0.7 PLR 86 (59 to 99)b 58 (48 to 85) 0.1 Volume expansion 89 (66 to 109)b, c 60 (48 to 82) 0.02 CO (L/minute) Baseline 5.8 (4 to 8.3) 5.6 (4.3 to 7.8) 0.96 PLR 5.9 (4.7 to 9.6)b 5.8 (4 to 6.6) 0.27 Volume expansion 7.5 (5.2 to 10.1)b, c 5.2 (4.4 to 7.7) 0.03
aPLR, passive leg raising; HR, heart rate; SAP, systolic arterial pressure; DAP,
diastolic arterial pressure; MAP, median arterial pressure; CVP, central venous pressure; ∆respPP, respiratory pulse pressure variation; VTI, velocity time integral of aortic blood flow; SV, stroke volume; CO, cardiac output.bP< 0.05
vs baseline;cP< 0.05 vs PLR. Values are medians (25th to 75th interquartile
ranges).
Guinot et al. Critical Care 2011, 15:R216 http://ccforum.com/content/15/5/R216
(Figure 1); r2 = 0.70, P = 0.0001). This correlation was not observed for PO (r2 = 0.07, P = 0.79).
In the whole population, the AUCs were 0.88 ± 0.07 for ∆PLRSV (95% confidence interval (CI95): 0.69 to
0.97; P < 0.0001) and 0.87 ± 0.07 for ∆PLRCO (CI95:
0.67 to 0.97; P < 0.0001) (Figure 2). The ∆PLRCO and ∆PLRSV AUCs were not different (P = 0.66). ∆PLRPO had poor sensitivity and specificity, as well as a poor AUC: 0.53 ± 0.12 (CI95: 0.32 to 0.73; P = 0.79) (Figure
2). The ∆respPP AUC was 0.56 ± 0.12 (CI95: 0.35 to
0.77; P = 0.59) (Figure 2). The ∆PLRPP AUC was 0.62 ± 0.11 (CI95: 0.4 to 0.8; P = 0.31) (Figure 2). In ten
patients, CVP increased by ≥ 2 mmHg (six responders and four nonresponders). Among these patients, the AUCs were 0.83 ± 0.13 for ∆PLRSV (CI95: 0.48 to 0.98;
P = 0.012) and 0.83 ± 0.13 for ∆PLRCO (CI95: 0.48 to
Table 3 Comparison of extracorporeal membrane oxygenation parameters between responders and nonrespondersa
Parameters Responders (n = 13) Nonresponders (n = 12) P values
PO (L/minute) Baseline 4.70 (3.45 to 4.99) 4.25 (3.49 to 5.02) 0.91 PLR 4.76 (3.24 to 5.05) 4.23 (3.5 to 5) 0.83 Volume expansion 4.81 (3.36 to 5.14)b, c 4.20 (3.57 to 5.09) 0.97 PI (%) Baseline 0.95 (0.59 to 1.9) 0.78 (0.48 to 1.20) 0.35 PLR 0.68 (0.4 to 1)b 0.69 (0.45 to 1) 0.78 Volume expansion 0.62 (0.6 to 1.3)b, c 0.91 (0.54 to 1.1) 0.05 RPM 3950 (3078 to 4004) 3838 (3010 to 3966) 0.96 PO/RPM ratio (mL/RPM) Baseline 1.24 (1.07 to 1.31) 1.23 (1.11 to 1.32) 0.83 PLR 1.26 (1.03 to 1.33)b 1.23 (1.13 to 1.32) 0.62 Volume expansion 1.27 (1.06 to 1.32)b, c 1.25 (1.13 to 1.32) 0.68 PO/CO ratio (%) Baseline 66 (60 to 91) 75 (56 to 93) 0.7 PLR 60 (51 to 77)b 73 (62 to 105) 0.05 Volume expansion 54 (49 to 69)b, c 72 (55 to 100) 0.05
aPLR, passive leg raising; PO, pump outflow; PI, pulse index; RPM, rotations per minute; CO, cardiac output.bP< 0.05 vs baseline;cP< 0.05 vs PLR. Values are
medians (25th to 75th interquartile ranges).
Figure 1 Relation between changes in stroke volume induced by PLR (∆PLRSV) and changes in stroke volume induced by volume expansion (∆VESV).
Figure 2 Receiver operating characteristic curves
discriminating responders and nonresponders to volume expansion. ∆PLRSV, changes in stroke volume from baseline until after passive leg raising; ∆PLRPO, changes in pump outflow from baseline until after passive leg raising; ∆respPP, respiratory variation of pulse pressure at baseline; ∆PLRPP, changes in pulse pressure from baseline until after passive leg raising.
0.98; P = 0.012). Table 4 reports the different threshold values of ∆PLRSV and ∆PLRCO.
Discussion
Our study demonstrates that a 10% increase ∆PLRSV predicts a > 15% increase in SV after VE in ARDS patients placed on venovenous ECMO (Figure 3). ECMO is an efficient treatment for refractory ARDS [22]. No studies have assessed the usual dynamic parameters of preload reserve on ECMO-assisted patients, probably because of the complex interactions between the protec-tive mechanical ventilation and ECMO system on heart-lung interaction. As previously shown in the context of ARDS without ECMO support, neither ∆respPP nor ∆PLRPP predicts fluid responsiveness [8-10,12]. In two prospective studies, the poor predictive performance of ∆respPP has been attributed to insufficient changes in transpulmonary and pleural pressure [10,12], which are related to protective ventilation and altered pulmonary compliance. In addition, ∆respPP could reflect postload variation on right ventricular dysfunction and cannot be used as a predictor even in the presence of hypovolaemia [8,9,11]. Such clinical situations are frequent in the treat-ment of ECMO-assisted patients, which limit the use of such indices. ECMO patients with late ARDS were venti-lated with ‘ultraprotective’ ventilation because of altered compliance and a high incidence of acute cor pulmonale (Table 1). As ∆resp indices must be avoided because they fail to predict fluid responsiveness and fluid overload, fluid management may rely on a reversible and safe fluid challenge. Thus, we assessed predictive values of ∆PLR indices.
∆PLRPP cannot predict fluid responsiveness, even among patients with a minimal increase in CVP of 2 mmHg. On the basis of physiological knowledge, the use of PP as a substitute for SV would assume constant arter-ial compliance. By increasing intrathoracic blood volume, PLR may also induce sympathetic activation; however, our patients were deeply sedated, and their HRs
remained unchanged during PLR. In clinical practice, SV, PP and vascular tone can vary with the patient’s haemo-dynamic conditions and can be altered by PLR [28], which may have been the case in our present study.
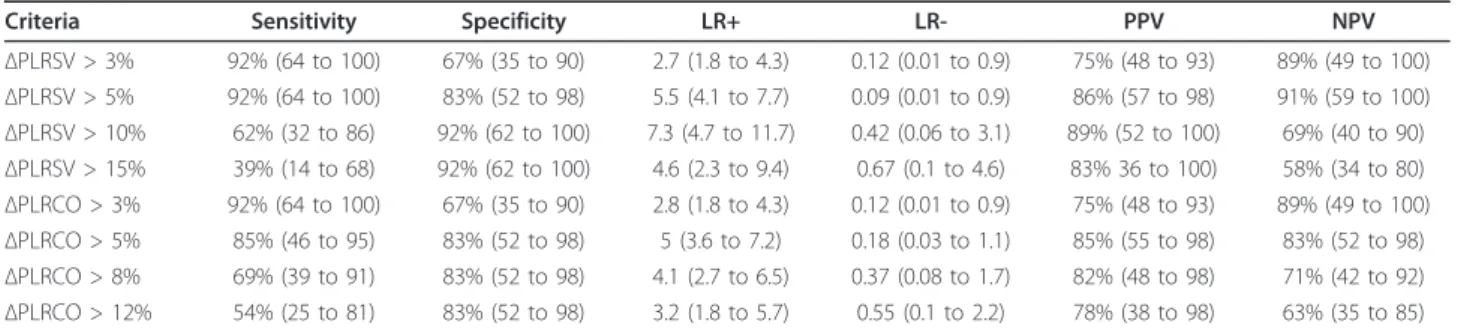
In this context, echocardiographic measurement of ∆PLRSV and ∆PLRCO may predict fluid responsiveness. The best threshold was 5% for ∆PLRSV, with 92% sensi-tivity (CI95: 64 to 100) and 83% specificity (CI95: 52 to
98), and 5% for ∆PLRCO, with 85% sensitivity (CI95: 46
to 95) and 83% specificity (CI95: 52 to 98) (Table 4).
The lower sensitivity of ∆PLRCO may be explained by the fact that CO is the product of SV and HR. In some responders, the VE-induced SV increase was associated with decreased HR (nonsignificantly). Whereas sensitiv-ity differed, the ∆PLRCO and ∆PLRSV AUCs were not statistically different. Taking into account echocardio-graphy, interindividual reproducibility and the fact that we wanted to avoid volume overloading, a threshold of 10% for ∆PLRSV was proposed, with 92% specificity and 62% sensitivity (Table 4 and Figure 3).
Although ECMO modifies the right-sided heart load condition and interferes with pulmonary artery circulation [20,23,24], it does not prevent an increase in venous return, as also reflected by increased CVP and persistent fluid responsiveness during PLR and after VE with sensitivity and specificity percentages comparable to values usually recorded in the ICU without ECMO [13-15,17]. One assumption might be that, in hypovolaemic patients, fluid expansion may load the ECMO pump first and alter VE (and ∆PLR predictive values), as patients’ SV may not increase. In four nonresponders, PO increased but SV also increased by > 10%. Moreover, ∆PLRSV were correlated with VE-induced SV variations, with values close to those recorded in the ICU among patients not being treated with ECMO [14]. Thus, in nonresponders, an increase in CVP without a change in CO and PO confirms an increase in right-sided preload and the fact that fluid expansion should not refill the ECMO system. Unlike Lakhal et al. [15], we found that the CVP measurement did not improve the
Table 4 Accuracy of stroke volume and cardiac output changes after passive leg raising to predict fluid responsivenessa
Criteria Sensitivity Specificity LR+ LR- PPV NPV
∆PLRSV > 3% 92% (64 to 100) 67% (35 to 90) 2.7 (1.8 to 4.3) 0.12 (0.01 to 0.9) 75% (48 to 93) 89% (49 to 100) ∆PLRSV > 5% 92% (64 to 100) 83% (52 to 98) 5.5 (4.1 to 7.7) 0.09 (0.01 to 0.9) 86% (57 to 98) 91% (59 to 100) ∆PLRSV > 10% 62% (32 to 86) 92% (62 to 100) 7.3 (4.7 to 11.7) 0.42 (0.06 to 3.1) 89% (52 to 100) 69% (40 to 90) ∆PLRSV > 15% 39% (14 to 68) 92% (62 to 100) 4.6 (2.3 to 9.4) 0.67 (0.1 to 4.6) 83% 36 to 100) 58% (34 to 80) ∆PLRCO > 3% 92% (64 to 100) 67% (35 to 90) 2.8 (1.8 to 4.3) 0.12 (0.01 to 0.9) 75% (48 to 93) 89% (49 to 100) ∆PLRCO > 5% 85% (46 to 95) 83% (52 to 98) 5 (3.6 to 7.2) 0.18 (0.03 to 1.1) 85% (55 to 98) 83% (52 to 98) ∆PLRCO > 8% 69% (39 to 91) 83% (52 to 98) 4.1 (2.7 to 6.5) 0.37 (0.08 to 1.7) 82% (48 to 98) 71% (42 to 92) ∆PLRCO > 12% 54% (25 to 81) 83% (52 to 98) 3.2 (1.8 to 5.7) 0.55 (0.1 to 2.2) 78% (38 to 98) 63% (35 to 85)
aLR+, positive likelihood ratio; LR-, negative likelihood ratio; PPV; positive predictive value; NPV, negative predictive value; ∆PLRSV, stroke volume increase from
baseline and after passive leg raising; ∆PLRCO, increase of cardiac output increase from baseline and after passive leg raising. Data are raw numbers and CI95
ranges.
Guinot et al. Critical Care 2011, 15:R216 http://ccforum.com/content/15/5/R216
accuracy of ∆PLR indices. CVP values should be analysed with caution, even if the mean CVP values increased with PLR and VE. Since the distal extremities of the ECMO canula and CVC are close, the CVP mean value may vary depending on measurement variations. In addition, this subgroup analysis was performed in only 10 patients.
Since venous return and pump venous injection are preload- and afterload-dependent processes, we assumed that ECMO parameters could demonstrate preload-dependent conditions. At baseline, the PO/RPM ratio, which may reflect PO adequacy to preload status, was not different between the two groups. PLR and VE increase PO and PO/RPM ratio and decreased PI only when the patient was preload-dependent, that is, only in responders (Table 3). Nevertheless, ∆PLRPO was not predictive of fluid responsiveness (Figure 2). Different mechanisms may explain this result. First, low variations in PO may have exposed ∆PLRPO to an insufficient sig-nal-to-noise ratio that was distorted by our method of calculating PO. Second, the afterload dependency of ECMO may alter PO. As we did not investigate ECMO afterload, we cannot link an increase in PO to an increase in ECMO preload and/or a decrease in ECMO afterload. Indeed, the present results confirm the cardiac dependence of the venovenous ECMO circuit. The venovenous ECMO circuit acts as a cardiac preload sen-sor (more than a volume sensen-sor). Nonetheless, for the reasons mentioned above, we have not demonstrated that ∆PLRPO is predictive of fluid responsiveness.
This study has a number of limitations. The small number of measurements may limit the interpretation of the results, but this number is comparable to the sample sizes of other published studies and the statistical
significance is sufficient [17]. The ∆PLRSV cutoff is close to ultrasonic interindividual reproducibility. This thresh-old is comparable to values usually recorded in the ICU [17,29] and is more than twice the values of inter- and intraindividual reproducibility. We assessed SV using TTE, which has been validated against the thermodilu-tion technique [30]. Thermodiluthermodilu-tion monitoring cannot be used because of recirculation phenomena [31], and preload reserve haemodynamic indices are not currently validated in this setting for the reasons described above. There were some concerns about the safety of PLR among ECMO patients. In our cohort, all patients under-went PLR without any adverse impact on the ECMO sys-tem. Before PLR, however, precautions were taken regarding the length of inflow and outflow cannulas.
Conclusions
In this study, a > 10% increase in ∆PLRSV was predic-tive of fluid responsiveness in patients placed on veno-venous ECMO respiratory assistance. This diagnostic procedure is easy to perform, reversible, familiar to intensive care physicians and easily reproducible, and it may be helpful in reliably identifying patients who will benefit from fluid loading. In contrast, we have not demonstrated that ∆PLRPO and ∆respPP can be used to predict volume responsiveness. Further studies of a larger sample of patients placed on various types of ECMO are necessary to assess these results.
Key messages
• Derivative pulse pressure indices (∆respPP and ∆PLRPP) failed to predict fluid responsiveness in ARDS patients placed on venovenous ECMO. • A > 10% increase of ∆PLRSV may predict fluid responsiveness in patients treated with venovenous ECMO.
• ∆PLRPO cannot be used to predict fluid responsiveness.
Abbreviations
ΔPLRPO: passive leg raising pump outflow change; ΔPLRPP: passive leg raising pulse pressure change; ΔPLRSV: passive leg raising stroke volume change; ΔrespPP: respiratory pulse pressure variation; ΔrespSV: respiratory stroke volume variation; ARDS: acute respiratory distress syndrome; CI95: 95%
confidence interval; CO: cardiac output; CVC: central venous catheter; CVP: central venous pressure; DAP: diastolic arterial pressure; ECMO:
extracorporeal membrane oxygenation; IRB: Institutional Review Board; LVEF: left ventricular ejection fraction; MAP: median arterial pressure; PI: pulse index; PO: pump outflow; PLR: passive leg raising; ROC: receiver operating characteristic; RPM: rotation per minute; SAP: systolic arterial pressure; SD: standard deviation; SV: stroke volume; TTE: transthoracic echocardiography; VE: volume expansion; VTIAo: aortic velocity-time integral ratio.
Acknowledgements
We thank Marie-Claude Guérin for reviewing the manuscript. We received no financial support for conducting this study. This study was approved by the Institutional Review Board of Amiens University Hospital.
Figure 3 Passive leg raising (PLR)-induced stroke volume (SV) increase in responders and nonresponders. ∆SV, stroke volume increase between baseline and PLR expressed as a percentage.
Author details
1Department of Anesthesiology and Critical Care, Amiens University Hospital,
Place Victor Pauchet, Amiens, F-80054, France.2Department of Cardiac
Surgery, Amiens University Hospital, Place Victor Pauchet, Amiens, F-80054, France.3INSERM, ERI12, Jules Verne University of Picardy, 12 rue des Louvels,
Amiens, F-80000, France. Authors’ contributions
PGG conceived, designed and coordinated the study and drafted the manuscript. EZ, MD and TC participated in the coordination of the study. MM, VH, LB and EB participated in the coordination of the study and helped in drafting the manuscript. HD performed the statistical analysis and helped in drafting the manuscript.
Competing interests
The authors declare that they have no competing interests. Received: 26 April 2011 Revised: 2 August 2011
Accepted: 18 September 2011 Published: 18 September 2011 References
1. Michard F, Teboul JL: Predicting fluid responsiveness in ICU patients: a critical analysis of the evidence. Chest 2002, 121:2000-2008.
2. Michard F, Boussat S, Chemla D, Anguel N, Mercat A, Lecarpentier Y, Richard C, Pinsky MR, Teboul JL: Relation between respiratory changes in arterial pulse pressure and fluid responsiveness in septic patients with acute circulatory failure. Am J Respir Crit Care Med. 2000, 162:134-138. 3. Reuter DA, Felbinger TW, Schmidt C, Kilger E, Goedje O, Lamm P, Goetz AE:
Stroke volume variations for assessment of cardiac responsiveness to volume loading in mechanically ventilated patients after cardiac surgery. Intensive Care Med 2002, 28:392-398.
4. Feissel M, Michard F, Mangin I, Ruyer O, Faller JP, Teboul JL: Respiratory changes in aortic blood velocity as an indicator of fluid responsiveness in ventilated patients with septic shock. Chest 2001, 119:867-873. 5. Michard F, Teboul JL: Using heart-lung interactions to assess fluid
responsiveness during mechanical ventilation. Crit Care 2000, 4:282-289. 6. National Heart, Blood Institute Acute Respiratory Stress Syndrome (ARDS)
Clinical Trials Network, Wiedemann HP, Wheeler AP, Bernard GR, Thompson BT, Hayden D, deBoisblanc B, Connors AF Jr, Hite RD, Harabin AL: Comparison of two fluid-management strategies in acute lung injury. N Engl J Med 2006, 354:2564-2575.
7. Jia X, Malhotra A, Saeed M, Mark RG, Talmor D: Risk factors for ARDS in patients receiving mechanical ventilation for > 48 h. Chest 2008, 133:853-861.
8. Mahjoub Y, Pila C, Friggeri A, Zogheib E, Lobjoie E, Tinturier F, Galy C, Slama M, Dupont H: Assessing fluid responsiveness in critically ill patients: false-positive pulse pressure variation is detected by Doppler echocardiographic evaluation of the right ventricle. Crit Care Med 2009, 37:2570-2575.
9. Daudel F, Tüller D, Krähenbühl S, Jakob SM, Takala J: Pulse pressure variation and volume responsiveness during acutely increased pulmonary artery pressure: an experimental study. Crit Care 2010, 14: R122.
10. De Backer D, Heenen S, Piagnerelli M, Koch M, Vincent JL: Pulse pressure variations to predict fluid responsiveness: influence of tidal volume. Intensive Care Med 2005, 31:517-523.
11. Daudel F, Tüller D, Krähenbühl S, Jakob SM, Takala J: Pulse pressure variation and volume responsiveness during acutely increased pulmonary artery pressure: an experimental study. Crit Care 2010, 14: R122.
12. Lakhal K, Ehrmann S, Benzekri-Lefèvre D, Runge I, Legras A, Dequin PF, Mercier E, Wolff M, Régnier B, Boulain T: Respiratory pulse pressure variation fails to predict fluid responsiveness in acute respiratory distress syndrome. Crit Care 2011, 15:R85.
13. Monnet X, Rienzo M, Osman D, Anguel N, Richard C, Pinsky MR, Teboul JL: Passive leg raising predicts fluid responsiveness in the critically ill. Crit Care Med 2006, 34:1402-1407.
14. Préau S, Saulnier F, Dewavrin F, Durocher A, Chagnon JL: Passive leg raising is predictive of fluid responsiveness in spontaneously breathing patients with severe sepsis or acute pancreatitis. Crit Care Med 2010, 38:819-825.
15. Lakhal K, Ehrmann S, Runge I, Benzekri-Lefèvre D, Legras A, Dequin PF, Mercier E, Wolff M, Régnier B, Boulain T: Central venous pressure measurements improve the accuracy of leg raising-induced change in pulse pressure to predict fluid responsiveness. Intensive Care Med 2010, 36:940-948.
16. Jabot J, Teboul JL, Richard C, Monnet X: Passive leg raising for predicting fluid responsiveness: importance of the postural change. Intensive Care Med 2009, 35:85-90.
17. Cavallaro F, Sandroni C, Marano C, La Torre G, Mannocci A, De Waure C, Bello G, Maviglia R, Antonelli M: Diagnostic accuracy of passive leg raising for prediction of fluid responsiveness in adults: systematic review and meta-analysis of clinical studies. Intensive Care Med 2010, 36:1475-1483. 18. Esan A, Hess DR, Raoof S, George L, Sessler CN: Severe hypoxemic
respiratory failure: Part 1. Ventilatory strategies. Chest 2010, 137:1203-1216.
19. Raoof S, Goulet K, Esan A, Hess DR, Sessler CN: Severe hypoxemic respiratory failure: Part 2. Nonventilatory strategies. Chest 2010, 137:1437-1448.
20. Marasco SF, Lukas G, McDonald M, McMillan J, Ihle B: Review of ECMO (extra corporeal membrane oxygenation) support in critically ill adult patients. Heart Lung Circ 2008, 17(Suppl 4):S41-S47.
21. Iglesias M, Martinez E, Badia JR, Macchiarini P: Extrapulmonary ventilation for unresponsive severe acute respiratory distress syndrome after pulmonary resection. Ann Thorac Surg 2008, 85:237-244.
22. Davies A, Jones D, Bailey M, Beca J, Bellomo R, Blackwell N, Forrest P, Gattas D, Granger E, Herkes R, Jackson A, McGuinness S, Nair P, Pellegrino V, Pettilä V, Plunkett B, Pye R, Torzillo P, Webb S, Wilson M, Ziegenfuss M: Extracorporeal membrane oxygenation for 2009 influenza A(H1N1) acute respiratory distress syndrome. JAMA 2009, 302:1888-1895.
23. Larsson M, Talving P, Palmér K, Frenckner B, Riddez L, Broomé M: Experimental extracorporeal membrane oxygenation reduces central venous pressure: an adjunct to control of venous hemorrhage. Perfusion 2010, 25:217-223.
24. Germann P, Balassa A, Roeder G, Kaider A, Schlag G, Zimpfer M, Sladen R: Effects of inhaled nitric oxide and extracorporeal membrane
oxygenation on pulmonary hemodynamics and lymph flow in oleic acid lung injury in sheep. Crit Care Med 1997, 25:1881-1887.
25. Sidebotham D, McGeorge A, McGuinness S, Edwards M, Willcox T, Beca J: Extracorporeal membrane oxygenation for treating severe cardiac and respiratory failure in adults: Part 2. Technical considerations. J Cardiothorac Vasc Anesth 2010, 24:164-172.
26. Grimes DA, Schulz KF: Refining clinical diagnosis with likelihood ratios. Lancet 2005, 365:1500-1505.
27. Vieillard-Baron A: Assessment of right ventricular function. Curr Opin Crit Care 2009, 15:254-260.
28. Monnet X, Osman D, Ridel C, Lamia B, Richard C, Teboul JL: Predicting volume responsiveness by using the end-expiratory occlusion in mechanically ventilated intensive care unit patients. Crit Care Med 2009, 37:951-956.
29. Lamia B, Ochagavia A, Monnet X, Chemla D, Richard C, Teboul JL: Echocardiographic prediction of volume responsiveness in critically ill patients with spontaneously breathing activity. Intensive Care Med 2007, 33:1125-1132.
30. Huntsman LL, Stewart DK, Barnes SR, Franklin SB, Colocousis JS, Hessel EA: Noninvasive Doppler determination of cardiac output in man: clinical validation. Circulation 1983, 67:593-602.
31. Haller M, Zöllner C, Manert W, Briegel J, Kilger E, Polasek J, Hummel T, Forst H, Peter K: Thermodilution cardiac output may be incorrect in patients on venovenous extracorporeal lung assist. Am J Respir Crit Care Med 1995, 152:1812-1817.
doi:10.1186/cc10451
Cite this article as: Guinot et al.: Passive leg raising can predict fluid responsiveness in patients placed on venovenous extracorporeal membrane oxygenation. Critical Care 2011 15:R216.
Guinot et al. Critical Care 2011, 15:R216 http://ccforum.com/content/15/5/R216