Publisher’s version / Version de l'éditeur:
ASTM Special Technical Publication, 293, pp. 14-26, 1961-08-01
READ THESE TERMS AND CONDITIONS CAREFULLY BEFORE USING THIS WEBSITE.
https://nrc-publications.canada.ca/eng/copyright
Vous avez des questions? Nous pouvons vous aider. Pour communiquer directement avec un auteur, consultez la
première page de la revue dans laquelle son article a été publié afin de trouver ses coordonnées. Si vous n’arrivez pas à les repérer, communiquez avec nous à PublicationsArchive-ArchivesPublications@nrc-cnrc.gc.ca.
Questions? Contact the NRC Publications Archive team at
PublicationsArchive-ArchivesPublications@nrc-cnrc.gc.ca. If you wish to email the authors directly, please see the first page of the publication for their contact information.
NRC Publications Archive
Archives des publications du CNRC
This publication could be one of several versions: author’s original, accepted manuscript or the publisher’s version. / La version de cette publication peut être l’une des suivantes : la version prépublication de l’auteur, la version acceptée du manuscrit ou la version de l’éditeur.
Access and use of this website and the material on it are subject to the Terms and Conditions set forth at
Design and calibration of a neutron moisture meter
Burn, K. N.
https://publications-cnrc.canada.ca/fra/droits
L’accès à ce site Web et l’utilisation de son contenu sont assujettis aux conditions présentées dans le site LISEZ CES CONDITIONS ATTENTIVEMENT AVANT D’UTILISER CE SITE WEB.
NRC Publications Record / Notice d'Archives des publications de CNRC:
https://nrc-publications.canada.ca/eng/view/object/?id=f53ec7b9-e87a-43c1-af14-0d38b4a95183 https://publications-cnrc.canada.ca/fra/voir/objet/?id=f53ec7b9-e87a-43c1-af14-0d38b4a95183
S
er
TH1
N21r2
no.
129
c .
2
NATIONAL
RESEARCH
COUNCIL
C A N A D A
DIVISION OF BUILDING RESEARCH
DESIGN AND CALIBRATION OF A NEUTRON MOISTURE METER
BY
K. N. B U R N
REPRINTED FROM
AMERICAN SOCIETY FOR TESTING MATERIALS SPECIAL TECHNICAL PUBLICATION NO. 2 9 3 . 1 9 6 0 . P. 1 4 . 26
R E S E A R C H P A P E R N O . 129 OF THE
DIVISION OF BUILDING RESEARCH
OTTAWA AUGUST 1961
T h i s publication i s being d i s t r i b u t e d by the Division of Building R e s e a r c h of the National R e s e a r c h Council. It should not be r e p r o d u c e d i n whole o r in p a r t , without p e r m i s
-
s i o n of the o r i g i n a l p u b l i s h e r . The Division would be glad to be of a s s i s t a n c e i n obtaining s u c h p e r m i s s i o n .Publications of the Division of Building R e s e a r c h m a y be obtained by mailing the a p p r o p r i a t e r e m i t t a n c e , ( a Bank, E x p r e s s , o r P o s t Office Maney O r d e r o r a cheque m a d e pay- able at p a r i n Ottawa, to the R e c e i v e r G e n e r a l of Canada, c r e d i t National R e s e a r c h Council) to the National R e s e a r c h Council, Ottawa. S t a m p s a r e not a c c e p t a b l e .
A coupon s y s t e m has been introduced to m a k e pay- m e n t s for publications r e l a t i v e l y s i m p l e . Caupons a r e avail- able in denominations of 5, 2 5 and 50 c e n t s , and m a y be ob- tained by m a k i n g a r e m i t t a n c e a s indicated above. T h e s e coupons m a y be u s e d f o r the p u r c h a s e of a l l National R e s e a r c h Council publications including specifications of the Canadian Government Specifications B o a r d .
Authorized Reprint from the Copyrighted
Symposium on Kuclear XIethods for Measuring Soil Density a n d hloisture
Special Techlrical P~lblicaliotr N o . Z93
Published by the
AMERICAN SOCIETY F O R TESTING MI\TERII\LS
1960
DESIGN A N D CALIBRATION O F A N E U T R O N MOISTURE M E T E R
A probe using an actinium-beryllium neutron source and a scintillation-type detector was designed and built for use in determining the moisture density in
soils below the surface of the ground. A portable battery-operated scaler was selected to make it possible to use the equipment in places where there is no available a-c supply.
Since the principle of the neutron moisture meter is based upon the physical interaction of neutrons with hydrogen atoms, considerable thought was given to the idea of calibrating the instrument in media other than actual soils; the advantages of using substitute materials are better uniformity and better con- trol of both bulk density and distribution of hydrogen atoms.
Requirements of the artificial media are discussed and those adopted for cal- ibration are described.
A number of techniques employing tures and pressures, and finally the radioactivity have been developed for neutrons are captured by the nuclei of determining the density of moisture in
soils and other similar materials. I n prin- ciple, these utilize the scattering of neutrons from a radioactive source and t h e detection of the moderating effect of the moisture in t h e material on the neutron flux. T h e various techniques differ only in the means used to detect the moderated neutron flux.
T h e predominant process that occurs when high-energy neutrons are scattered into a medium is a loss of velocitv of each neutron as it collides with the nuclei of the atoms of the medium. Even- tually, through loss of kinetic energy, the neutron velocities are reduced to those encountered in gases a t normal tempera-
'
Research Officer, Division of Building Rc- search. National Research Council, Ottawa, Canada.the medium.
he
rate a t which this slow- ing down process occurs depends upon:(1) t h e mass of the nucleus in collision with t h e neutron, and (2) t h e probability that t h e two will collide.
T h e mass of the hydrogen nucleus is nearly equal to the neutron mass. Colli- sion with hydrogen atoms therefore reduces the kinetic energy a n d hence the velocity of neutrons more quickly t h a n would collision with heavier nuclei. T h e large difference between the masses of hydrogen atoms and those normally en- countered i n soils means t h a t the rela- tive effectiveness of hydrogen atoms in slowing down neutrons is very pro- nounced.
T h e probability t h a t a neutron will collide with the nucleus of a n atom is dependent on the atom's scattering cross-section. For most elements, this value is low, usually increasing with de- crease in neutron energy. T h e scattering
cross-section of the hydrogen atom for high-energy neutrons, however, is larger than that for most of the other atoms present in soils.
These two features in combination make hydrogen the most effective me- dium for reducing the velocity of emis- sion neutrons. If a detector of thermal (slow) neutrons is placed near a neutron
have had limited success because of one or two unknown parameters (1-3).~
I n order to present the readings in the usual form (per cent water by weight), it is necessary to know the bulk density of the medium. A companion density meter, which operates on modification of flux from a gamma source, is nearly always used.
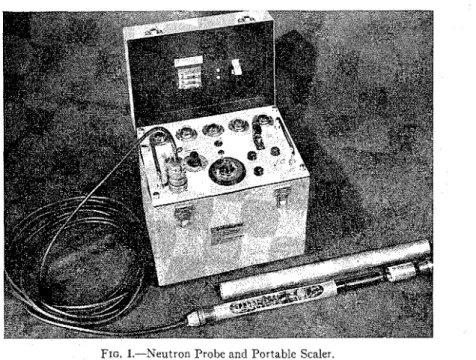
FIG. 1.-Neutron Probe and Portable Scaler.
source in a medium containing hydrogen, DESCRIPTION OF THE
the activitv registered is due almost en-
-
-
NEUTRON METER tirely to neutrons that have been sloweddown by hydrogen atoms. Other atoms T h e neutron moisture meter used by present in a medium such as soil play a the Division of Building Research con- negligible part in this process. I n natural sists of a probe using a neutron source soils, hydrogen may be present in sev- and a scintillation-type detector con- era1 forms, but, with some exceptions, i t nected to a portable battery-operated occurs principally in the water held by scaler (Fig. 1). The probe was designed the soil particles. Therefore, the "slow to slip freely through a n aluminum ac- neutron" activity registered by a suitable cess tube which has a n outside diameter of 1% in. and a wall thickness of in. detector can be related to the concentra-
tion of water in a soil medium by calibra- (Fig. 2). At the lower end is a source of Attempts to calcu'ate the
? The boldface numbers in parentheses refer
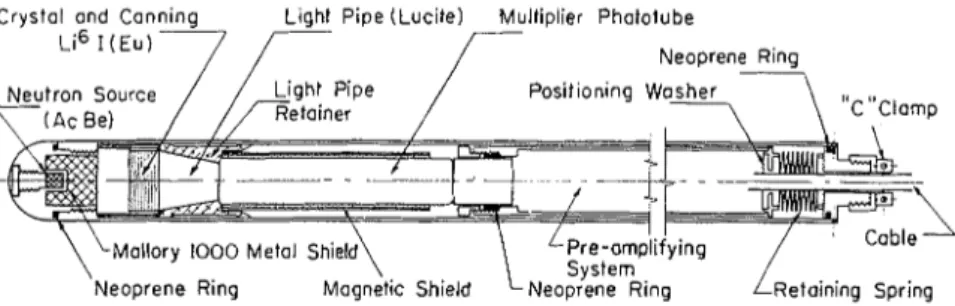
fast neutrons in the form of a mixture of actinium and beryllium which emits ap- proximately lo5 neutrons per sec. Direct radiation from the source to the detector crystal is prevented by a small shield of Mallory 1000 metal-an alloy of tung- sten, nickel, and copper having a specific gravity of 16.9. A scintillation crystal with as large a diameter as possible was needed, and of three types that were tried a Li61 (europium-activated) crystal was chosen because of its superior count- ing characteristics (Fig. 3). The largest multiplier phototube available that could be fitted into the shell of the probe was
one with a window diameter of
2
in. I t was necessary therefore to place between the scintillation crystal and the window of the photomultiplier tube a Lucite light pipe enclosed in a polished metal section to funnel the light activity from the one to the other. A preamplifier was added to obtain a suitable signal to drive this scaler through a 27-ft cable.A retaining spring was provided to hold the components in contact with one another. Some annoying instability oc- curred before it was found that even the slightest movements of the probe would cause relative shifting of the parts, thus
Crystal and Canning Light Pipe (Lucite) Multiplier Phatotube
FIG. 2.-Neutron Moisture Probe (Scintillator Type).
affecting the readings significantly. After two or three trials a suitable spring was found.
The nuclear physics involved when slow neutrons strike a crystal is described in detail by Roy and Winterkorn (4). I t is sufficient to say that the incident neutron reacts with lithium-6 to form an alpha particle and an atom of tritium, with a combined energy of 4.8 Mev. Each event produces a light pulse which is detected by the photomultiplier and converted to an electrical impulse. These are amplified and counted by the scaler. The portable scaler, either a-c or bat- tery-operated, was manufactured by Nuclear-Chicago Corp. (Model 2800). The automatic timing device was found
Voltage to be less accurate than was required, so
FIG. 3.-Probe Counting Characteristics for
a stop watch was used to time the period
Neutron Meter with a Li61 (Europium-Acti-
of the probe and plotting this against measured activity, a curve was obtained that indicated a rapid increase in read- ings toward a certain point followed by a rapid drop. This curve was symmetrical in shape so it was assumed that the point of maximum activity was reached when the probe was centered a t the mid-depth of the layer of wax (Fig. 5).
Although the ultimate aim in con- - FIG. 4.-Determination of Activity in the Wax strutting a neutron moisture meter is to
Standard. measure the water contents of natural
-- Center Line Wox Slob
Activity. counts per min FIG. 5.-Determination of Center of Activity of Neutron Moisture Meter.
was added to make it possible to set and soils, calibration in situ presents many measure the input voltage to the neutron difficulties. The determination of mois- probe and the density probe. I t was ture content from field borings is not suf- found that adjustment of voltage using ficiently accurate to use as a standard the coarse indicator on the voltage con- against which to calibrate. There is no trol alone was not sufficiently accurate control over moisture content in the for calibration (Fig. 4). field, and i t is impossible, therefore, to T o determine the center of maximum reproduce results. Moisture contents of activity of the probe, a small drum of natural soils vary so randomly with dried sand was prepared in which a 14-in. depth that it would be extremely diffi- thick slab of petroleum wax was placed cult to state what moisture content was a t a known depth below the rim of the being "sampled" by a neutron moisture drum. By varying the vertical position meter. Since complete control of all im-
18 NUCLEAR N/IETHODS FOR SOIL DENSITY AND MOISTURE
portant parameters is necessary for ac- curate calibration, i t was decided that this must be undertaken in the labora- tory.
Bouitdary Corzditions for Laboratory Cali- brat ioit:
Workers in this field have been able to calibrate the neutron meter in the labora- tory by using a suitable medium in oil drums of standard 55-gal (U.S.) capacity, which measure about 23 in. in diameter and 36 in. in height. Experiments have shown that for the usual range of bulk densities of soils, the diameter of sample actually involved in the action described depends only upon the hydrogen density. The maximum diameter "sampled" by a neutron-measuring device a t the lowest moisture contents generally encountered in soils is about 2 ft. This diminishes rapidly to 15 in. with only a slight in- crease in moisture content (5). Thus, an oil drum of this size filled with soil serves as a sample of infinite extent so far as this measuring technique is concerned. All of the drums used in this calibration
I were first coated on the inside with a
zinc suspension to reduce the formation of rust.
Use of Nafural Soil Material:
Natural soil was the first medium to be considered since it is so readily avail- able. For calibration purposes, however, it has several disadvantages. Uniform mixing of soil and water is very difficult, especially with clays. The use of sand makes mising easier, but very high mois- ture contents cannot be attained without movement of water under gravity. Even if the mixture of soil and water could be accomplished in a satisfactory manner, difficulties in placing and in control of density would occur. Total weights and volumes might be reproduced within satisfactory limits, but densities of layers may vary appreciably.
Reqzbirements o f Arlijcial Materials:
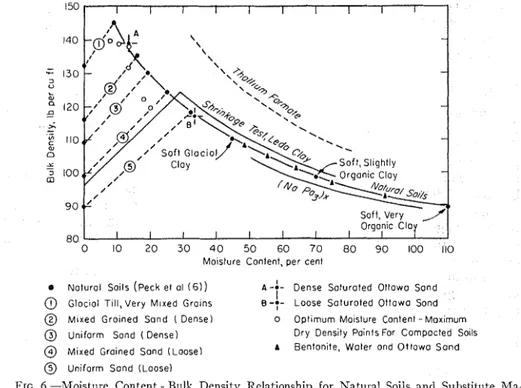
Fortunately, the neutron technique measures the relative occurrence of hy- drogen atoms, not of water molecules; therefore, for calibration purposes hy- drogen atoms in some other form can be substituted for hydrogen atoms in water. In fact, even the solid portion of the soil and the oxygen atoms associated with the hydrogen atoms in the water mole- cules can be replaced by any other ma- terial provided the scatter geometry of neutrons is not seriously affected. This will not occur so long as the simulated mass of the medium does not differ sig- nificantly from that of natural soils with the only variation being introduced by the addition of hydrogen atoms (6) (Fig.
5 ) .
Some elements not only act as targets for the elastic rebound of neutrons but also capture and absorb neutrons to be- come induced radioactive isotopes. The presence of such elements takes a cer- tain percentage of neutrons out of play, thus causing an erroneously low reading of thermal-neutron activity. Among the elements to be avoided are boron, iron, and the abundant halogen group.
Since atoms of small mass are more effective in slowing down neutrons than those of large mass, their use should also be avoided. Elements whose atomic weights range between that of hydrogen and those of the lightest elements usually encountered in soils (that is, oxygen, aluminum, and silicon) should not be used. Finally, the inherent accuracy of the neutron technique is much higher than the oven-drying method of de- termining water contents; therefore to calibrate the first against the second simply adds errors. If the hydrogen den- sity of the material can be calculated from its specific gravity and its chemical formula, provided this is accurately known, a much more reliable calibration point can be obtained.
Use of Gaseozts Mixtures:
After initial consideratioil a mixture of hydrogellous and nonhydrogenous gases appeared to be an ideal way of providing uniform and adjustable hydrogen densi- ties. The problems of placing, homo- geneity, and density control would not exist. Further coilsideration revealed
(or one containing only a very stnall per- centage of hydrogen atoms) with a density of about 2 g per cu cm. To this could be added a hydrogenous liquid with a density of about 1 g per cu cm. With this combination, it would have been possible to follow the normal den- sity to moisture content relationship of
- - - - Organic Clay 8 0 I I t I I I I 0 10 2 0 3 0 4 0 5 0 6 0 70 8 0 9 0 I 0 0 110 Moisture Content, per cenl
0 Nolurol Soils (peck el ol ( 6 1 ) A-:- Dense Soturoted Ottowo Sond
@ Gloclol TIII, Very M ~ x e d G r o ~ n s B - 7 - I Loose Soturoted Ottowo Sond
@ Mixed Groined Sand ( Dense) 0 Optimum Moislure Content - Max~mum
@ U n ~ f o r m Sond ( D e n s e l Dry Dens~ty Po~nts For Compacted Solls
@ Mixed Grolned Sand (Loose) A Benton~te, Woler ond Ottawo Sond
@ Uniform Sond (Loose)
FIG. 6.-Moisture Content - Bulk Density Relationship for Natural Soils and Substitute 1Ma- tcrials.
that for the simulated inoisture content natural soils (Fig. 6) by selecting two range required, gases were unacceptable liquids and mixing them in various pro- because of their low bulk densities. Cal- portions.
culations also showed that for even the low end of the range the required hydro- gen density could not be obtained by the use of gaseous compounds without re- sorting to escessively high pressures. Use of Liquids:
Recognitioil of the density requirement led next to consideration of the possibil- ity of finding a nonhydrogenous liquid
Heavy liquids such as those used in laboratory studies to separate ores by flotation were investigated but were found to be prohibitive in cost. Also their densities were too high and they had the added disadvantages of containing some halogen element or of being toxic (Fig. 6) (thallium formate). The tables of physi- cal constants of organic and inorganic compounds in the Handbook of Chem-
istry and Physics were searched but it was found that the liquids with the re- quired high density contained either a halogen or some other unsuitable ele- ment, and a combination with the ap- propriate density range could not be found.
Fluids comprised only of organic com- pounds, such as petroleum products, were also considered, but their low bulk density and high concentration of hy- drogen made them unsuitable for the desired range.
Use of Solids:
Solids with low melting temperatures would be suitable as calibration media since the material could be poured into place before solidifying. This type of medium would be ideal in that it could be kept indefinitely as a calibration men con- standard without loss of hydro,
tent or change in bulk density. The bulk densities of these materials, however, are about 60 lb per cu ft and the hydrogen concentration about three fourths that of water, giving relationships consider- ably removed from those of natural soils.
Use of Laminated Solids:
Interlayering of hydrogenous and non- hydrogenous films was considered. The cutting and stacking of thin disks in different combinations to produce vari- ous hydrogen densities seemed a tedious arrangement that might better be ac- complished by rolling different film combinations onto an access tube. Many plastic films are now available, and metal foils, such as aluminum, could be used to provide the required bulk density. This would probably set up a directional geometry in the medium, however, and the idea was dismissed since the neutron flux might be distorted and therefore not representative of natural soils.
Use of Solid Mixtures:
The next step was to consider mixtures of hydrogenous and nonhydrogenous solids, even though this introduced t h e accompanying problems of mixing, plac- ing, and density control. Uniform mixing of different particles is possible only through prolonged agitation of a mix, but this presents no great difficulty, re- quiring only time and suitable equip- ment. When a material comprised of particles of different density and size is removed from where it was mixed and is then weighed and placed in some other container, segregation will always occur to some degree. Spherical particles of uniform size could be used to minimize this effect, and from this the maximum range in densities could be calculated.
Several possibilities of using sand-size particles were considered. Large sizes were thought to be unsuitable because they might have the effect of concentrat- ing hydrogenous and nonhydrogenous particles in distinctly separate pockets, and thus introduce a scatter geometry different from that in natural soils. With this size stipulation the following combi- nations were considered:
1. Mixtures of hydrogenous spheres with nonhydrogenous spheres to give a fairly complete range of hydrogen densi- ties.
2. A medium consisting of nonhy- drogenous spheres coated uniformly with some hydrogenous material. Film thick- ness could be modified to vary hydrogen density over the lower range of natural soil moisture densities.
3. Spheres of material of lower hy- drogen "concentration" than that of water, a t various compacted densities for the higher range of natural soil mois- ture densities.
4. A combination of the above meth- ods to give required equivalent moisture densities.
Nonhydrogenous spheres (approxi- mately) of the correct density are avail- able in the form of sorted Ottawa sand. (Glass spheres are also available but be- cause the material generally contains small proportions of boron it is unsuit- able.) Suitable hydrogenous spheres are not readily available and coating spheres with a hydrogenous material might re- quire the development of elaborate equipment and techniques. The first two possible combinations were therefore dis- carded.
The third technique was used by the author in a previous calibration of a foil- type probe. Various mixtures of well- graded sand and powdered dextrose were used with very small quantities of water. Considerable difficulty was experienced in mixing and placing, and uniformity of density was probably not attained sincc compaction was done with a hand tam- per.
Use of Solid-Liquid Suspensions:
Another possible way to prepare a suitable calibration medium is to com- bine a solid and a liquid. With proper agitation and circulation, the problem of homogeneity would be solved, but this operation would involve ancillary equip- ment so this idea was discarded.
Two suspensions used in commercial separation of ores by flotation are known. One is unsuitable because i t contains iron which has a high absorption cross- section for neutrons; the other contains galena (lead sulfide) and gives a range of densities much higher than those in natural soils for the same moisture con- tents.
specific gravity were soluble only in very small proportions. T h e most suitable solute that could be found was sodium hexametaphosphate (NaP03)z, commer- cially available as Calgon, which permits a maximum concentration equivalent to a minimum moisture content of 50 per cent, a point a t about the center of the required range (Fig. 6).
Use of Saluraled Solid-Liquid Mizlures: An obvious combination for the lower end of the range was a saturated mixture of well-defined sand and water. This is equivalent t o a natural soil medium be- low the groundwater table. Difficulties of placing and of achieving homogeneity were problems which i t was hoped could be overcome by sedimenting sand into water in a suitable manner and then by vibrating to make the medium more
-
dense, for further points a t lower water contents.The void ratios for the maximum and minimum packing are known for spher- ical particles of uniform size. These would be equivalent to water contents of 13.2 and 33.3 per cent respectively for satur- ated mixtures of Ottawa sand, but t h e practical possibility of obtaining the two extreme conditions is small, and the range of water contents would be con- siderably reduced within these theoreti- cal limits.
Because of the difficulties already dis- cussed, i t was necessary to calibrate with other than the ideal media mentioned. Four different mixtures were used. Use of Solid-Liquid Soll~lions: Ollawa Sand and Water:
Several possibilities of mixing soluble The sedimentation of wet sand in wa- solids and liquids were investigated. No ter proved to be extremely difficult. combination was found that gave a com- Hand sprinkling it into a barrel of water plete range of equivalent moisture con- produced erratic surfaces and densities. tents, and many compounds of the right T o overcome this a brass screen with
openings slightly larger than the sand particles was made to fit across the top of the drum on to which wet sand was spread and troweled through. This was a n extremely slow process, and the idea of using pre-wetted sand was abandoned although there were two advantages to the method, which were incorporated in the next step: (1) more uniform distribu-
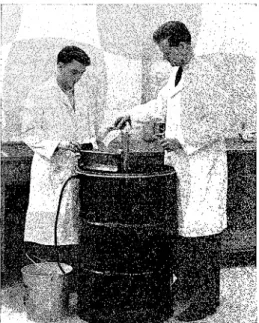
FIG. 7.-Apparatus for Preparation of Sedi- mented Sand Samples.
tion of sand, and (2) more uniform level of energy of particles entering the sur- face of the water.
Figure
7
shows the apparatus that was finally used which produced quite uni- form results. I t consists of a small trough divided into five sections, pivoted on the access tube in the center of the drum and riding around the rim of the drum on a ring made from sheet metal. The access tube was centered by screws on a hub connected by four spokes to the outside track. The entrant velocity of the particles was reduced as much as possible by lowering the distributing ap-paratus until the opening a t the bottom of the trough was no more than
4
in. above the water surface. Distribution was by hand; one person rotated the equipment slowly while the other fed sand into the various compartments in the required proportions. Scoopfuls of dry sand were kept as uniform in weight as possible by using a straightedge to strike off excess from a n even rim. Weights of sand proportional to the area covered by each compartment produced a sand surface that was fairly uniform, but it was always necessary to add a little more in certain compartments to raise the sand beneath them to the same level as the rest.Thickness of the layers was determined by measuring the distance from the rim of the drum to the surface of the sand a t various locations using a wooden dowel fitted with a small foot at the lower end. All readings were made to %LO- in., and
distribution was continued until these agreed within 0.4 in. for any one layer. The total volume of each layer was then calculated, and from the weight of the sand added and its specific gravity the volume and weight of water were de- termined.
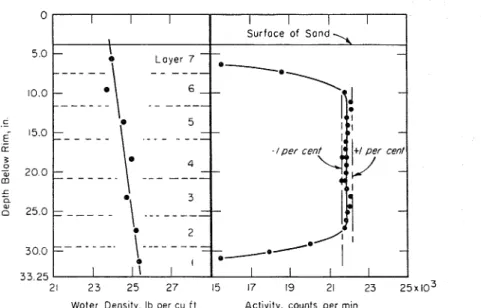
Two such samples were prepared; the result of these calculations for one of the samples is shown in Fig. 8. The water density appears to increase with depth a little over 1 lb per cu f t from top to bot- tom. Determination of activity with the neutron meter a t various depths, how- ever, indicated more uniform distribu- tion than that calculated.
After obtaining initial measurements on loose sand, the samples were com- pacted using a gasoline-driven immer- sion-type concrete vibrator. I t was first applied to the exterior of each drum fol- lowing a uniform pattern both in position and time interval. During the beginning of this stage it became obvious that air had been entrapped during the sedi-
menting of the dry sand. The sample in one of the drums released only a very small amount of air, but the amount that escaped from the second drum was ap- preciable. Although volume reduction was slight after vibration, further cali- bration points were determined for these samples. Further compaction was ac- complished by immersing the vibrator directly in the mixtures and, assuming
Calgon and Waier:
Commercially available Calgon wed as water softener is about 94 per cent so- dium hexametaphosphate (NaPOJz. The remainder is sodium carbonate which is added to adjust the pH. Because this additive causes some effervescence when combined with water, producing suds, the pure unadjusted sodium hexameta- phosphate was used. To facilitate mixing,
0 I I I I I I I Surface of Sand
.,,
I - - - - - - - - - - - - . - - - 21 2 3 25 2 7 15 17 19 21 23 2 5 x 1 0 ~ Woler Dens~ty. Ib per cu i t Activity, counts per minFIG. 8.-Sedimented Sand and Water.
uniform densities, two more calibration points were obtained. Unfortunately, this treatment resulted in water densities of about 20 lb per cu f t when less than 15 lb per cu ft had been expected.
Another point on the curve was ob- tained by hand compacting damp sand into the drum. Sand and water were well mixed on a concrete floor and then weighed into a drum in carefully com- pacted layers. The thickness of each layer was measured as before and the water density determined by the oven drying method.
it was obtained in fine powdered form. Mixing became increasingly difficult as the concentratioil increased. Three elec- tric stirrers were used to keep the mix well agitated and to draw the powder down from the surface without causing it to lump or to clraw in air. Several den- sity determinations mere made for each sample and they agreed very closely.
Actual water contents were determined by chemical analysis. This involved di- luting the mixture in a solvent and then measuring by titration the amount of phosphorus in the solution. From this, the amount of sodium hexametaphos-
phate by weight was determined, the balance being water.
Although two points were obtained which appear to be in practically the right positions with the calibration curve, the mixture was not completely satisfactory. In the first place, the mix- tures were not perfect solutions but were in fact partly suspensions. In the speci- mens taken from the first mixture, a settling out of this suspended material became evident in three or four days.
Bentonite, TVater and Ottawa Satzd: The search for some other material for calibration led to the mixing of bentonite and water, a t a moisture content of about 1000 per cent by weight, to which Ottawa sand was added in increasing amounts. The liquid limit of bentonite is about 640 per cent and its stiffness limit well above 1000 per cent. The mixture was therefore in the thixotropic range. This property made i t possible to agitate
I I I I I I I I I I
- A Sedirnented Ottawa Sand -
Bentonite, Ottawa Sand and Waler
0 Calgan a n d Water
-
- PO. 1 lb per cu /I 24.4 4 - 35.4 I - --
-
-
A --
1 1 I I I I I I I I Activity, counts per rninFIG. 9.-Profiles of Slow Neutron Activity for Calibration Samples.
Readings with the neutron meter were obtained on the day of mixing and the day following, but settling out of undis- solved Calgon might have been signifi- cant. In the second mixture, this prob- ably was not very important because of its very high viscosity. I t had also been impossible to avoid trapping some air while stirring, and when mixing was complete the air bubbles slowly made their way to the surface. This condition would cause a small error in the de- termination of water densities, erring on the high side.
the gelled material, mix in a quantity of sand, and then allow the whole mixture to set up again. These proportions of bentonite and water permitted no settle- ment of sand even in the thinnest mixes and, because the mixture was a liquid when agitated, it was possible to pour it into glass dishes to determine the densi- ties in the same way as that used for the Calgon-water mixtures. This combina- tion of materials made it possible to prepare samples with water densities from 58.2 to 30 lb per cu ft. The water contents were determined by oven-dry-
ing the sample and correcting for the small proportion of chemically held water in the bentonite, the amount of which was determined by subjecting oven-dried samples to further drying at 1000 C.
The correction for this series of cali- bration points was about lb per cu f t throughout since the ratio of bentonite to water remained fairly constant.
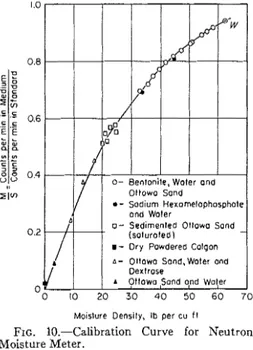
0 - Sedirnenled Oltawa Sand (sofuratedl
I - Dry Powdered Calgan A - Oltowo Sond.Woter and
Dextrose
A Ottawa Sond and Wo(er 0
0 10 2 0 3 0 4 0 5 0 6 0 7 0 Malsture Densily, Ib per cu f l
FIG. 10.-Calibration Curve for Neutron
Moisture Meter.
Dextrose and Ottawa Sand:
To obtain other points on the calibra- tion curve between 5 and 20 lb per cu ft, two samples were prepared by mixing to- gether, in a small mechanical mixer, quantities of damp Ottawa sand (water content about 2 per cent) and powdered dextrose. Dextrose contains fewer hy- drogen atoms on a weight basis than water in the ratio of 1 to 1.665, so equivalent water contents are easily de- termined. I t was necessary, of course, to resort to placing the mixture in layers and compacting to obtain a required density.
A 2;-gal pail was prepared as a stand- ard by filling i t with petroleum wax, in the center of which was placed a short section of aluminum access tube. Readings of activity in this standard were obtained both before and after taking readings in each calibration sample.
A profile of activity was obtained for each sample by taking readings at least a t every 2 in, of depth, for a period of 5 min or more (Fig. 9). Any readings that appeared to be erratic were repeated. Those that fall along the straight section of the curve-that is, those not influ- enced by the upper and lower limits of the sample--were averaged. The calibra- tion curve shows the ratio of the average reading in the medium to the average reading in the standard in relation to the moisture density in pounds per cubic foot (Fig. 10). One point was obtained for a moisture density of zero in a drum filled with dry powdered Calgon.
The probe was placed in the drum of Calgon and water on six different days and profiles of activity determined. From these were determined the ratios of counts in the medium to counts in the standard. The first was taken in mid- December, 1959, the ratio for which was 0.807. Further ratios determined on five days in early January, 1960, gave the following values: 0.812, 0.808, 0.804, 0.804, and 0.810. The smooth calibration curve would also appear to substantiate the fact that the instrument is stable.
1. The deviation of points from the mean position on the calibration curve is not large, indicating stability in the in- strument. This is further substantiated by the results of readings obtained on the same sample on different days.
2. The bentonite-water-sand mixtures partly satisfy the conditions for an ideal substitute medium in that they were liquids which eliminated the problem of density control. The actual water con- tent, however, had still to be determined by the oven-drying method.
3. The Calgon-water mixtures more nearly met the requirements for an ideal medium by eliminating the need for density control, in spite of the fact that the mixtures were partly suspensions. A
small error is introduced in determining the water content by dilution and titra- tion and probably a somewhat larger error in determining the densities be- cause of small quantities of entrapped air.
4. The third group of points for sam- ples prepared by sedimenting sorted sand into water are quite scattered. Several sources of error exist and uniformity of density was not attained. Compaction by vibration was not very effective and no doubt resulted in an even greater varia- tion in density than existed in the initial samples.
5 . The Ottawa sand and dextrose sam-
ples are also prone to the errors involved in placing and compaction, but the points determined for them appear close to the mean curve.
6. The accuracy of the instrument would appear from the calibration curve
to be a t least within 1 lb per cu ft. Only one point has a larger error, which is be- lieved to have been caused by an er- roneously high calculated density for a
sample that contained an appreciable amount of entrapped air.
Acknowledgments:
The guidance and assistance of Klaus Geiger of the NRC Division of Applied Physics through all stages of the work is gratefully acknowledged. The author would also like to thank N. B. Hutcheon, Assistant Director, Division of Building Research, and I. E. Puddington, Direc- tor, Division of Applied Chemistry, for their help and interest in the search for substitute media suitable for calibration, and R. Ironside, Division of Applied Chemistry, for the chemical analyses necessary to determine the water con- tents of the Calgon mixtures.
For the continued interest of his col- leagues and those members of the staff who assisted in the preparation of sam- ples and the taking of readings necessary for calibration, the author is particularly grateful.
This paper is a contribution from the Division of Building Research, National Research Council, Canada, and is pub- lished with the approval of the Director of the Division.
REFERENCES
(1) J. W. Holrnes, "Calibration and Field Use (4) S. E. Roy and H. F. Winterkorn, "Scintilla- of the Neutron Scattering Method of Meas- tion Methods for the Determination of uring soil Water Content," Azcslraliaf~ Density and Moisture Contents of Soils and Joflrnal of Science, VO1. 7, p. Similar Granular Systems," Bzcllelin, High- 45 (1956).
(2) J. pawliw and J. W. T. spinks, ygeutron Research Board, Val. 159, p. 58 (1959). Moisture Meter for Concrete," C a n a d i a ? ~ (5) C. H. ill. Van Bavel et al, "Soil Moisture Journal of Teclt?tology, Vol. 34, p. 503 (1957). Measurement by Neutron Moderation,"
(3)
J.
W. HO1mes and K. G. "The Soil Science, Vol. 82, No. 1, p. 29 (1956). Measurement of Water Content of Soils by( 6 ) R. B. et al, L'Foundation Engineering,n Neutron Scattering: A Portable Apparatus
for Field Use," Jozcr?zal of Agriczcltzaal John Wiley and Sons, Inc., New York, N. y. E?zgineering Researcl~, Vol. 3, p. 3 (1958). 1954, p. 21.