HAL Id: hal-02143879
https://hal.sorbonne-universite.fr/hal-02143879
Submitted on 29 May 2019
HAL is a multi-disciplinary open access
archive for the deposit and dissemination of
sci-entific research documents, whether they are
pub-lished or not. The documents may come from
teaching and research institutions in France or
abroad, or from public or private research centers.
L’archive ouverte pluridisciplinaire HAL, est
destinée au dépôt et à la diffusion de documents
scientifiques de niveau recherche, publiés ou non,
émanant des établissements d’enseignement et de
recherche français ou étrangers, des laboratoires
publics ou privés.
of the Atlantic Meridional Overturning Circulation
revisited in a high-resolution ocean model
Siren Rühs, Franziska Schwarzkopf, Sabrina Speich, Arne Biastoch
To cite this version:
Siren Rühs, Franziska Schwarzkopf, Sabrina Speich, Arne Biastoch. Cold vs. warm water route –
sources for the upper limb of the Atlantic Meridional Overturning Circulation revisited in a
high-resolution ocean model. Ocean Science, European Geosciences Union, 2019, 15 (3), pp.489-512.
�10.5194/os-15-489-2019�. �hal-02143879�
Ocean Sci., 15, 489–512, 2019
https://doi.org/10.5194/os-15-489-2019
© Author(s) 2019. This work is distributed under the Creative Commons Attribution 4.0 License.
Cold vs. warm water route – sources for the upper limb of the
Atlantic Meridional Overturning Circulation revisited in a
high-resolution ocean model
Siren Rühs1,a,*, Franziska U. Schwarzkopf1, Sabrina Speich2, and Arne Biastoch1,3
1Research Unit Ocean Dynamics, GEOMAR Helmholtz Centre for Ocean Research Kiel, Kiel, Germany 2LMD-IPSL, UMR 8539, Département de Géosciences, ENS, PSL Research University, Paris, France 3Christian-Albrechts-Universität zu Kiel, Kiel, Germany
anow at: Ocean Frontier Institute, Dalhousie University, Halifax, Canada
*Invited contribution by Siren Rühs, recipient of the EGU Ocean Sciences Outstanding Student Poster
and PICO Award 2017.
Correspondence: Siren Rühs (sruehs@geomar.de)
Received: 25 November 2018 – Discussion started: 7 December 2018
Revised: 18 March 2019 – Accepted: 21 March 2019 – Published: 9 May 2019
Abstract. The northward flow of the upper limb of the At-lantic Meridional Overturning Circulation (AMOC) is fed by waters entering the South Atlantic from the Indian Ocean mainly via the Agulhas Current (AC) system and by waters entering from the Pacific through Drake Passage (DP), com-monly referred to as the “warm” and “cold” water routes, respectively. However, there is no final consensus on the rel-ative importance of these two routes for the upper limb’s vol-ume transport and thermohaline properties. In this study we revisited the AC and DP contributions by performing La-grangian analyses between the two source regions and the North Brazil Current (NBC) at 6◦S in a realistically forced high-resolution (1/20◦) ocean model.
Our results agree with the prevailing conception that the AC contribution is the major source for the upper limb trans-port of the AMOC in the tropical South Atlantic. However, they also suggest a non-negligible DP contribution of around 40 %, which is substantially higher than estimates from pre-vious Lagrangian studies with coarser-resolution models but now better matches estimates from Lagrangian observations. Moreover, idealized analyses of decadal changes in the DP and AC contributions indicate that the ongoing increase in Agulhas leakage indeed may have induced an increase in the AC contribution to the upper limb of the AMOC in the trop-ics, while the DP contribution decreased. In terms of ther-mohaline properties, our study highlights the fact that the AC and DP contributions cannot be unambiguously
distin-guished by their temperature, as the commonly adopted ter-minology may imply, but rather by their salinity when enter-ing the South Atlantic. Durenter-ing their transit towards the NBC the bulk of DP waters experiences a net density loss through a net warming, whereas the bulk of AC waters experiences a slight net density gain through a net increase in salinity. Notably, these density changes are nearly completely cap-tured by Lagrangian particle trajectories that reach the sur-face mixed layer at least once during their transit, which amount to 66 % and 49 % for DP and AC waters, respec-tively. This implies that more than half of the water masses supplying the upper limb of the AMOC are actually formed within the South Atlantic and do not get their characteristic properties in the Pacific and Indian Oceans.
1 Introduction
Within the framework of the global overturning circula-tion, the South Atlantic is depicted as a conduit exporting cold, dense waters produced in the North Atlantic into the Indian and Pacific basins and enabling the return flow of warmer, lighter waters back into the North Atlantic, which in turn feed the deepwater formation (Broecker, 1991; Richardson, 2008). The resulting net equatorward heat transport within the South Atlantic and thus northward
heat transport across the whole Atlantic (see Kelly et al., 2014) is unique among all ocean basins and has been long recognized for its importance in modulating Euro-pean (e.g., Palter, 2015; Moffa-Sánchez and Hall, 2017) and global (e.g., Srokosz et al., 2012; Buckley and Marshall, 2016; Lynch-Stieglitz, 2017) cli-mate.
Even though variability in the overall overturning strength and associated heat transport has been mostly related to vari-ability in deepwater formation (e.g., Biastoch et al., 2008a; Yeager and Danabasoglu, 2014), the involved convection process is highly sensitive to the local stratification and is thus additionally impacted by the thermohaline properties of the northward upper-layer return flow, that is, the upper limb of the Atlantic Meridional Overturning Circulation (AMOC) (Haarsma et al., 2011; Garzoli and Matano, 2011; Cima-toribus et al., 2012; Garzoli et al., 2013). In particular, it has been suggested that a net southward freshwater transport related to the northward advection of relatively high-saline waters along the AMOC’s upper limb in the South Atlantic introduces a positive feedback (e.g., Stommel, 1961; Rahm-storf, 1996; Drijfhout et al., 2011): a weakening (strengthen-ing) of the AMOC results in reduced (enhanced) northward salt transport and corresponding freshening (salinification) of the North Atlantic, with further weakening (strengthening) of the overturning. This salt–advection feedback constitutes the basis for the theory of rapid climate shifts associated with a bistability of the AMOC with either vigorous overturn-ing (“on” state) or weak or reversed overturnoverturn-ing (“off” state) (e.g., Rahmstorf, 2002; Deshayes et al., 2013).
The upper limb of the AMOC is mainly supplied by wa-ters entering the South Atlantic south of America through Drake Passage (Pacific–Atlantic route) and south of Africa via the Agulhas Current system (Indo-Atlantic route). The Pacific–Atlantic route is characterized by cold and fresh wa-ters (Rintoul, 1991) flowing from the Antarctic Circumpolar Current (ACC) directly into the South Atlantic subtropical gyre without any intermediate recirculation in other basins. Within the literature it has been also referred to as the direct “cold water route” (Speich et al., 2001). The Indo-Atlantic route injects comparatively warm and salty waters into the South Atlantic (Gordon, 1986; Richardson, 2007) in the form of large anticyclonic eddies (Agulhas rings), smaller cyclonic eddies, and filaments shed at the retroflection of the Agulhas Current, comprehensively termed Agulhas leakage (de Rui-jter et al., 1999; Lutjeharms, 2006). It has been commonly referred to as the “warm water route” (Gordon, 1986; Speich et al., 2001).
Due to their remarkably different water properties the ratio of the inflow through the Pacific–Atlantic and Indo-Atlantic routes impacts the thermohaline characteristics of South At-lantic water masses and may alter the strength and stability of the AMOC (e.g., Weijer et al., 2001). Yet, there is no final consensus on the relative contributions of the two routes to the thermohaline properties and the northward transport of
the upper limb of the AMOC (Garzoli and Matano, 2011; Dong et al., 2011). Gordon (1986) postulated the Indo-Atlantic route to be the major source for the upper limb of the AMOC (warm water route hypothesis), while Rintoul (1991) found only a minor importance of the Indo-Atlantic route and suggested the Pacific–Atlantic route to be the dominant one (cold water route hypothesis). Since then, both hypotheses have been controversially discussed. For instance, Schmitz (1995), Macdonald (1998), and Sloyan and Rintoul (2001) supported the cold water route hypothesis, whereas Speich et al. (2001, 2007), Holfort and Siedler (2001), Donners and Drijfhout (2004), Rodrigues et al. (2010), Dong et al. (2011), and Cessi and Jones (2017) favored the warm water route hypothesis.
The conflicting views on the relative importance of the Indo-Atlantic and Pacific–Atlantic routes for thermohaline properties and the northward transport of the upper limb of the AMOC have been partially attributed to conceptual (such as diverging definitions of the cold and warm water routes) and methodological differences (such as the usage of Eu-lerian vs. Lagrangian approaches to estimate interbasin ex-changes). Speich et al. (2001, 2002, 2007) emphasized that the warm and cold water route debate is more complex than previously stated due to the impact of the Southern Hemi-sphere “supergyre” spanning all three basins. They show that the warm water route, which was traditionally assumed to consist of Indian Ocean waters originating from the Indone-sian throughflow (Gordon, 1986; Le Bars et al., 2013), also contains waters entering the Indian Ocean through Tasman leakage south of Australia (Speich et al., 2001, 2002) and waters originating indirectly from Drake Passage through a connection via the Antarctic Circumpolar Current (ACC) and subsequent circulation in the Indian Ocean part of the supergyre (note that some studies also refer to the indi-rect Drake Passage contribution as the “indiindi-rect cold water route”). Moreover, Donners and Drijfhout (2004) refuted the majority of studies in support of the cold water hypothesis by arguing that their common choice of using inverse box model calculations based on distinct hydrographic sections is gen-erally not suited to estimate the highly variable and intermit-tent interbasin exchange south of Africa via Agulhas leakage. Since then, Lagrangian (model) analyses have become the preferential tool to estimate Agulhas leakage (e.g., Richard-son, 2007; Biastoch et al., 2008c; van Sebille et al., 2010; Durgadoo et al., 2013), and the warm water route hypothesis has been prevailing. Recently, further theoretical support for it was provided by Cessi and Jones (2017), who studied the upper limb of the AMOC in an idealized model configura-tion with simplified atmospheric forcing and geometry (one wide and one narrow basin, representing the Indo-Pacific and Atlantic Oceans, separated by a long and a short continent, representing America and Eurasia–Africa, and connected in the south through a reentrant channel representing the ACC). They showed that the latitude of zero Ekman pumping rela-tive to the southern extent of the short continent determines
S. Rühs et al.: Cold vs. warm water route 491
the route of the upper limb’s interbasin exchange and that under the current geographical settings, which allow for a Southern Hemisphere supergyre, the exchange occurs exclu-sively south of the short continent, that is, via the warm water route.
Still, studies supporting the warm water route hypothesis remain inconclusive. On the one hand, the idealized model configuration of Cessi and Jones (2017) leads to an arti-ficial separation of warm and cold water route scenarios, whereby realistic wind stress forcing and geometry indeed may allow for mixed exchange routes as stated by the au-thors themselves. On the other hand, Cessi and Jones (2017) and most other studies in support of the warm water route hypothesis were based on the evaluation of relatively coarse-resolution non-eddying or eddy-permitting ocean model sim-ulations (Speich et al., 2001; Donners and Drijfhout, 2004; Speich et al., 2007), and various studies (e.g., Biastoch et al., 2008c; Durgadoo et al., 2013) have demonstrated that coarse non-eddying ocean models overestimate the strength of Ag-ulhas leakage. Thus, there is the need for a confirmation or revision of the warm water route hypothesis by means of Lagrangian analysis with higher-resolution eddy-rich flow fields from ocean model simulations with realistic forcing and geometry.
Furthermore, despite a general agreement that knowledge of the characteristic thermohaline properties of the waters supplying the upper limb of the AMOC and their potential modification during their transit through the South Atlantic is of fundamental importance, including the individual roles played by upper and intermediate waters, thorough analyses within the Lagrangian framework have been scarce (Speich et al., 2001, 2007; Rimaud et al., 2012).
Finally, over the last decades, research on (potential) changes in the Agulhas region have become prominent, since (i) it has been shown that changes in the Agulhas region have the potential to influence the strength of the AMOC through different processes on various timescales (Weijer et al., 2002; Knorr and Lohmann, 2003; Biastoch et al., 2008b; Beal et al., 2011), and (ii) simulations with ocean and coupled ocean– atmosphere models indicate a strengthening of Agulhas leak-age since the 1960s (Biastoch et al., 2009; Cheng, 2018). A conclusive observational corroboration of this long-term increase, however, is still lacking (Backeberg et al., 2012; Le Bars et al., 2014), which may be due to decadal leak-age variability related to the Southern Annular Mode (Bi-astoch et al., 2009) that tends to mask its long-term trend. The increase in Agulhas leakage has been attributed to an increase in the Southern Hemisphere westerlies (Durgadoo et al., 2013; Biastoch et al., 2015) and is expected to con-tinue under global warming conditions (Biastoch and Bön-ing, 2013). A potential related increase in salt input into the South Atlantic and its northward advection could oppose the anticipated weakening of the AMOC due to increasing fresh-water input in the North Atlantic (Beal et al., 2011). These notional causalities motivated several Lagrangian studies on
the pathways and associated advective timescales of Agul-has waters into the North Atlantic (van Sebille et al., 2011; Rühs et al., 2013). However, none of these studies directly in-vestigated potential changes in the advective pathways, ther-mohaline properties, and transports of the upper limb of the AMOC associated with changes in Agulhas leakage or tried to also relate those to changes in the Pacific–Atlantic contri-bution.
In this study we address the gaps outlined above and re-visit the relative importance of the Indo-Atlantic and Pacific– Atlantic routes for the AMOC upper limb volume transport and water mass characteristics by means of Lagrangian con-nectivity analyses between the North Brazil Current (NBC) at 6◦S and the two source regions in a realistic setup of a high-resolution (1/20◦) ocean model. In addition, for the first time, idealized analyses of decadal changes in the individual contributions are presented. The NBC is chosen as a refer-ence region, since it merges all upper and intermediate north-ward flow of the tropical South Atlantic and thus channels the upper limb of the AMOC in the tropics. It has further been shown that its transport variability captures decadal AMOC changes and may be used as an index for the AMOC strength (Rühs et al., 2015). Thus, choosing the NBC as a reference region also allows for the investigation of potential decadal changes in the ratio of the two contributions.
2 Materials and methods
The bases for this study are offline Lagrangian analyses of simulated three-dimensional time-varying eddy-rich veloc-ity fields. The underlying model simulation and its perfor-mance are described in Sect. 2.1, whereas in Sect. 2.2 the Lagrangian experiment setup is specified.
2.1 Hindcast simulation with eddy-rich ocean model configuration INALT20
The analyzed model output stems from a hindcast experi-ment (1958–2009) performed with the global nested eddy-permitting to eddy-rich ocean–sea-ice model configuration INALT20 (Schwarzkopf et al., 2019), which is a successor of the well-established INALT01 (Durgadoo et al., 2013) with higher resolution and a southward extended nest.
INALT20 was developed within the DRAKKAR frame-work (Barnier et al., 2014) and consists of an ocean model formulated with the Nucleus for European Modelling of the Ocean (NEMO version 3.6; Madec and NEMO-team, 2016) coupled to the LIM2-VP sea-ice model (Fichefet and Maqueda, 1997). The ocean is therein described by the prim-itive equations, which are the Navier–Stokes equations along with a nonlinear equation of state, with commonly adopted approximations resulting from scale considerations including the Boussinesq approximation that effectively reduces mass conservation to volume conservation. It is implemented on a
horizontal tripolar Arakawa C grid (Mesinger and Arakawa, 1976), which is Mercator-type south of 20◦N. It has a global
horizontal resolution of 1/4◦ but is regionally refined
be-tween 63◦S–10◦N and 70◦W–70◦E via two-way nesting with adaptive grid refinement in Fortran (AGRIF) (Debreu and Blayo, 2008) to its nominal resolution of 1/20◦. This yields an effective resolution of 5.6–27.8 km in the global base and 2.5–5.6 km in the nest, which allows us to fully re-solve mesoscale processes (see Hallberg, 2013). In the verti-cal it is composed of 46 z levels, with grid spacing increasing from 6 m at the surface to a maximum 250 m at depth. Bot-tom cells can be partially filled, thus allowing for an adjust-ment to a more realistic topography, which has been obtained from the bathymetry developed by the DRAKKAR commu-nity (Barnier et al., 2006) and from interpolating ETOPO1 data (Amante and Eakins, 2009) for the 1/4◦and the 1/20◦ grid, respectively.
For the employed hindcast (experiment identifier KFS044) the model was initialized with temperature and salinity fields from Polar science center Hydrographic Climatology (PHC, version 2.1; updated from Steele et al., 2001), spun up from rest for 30 years, and subsequently run with forcing from the atmospheric fields of the Coordinated Ocean–Ice Reference Experiments data set version 2 (CORE; Large and Yeager, 2009; Griffies et al., 2009) for the period 1958–2009. Turbu-lent air–sea fluxes were calculated during the model integra-tion through bulk formula using the prescribed atmospheric state, as well as the simulated sea surface temperatures and relative winds. The momentum equations were discretized using the energy- and enstrophy-conserving (EEN; Arakawa and Hsu, 1990) advection scheme with Hollingsworth cor-rection (Hollingsworth et al., 1983; Bell et al., 2017) and a bi-Laplacian lateral diffusion operator. The evolution of trac-ers was simulated using the total variance dissipation (TVD; Zalesak, 1979) advection scheme and a Laplacian isoneutral diffusion operator. Viscosity and diffusivity coefficients vary horizontally according to the local grid size and are specified via their maximum values Ahm0 and Aht0, set to −6 × 10⁹ (−1.5 × 10¹¹) m4s−1and 60 (300) m2s−1in the nest (base), respectively. Vertical sub-grid-scale physics have been pa-rameterized using a closure scheme dependent on turbulent kinetic energy (TKE; Gaspar et al., 1990; Madec et al., 1998). For more details on the experimental setup and a general model validation please refer to Schwarzkopf et al. (2019).
In this study we used the simulated 5 d mean velocity and tracer fields from the nested domain, which show a realistic representation of the mean flow pattern and mesoscale eddy activity in the South Atlantic and adjacent Southern Ocean sector (Fig. 1).
Most importantly for this study, they adequately repre-sent the major current systems providing the Pacific–Atlantic and Indo-Atlantic inflow of upper limb waters, which are the ACC and Agulhas Current systems. The mean (2000– 2009) transport of the ACC through Drake Passage amounts to 116.2 ± 7.5 Sv (1 Sv: = 106m3s−1; uncertainties are given
in terms of 1 standard deviation). This value is not too far from the ACC transport of 134 ± 11.2 Sv reported by Cun-ningham et al. (2003), given that they estimated the error of this average transport to be between 15 and 27 Sv. Notably, the model features a distinct South Atlantic Current (SAC) north of the ACC and captures the anticyclonic circulation of the Zapiola Gyre (Fig. 1a), while coarser-resolution models generally failed to separate the SAC from the ACC and did not resolve the Zapiola Anticyclone (see Stramma and Eng-land, 1999). In an accompanying study Schwarzkopf et al. (2019) show that the total simulated Agulhas Current trans-port compares reasonably well with available observational estimates from the ACE (at 32◦S; Bryden et al., 2005) and ACT (at 34◦S; Beal et al., 2015) arrays. Moreover, the simu-lated standard deviation of sea surface height (σSSH), which
is a measure of surface geostrophic eddy variability, agrees well with the observed pattern and magnitude of σSSH
de-rived from the Archiving, Validation, and Interpretation of Satellite Oceanographic (AVISO) data product (Fig. 1b–c). In particular, it features the characteristic pattern of high σSSHat the Brazil–Malvinas confluence zone, as well as in
the extended Agulhas Current system.
Within the simulated 5 d mean velocity fields, the strength and variability of NBC and AMOC are also well repre-sented. Figure 2a and b shows a meridional velocity sec-tion at 6◦S, as well as the derived time series of the sim-ulated NBC transport, obtained from the integration of the northward velocities between 0 and 1200 m of depth and from the coast to 33.5◦W (see Hummels et al., 2015; Rühs et al., 2015, and references therein for a justification of the adopted NBC definition). One can identify the northward-directed NBC with a subsurface maximum, its southward recirculation to the east, and the southward-flowing Deep Western Boundary Current underneath. The mean (2000– 2009) NBC transport of 25.5 ± 5.0 Sv falls well into the ob-served range of 26.5 ± 3.7 Sv reported by Schott et al. (2005) based on repeated shipboard sections at 6◦S (nine-section ensemble with individual measurements between 1990 and 2004). The simulated mean (2000–2009) AMOC strength, defined at each latitude as the maximum of the meridional overturning stream function, yields 14.8±6.3 Sv at 6◦S. Un-fortunately, the lack of observational AMOC estimates ham-pers model verifications at this latitude. Yet, first results of the SAMBA array (Meinen et al., 2013) allow for some useful quantitative assessments at 34.5◦S. Here, the simu-lated mean (2000–2009) AMOC transport of 13.6 ± 5.0 Sv fits well with the recently published observational estimates of 14.7 ± 8.3 Sv (Meinen et al., 2018, based on daily data over the 2009–2017 period, with a ∼ 3-year gap from De-cember 2010 to September 2013). The decadal variability of NBC and AMOC (Fig. 2c) at 6◦S features the charac-teristics already presented in Rühs et al. (2015): the NBC and AMOC transports vary roughly in phase with overall de-creasing transports in the 1960s and 1970s and a recovery in the 1980s and the early 1990s, whereby the decadal NBC
S. Rühs et al.: Cold vs. warm water route 493
Figure 1. South Atlantic circulation pattern. (a) Simulated mean (2000–2009) upper ocean (averaged over upper 750 m of depth) potential temperature θ (color shading) and horizontal velocity uh(vectors); velocity components have been averaged onto a 1.5◦×1.5◦grid for
plotting purposes; white arrows highlight major currents of interest for this study: Agulhas Current (AC), Agulhas Return Current (ARC), Benguela Current (BeC), Antarctic Circumpolar Current (ACC), Malvinas Current (MC), South Atlantic Current (SAC), South Equatorial Current (SEC), North Brazil Current (NBC), and Brazil Current (BC). (b–c) Mean standard deviation of sea surface height σSSH from
simulations and AVISO based on 5 d means in 2000–2009.
Figure 2. Simulated NBC and AMOC at 6◦S. (a) Mean (2000–2009) meridional velocity v in the western tropical Atlantic; the NBC transport is defined by the integrated positive meridional (northward) velocities between the coast and 33.5◦W and between 0 and 1200 m of depth (red box). (b) 5 d mean (grey) and interannually low-pass-filtered (red) NBC transport time series; the release period for the Lagrangian REF experiments is highlighted in light red, and annual mean Lagrangian transport estimates without (crosses) and with (crosses in circles) correction for meanders are marked. (c) Interannual (thin) and decadal (thick) NBC (red) and AMOC (blue) transport anomalies (long-term mean subtracted).
variability is more than twice as large in magnitude. This sug-gests that the conclusions of Rühs et al. (2015) also hold for this model simulation, i.e., that the basin-scale decadal vari-ability of the AMOC is indeed captured in the NBC but is additionally superimposed (and thus masked) by wind-driven gyre variability.
2.2 Offline Lagrangian analysis of AMOC upper limb pathways with ARIANE
We used the ARIANE tool (version 2.2.6; Blanke and Ray-naud, 1997; Blanke et al., 1999) to perform three sets of offline Lagrangian experiments, one reference set (hereafter REF), and two sensitivity sets corresponding to a weak and
a strong phase of Agulhas leakage (hereafter lowAL and highAL).
ARIANE is a freely available Fortran software that in-fers Lagrangian particle trajectories from simulated three-dimensional volume-conserving velocity fields saved on a C grid by offline advecting virtual fluid particles along analyti-cally computed streamlines. No additional sub-grid-scale La-grangian diffusion parameterization was implemented. The obtained trajectories thus represent volume transport path-ways, which may experience along-track tracer and density changes that reflect the sub-grid-scale parameterizations of the underlying ocean general circulation model (OGCM), in-cluding vertical tracer mixing in the mixed layer. For a de-tailed discussion of this concept please refer to van Sebille et al. (2018).
For REF we released virtual fluid particles every 5 d for the years 2000–2009 over the full depth of the northward-flowing NBC (0–1200 m of depth, coast to 33.5◦W) at 6◦S,
yielding a set of 10 1-year release experiments with a total of O(106)particles. The number of particles seeded at each time step was proportional to the current NBC transport. Follow-ing Blanke et al. (1999) each particle was tacked with a par-tial volume transport (max. 0.01 Sv) so that the cumulative transport of all particles released at each time step reflects the current total NBC transport. Subsequently, the particles were advected backwards in time until the point at which they en-tered the study domain through one of the predefined source sections displayed in Fig. 3, but at maximum for 40 years. During the trajectory integration the potential temperature and salinity fields were linearly interpolated onto the parti-cle positions.
For the Lagrangian sensitivity experiments we followed the same procedure as for REF but used only velocity fields from preselected periods of weak (1960–1969) and strong (2000–2009) Agulhas leakage (based on the Agulhas leak-age transport time series inferred from a complementary set of offline Lagrangian experiments following Durgadoo et al. (2013); see also Appendix A). That is, we released particles in the NBC at 6◦S for years 1960–1969 (lowAL) and 2000– 2009 (highAL) and then traced them backwards towards the predefined source sections by looping through the velocity data of each period for a maximum of 40 years (instead of making use of the whole simulation period 1958–2009). Even though this looping technique has already been em-ployed by various authors (e.g., Döös et al., 2008; Rühs et al., 2013; Thomas et al., 2015; Berglund et al., 2017; Drake et al., 2018; Durgadoo et al., 2017), the obtained results have to be interpreted with caution. Looping may introduce unphys-ical jumps in the velocity and tracer fields and, consequently, also in the volume transport pathways and along-track tracer changes. Döös et al. (2008) and Thomas et al. (2015) showed that the errors in the pathways introduced by looping can be negligible if a sufficiently high number of virtual fluid particles is considered and the (model) drift in the velocity fields is not too large. We are accounting for that by
con-tinuously seeding particles over 10 years and looping over a period of only 10 years. However, the analysis of along-track thermohaline property modifications makes little sense for timescales exceeding the period of available data. There-fore, in this study, we employ the looping technique only for estimating sensitivities of the derived volumetric connectiv-ity measures to different idealized states of the South Atlantic circulation pattern, but not for assessing along-track property modifications.
To quantitatively evaluate the major pathways of the large set of individual trajectories we followed Blanke et al. (1999) and calculated Lagrangian transport stream func-tions (Fig. 3a). These represent time-integrated mean vol-ume transport pathways derived from all trajectories enter-ing and leaventer-ing the domain – particles still in the domain were not considered (including them would have violated the constraint of volume conservation). Negative and pos-itive values represent anticyclonic and cyclonic circulation patterns, respectively. A bundling of streamlines highlights the most prominent pathways, and closed streamlines indi-cate recirculation patterns. To visualize the distribution of AC or DP waters along distinct sections we inferred binned transport-weighted particle frequencies by dividing the cu-mulative transport of particles occupying a certain bin by the cumulative transport of the whole set of particles. Transport-weighted particle distributions are preferred over simple par-ticle frequency distributions since they take into account the fact that each particle can be associated with a slightly differ-ent transport.
Note that even though trajectory integrations were per-formed backwards in time to identify the sources for the up-per limb of the AMOC, in the following the resulting La-grangian connectivity measures will be described in the more intuitive forward sense: that is, in the flow direction.
3 Results and discussion
This section starts with a thorough assessment of the La-grangian trajectory set REF – representing the mean AMOC upper limb connectivity between the Indian–Pacific Ocean and the NBC over the last decades – in terms of a volumetric decomposition (Sect. 3.1), transit times (Sect. 3.2), volume transport pathways (Sect. 3.3), and along-track thermohaline property modifications (Sect. 3.4). It closes with a short dis-cussion of potential decadal changes in the derived connec-tivity measures associated with an increase in Agulhas leak-age by a joint evaluation of the two trajectory sets lowAL and highAL (Sect. 3.5).
3.1 Volumetric decomposition of NBC and AMOC upper limb transport at 6◦S
From the Eulerian mean (2000–2009) NBC transport of 25.5 Sv, 2.4 Sv was identified as representing meanders
S. Rühs et al.: Cold vs. warm water route 495
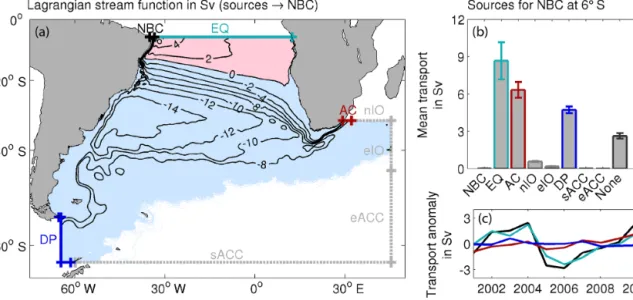
Figure 3. Sources for NBC transport inferred from the REF set of 10 Lagrangian experiments for which particles were released in the NBC at 6◦S every 5 d for years 2000 to 2009 and then traced backwards in time towards the indicated source sections for a maximum of 40 years. (a) Mean Lagrangian stream function representing volume transport pathways from all source sections towards the NBC. (b) Mean volumetric contributions of the individual sources to the NBC; whiskers indicate the range of transport estimates. (c) Time series of interannual variability of the total NBC transport (black line) and its individual contributions, which are volumetric contribution of each Lagrangian experiment plotted against the respective release year (colored lines).
within the framework of the Lagrangian analysis. Mean-ders consists of particle trajectories that enter and also leave through the NBC section. Subtracting the meander-associated transport yielded a new corrected Lagrangian mean (2000–2009) NBC transport estimate of 23.1 Sv (see Fig. 2b), from which 8.7 Sv (38 %) stems from the equato-rial Atlantic (EQ), 6.3 Sv (27 %) from the Agulhas Current (AC), and 4.7 Sv (20 %) from Drake Passage (DP) (Fig. 3b). Other inflow sections from the Indian Ocean (nIO and eIO) constitute only a minor source of 0.8 Sv. On average 2.6 Sv could not be unequivocally attributed to one of the predefined sources, since the associated particles did not leave the study domain within the 40 years of integration (see the discussion below).
If one examines the individual Lagrangian experiments of REF with 10 different release years, one detects a large in-terannual variability of the total NBC transport as well as in the individual volumetric contributions of the different sources, which necessitates the adopted strategy of multi-ple Lagrangian experiments with different release periods (Fig. 3c). Most interannual volume transport variability in the NBC is related to variability in the EQ contribution, whereas interannual variability in the AC and DP contributions is less pronounced. Even though the order of the individual sources according to their total volume transport contribution does remain constant in all experiments and the EQ contribution is always the largest, the relative EQ contribution indeed varies between 31 % and 43 %. Interestingly, the relative AC con-tribution nearly constantly increases from 25 % in 2000 to 29 % in 2009 (not shown). This increase in the AC
contri-bution could be regarded as an indication that the increase in Agulhas leakage is indeed projected onto the NBC and upper limb of the AMOC in the tropical Atlantic. However, the Lagrangian analyses discussed here are not sufficient to unequivocally determine a link between Agulhas leakage strength and the AC contribution to the NBC transport. In principle, a larger Agulhas contribution could stem from a preceding increase in Agulhas leakage and/or from a higher percentage of Agulhas leakage waters reaching the NBC due to changes in the subtropical gyre circulation – even if Agul-has leakage itself stays constant or decreases (see Tim et al., 2018). In Sect. 3.5, we discuss the possible impact of an on-going increase in Agulhas leakage on the NBC and upper limb of the AMOC in more detail by making use of lowAL and highAL.
Some uncertainty in our analysis arises from the fact that on average 2.6 Sv of NBC waters could not be sampled at one of the source sections after 40 years of trajectory in-tegration since the corresponding particles remained inside the predefined domain. At the end of the integration period most of these particles could be located within the interior of the tropical and subtropical gyres (not shown), indicat-ing that (multiple) recirculations prevented them from leav-ing through one of the source sections. To obtain a first es-timate of where these waters may stem from, we extended the integration period for the respective particles to 80 years by cycling through the available velocity data for the period 1958–2009 (similar procedure as for the Lagrangian sensi-tivity experiments lowAL and highAL described in Sect. 2.2, but by making use of the whole velocity data set instead of
restricted time periods). In the additional 40 years of integra-tion, out of the 2.6 Sv, 0.8 Sv could be sampled at the DP, 0.4 Sv each at the AC and EQ, and 0.1 Sv at the nIO and eIO sections; 0.8 Sv still did not reach any section. This suggests that our analysis of the REF experiments with 40 years inte-gration most likely slightly underestimates the AC, EQ, and in particular the DP contribution (further support for this as-sumption follows below in Sect. 3.2).
Of particular interest for this study are sources contribut-ing to the northward flow of the upper limb of the AMOC, which are the AC, DP, and IO contributions that amount to 11.8 Sv when averaged over all Lagrangian experiments in REF. The EQ contribution is not considered part of the net northward upper limb flow at 6◦S, since the southward inflow happens across the same zonal section and in the same depth range as the northward NBC outflow. We at-tribute this contribution to the more local tropical circula-tion, acknowledging that the NBC is not only part of the basin-scale AMOC but also of the wind-driven horizontal gyre circulation and the shallow overturning of subtropical– tropical cells (Rühs et al., 2015). Adding the 1.3 Sv that, ac-cording to the extended experiments with 80 years of inte-gration, most likely also stems from AC, DP, and IO yields an estimate for the Lagrangian mean upper limb transport at 6◦S of 13.1 Sv. This number compares well with the simu-lated mean (2000–2009) Eulerian AMOC strength at 6◦S of 14.8±6.3 Sv, which gives us confidence in the validity of our Lagrangian decomposition of the AMOC’s upper limb with the NBC at 6◦S as a reference point. The remaining discrep-ancy between the Lagrangian and Eulerian estimate of the AMOC strength can be attributed to (i) particles that did not cross any sampling section but remained in the domain even after 80 years integration, in total amounting to 0.8 Sv, (ii) a minor upper limb contribution flowing northward in the in-terior tropical Atlantic (additional Lagrangian experiments backwards in time from the EQ instead of the NBC section yield quantitative estimates for that contribution of 1.0 and 1.2 Sv after 40 and 80 years of integration, respectively), and (iii) differences in Lagrangian and Eulerian averaging.
Our results – with and without the second integration cy-cle – seem to generally agree with the prevailing conception that the warm water route is the major source for the return flow. The respective AC and minor IO contribution to the AMOC’s upper limb transport at 6◦S amounts to 60 % (7.1 from 11.8 Sv) in REF and to 58 % (7.6 from 13.1 Sv) in the extended experiment. Nonetheless, we also obtained a DP contribution of 40 % (4.7 from 11.8 Sv) and 42 % (5.5 from 13.1 Sv), respectively, which, to our knowledge, is substan-tially higher than those inferred from all previous Lagrangian model studies but now better matches those derived from ob-servations. For instance, with regard to Lagrangian model studies, Speich et al. (2001), Donners and Drijfhout (2004), and Speich et al. (2007) only estimated a direct cold water route contribution of 13 % (2.3 from 17.8 Sv at 20◦N), 6 % (1.0 from 16.2 Sv at 0◦N), and < 6 % (< 1.0 from 17.4 Sv
at 44◦N), respectively. All these studies employed the same analytical trajectory integration method, so differences in the derived volumetric contributions to the upper limb of the AMOC can be mainly related to differences in the analyzed OGCM output (even though the different reference sections for the Lagrangian decomposition do not allow for a detailed one-to-one comparison). A possible reason for our remark-ably different rating of the relative importance of the direct DP contribution could be the increased horizontal (and tem-poral) resolution of the underlying model data of this study compared to those of previous ones. On the one hand, an increased resolution leads to a way more realistic represen-tation of the current structure in the southern South Atlantic. Despite generally enhanced eddy-driven cross-frontal trans-ports, it allows for the separation of the SAC from the ACC as described in Sect. 2.1 and a more detailed representation of the intricate flow pattern in the Brazil–Malvinas confluence zone. All these features potentially influence the existence and strength of the direct DP contribution (see Sect. 3.3). On the other hand, coarser-resolution models are likely to over-estimate the AC contribution due to unrealistically high Ag-ulhas leakage (see Sect. 1), thereby reducing the relative im-portance of the DP contribution. It must be underlined how-ever, that Speich et al. (2001) and Speich et al. (2007) used an OGCM in a robust diagnostic mode. Therefore, the ana-lyzed fields have to be interpreted rather as a dynamical inter-polation of observations than as a prognostic model output. Hence, more dedicated studies are needed to test the sensi-tivity of the relative DP and AC contributions to the model resolution, as well as to the potential impact of other details in the model configuration and forcing. In terms of observa-tions, estimates of corresponding mean absolute transports were not available until Rodrigues et al. (2010) addressed this issue. They used the hydrographic and subsurface float data from the World Ocean Circulation Experiment (WOCE) to estimate total transports for key regions in the South At-lantic, yielding a cold water contribution of 36 % (4.7 from 13.2 Sv at 32◦S). Hence, these observation-based estimates support the findings of our new model-based analysis.
Due to the reasoning outlined in Sect. 2.2, for the rest of these study results are based on the REF experiments with-out cycling of the velocity fields (except for Sect. 3.5, where lowAL and highAL are analyzed). Since the majority of DP and AC particles do reach the NBC within the REF integra-tion period of 40 years (see Sect. 3.2), we are convinced that the general scientific interpretation will not change with in-creasing integration time, even though absolute numbers may (as demonstrated above).
3.2 Transit times towards NBC at 6◦S
The transit times of waters from the different sources to reach the NBC are crucial for understanding how these source waters and potential changes therein are transported down-stream and impact the mean characteristics and variability of
S. Rühs et al.: Cold vs. warm water route 497
Figure 4. Transit times from the (a) EQ, (b) AC, and (c) DP source region towards the NBC at 6◦S; bars and solid colored lines repre-sent mean transport-weighted transit time distributions, and dashed colored lines indicate the range of the 10 REF experiments (dis-played as thin grey solid lines).
NBC waters as well as the upper limb of the AMOC. Here we infer advective timescales from the simulated volume trans-port trajectories. Note that timescales inferred from trajecto-ries accounting for the effect of sub-grid-scale physics, e.g., representing advective–diffusive tracer spreading, could lead to modified, e.g., broadened, transit time distributions.
Figure 4 shows the transport-weighted distributions of the advective transit times through the South Atlantic from the EQ, AC, and DP sections, respectively: from the EQ section the NBC is reached by the majority of particles (> 50 %) in less than 3 years, with 1 year being the most frequent transit time (modal value of the transit time distribution), which re-sults from short pathways on which changes can be relatively fast and directly transmitted. This is one reason why interan-nual variability in the NBC mostly corresponds to variability of the EQ contribution, which is most probably a response to local variability in the wind forcing (see Rühs et al., 2015). From the AC and particularly DP the majority of particles (> 50 %) reach the NBC in 9 and 18 years, and the most fre-quent transit times are 7 and 12 years, respectively; hence, they need considerably more time. In addition to the shift to longer timescales, the transit time distributions are broad-ening, in particular for waters with DP origin, representing longer and more diverse connecting pathways. The interan-nual variability of the volumetric AC and DP contributions thus constitute the accumulation of past changes at the source and potential additional circulation changes along the way. This may impede a direct imprint of variability at the DP and AC sources on the NBC.
The derived transit time distributions for the AC contribu-tion closely match those derived by Rühs et al. (2013) based on output from the ocean model configuration INALT01, the precursor of the configuration INALT20 employed here. As already stated in Rühs et al. (2013), the transit times ap-pear slightly longer than those estimated by van Sebille et al. (2011), even though a detailed comparison is inhibited by differences in the applied methodologies and emphases of the studies.
Our derived transit times from the DP into the equatorial Atlantic can be compared to the transit times from DP to-wards 20◦N estimated by Speich et al. (2001). Most notably, Speich et al. (2001) arrived at a multi-modal distribution and interpreted peaks at 19 and 29 years as the representative time periods needed for DP waters to reach the North At-lantic on a relatively direct path and with one recirculation in the South Atlantic, respectively. The 19 years for the direct path is comparable to our 12 years if following Rühs et al. (2013) and assuming the transit from 6◦S to 20◦N to account for another ∼ 6 years. However, our analysis does not show a second peak. This may be due to differences in the hori-zontal and temporal resolution of the employed ocean mod-els. Our analysis is based on a high-resolution fully eddying configuration, whereas Speich et al. (2001) used a coarse, non-eddying one. Moreover, we used 5 d mean velocity fields of a hindcast experiment, whereas Speich et al. (2001) used monthly means from a climatological experiment. The in-crease in resolution and allowance for interannual variabil-ity most likely lead to more diverse recirculation pathways and associated transit times, thereby disintegrating the sec-ond peak in the transit time distribution.
Further note that the shape of the transit time distribution for the DP contribution shows a less distinct modal value and a broader tail than those for the AC and EQ distributions. This supports our assumption (see Sect. 3.1) that a large part of the particles that remained in the domain after 40 years of integration could probably be attributed to the DP source, which reinforces the importance of the DP as a contributor to the upper limb of the AMOC.
3.3 AMOC upper limb pathways in the South Atlantic
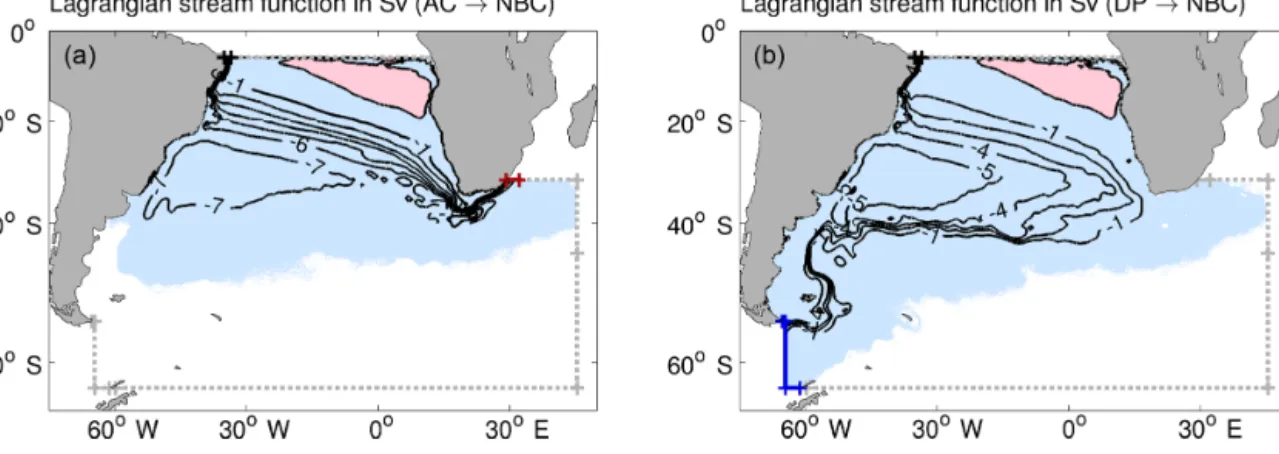
In this section we have a closer look at the mean AMOC up-per limb pathways in the South Atlantic by investigating the connection from the two major individual sources, which are the AC and DP regions, towards the NBC. This is done by using conditional Lagrangian stream functions, which were calculated considering only the respective subsets of trajecto-ries and represent the associated net advective volume trans-port pathways (Fig. 5).
From the Indian Ocean the dominant volume transport pathways towards the NBC are via the narrow Agulhas Cur-rent, Agulhas leakage (in the form of Agulhas rings or within the Benguela Current), and the broad South Equatorial Cur-rent (Fig. 5a), as already described in previous studies (e.g.,
Figure 5. Mean Lagrangian stream function from all 10 REF experiments representing net volume transport pathways between (a) AC or (b) DP and the NBC; contour intervals of 1 Sv.
van Sebille et al., 2011; Rühs et al., 2013). Some recircula-tion may occur in the subtropical gyre (∼ 1 Sv) and in the Agulhas basin itself (∼ 3 Sv). AC waters contributing to the NBC enter as surface and intermediate waters over the whole longitudinal and depth range of the Agulhas Current and later occupy the whole longitudinal and depth range of the NBC (Fig. 6a, c).
From the Pacific, the majority of fluid particles later reach-ing the NBC through a relatively direct path (without a de-tour through the Indian and eventually also the Pacific Ocean within the Southern Hemisphere supergyre) enter the At-lantic through the northern part of Drake Passage (∼ 3 Sv) and follow a narrow path through the Malvinas Current and the South Atlantic Current before entering the South Equa-torial Current over a broad longitudinal range in the east-ern part of the basin (Fig. 5b), as roughly described in Spe-ich et al. (2001). However, as already indicated by the rela-tively broad transit time distribution, there are many ent pathways for DP waters towards the NBC with differ-ent side tracks: some particles amounting to ∼ 1 Sv follow the ACC into the eastern part of the basin, eventually make a little detour into the Agulhas basin, and finally enter the South Equatorial Current via the Benguela Current system. Approximately 1 Sv of DP waters is recirculated in the South Atlantic subtropical gyre at least once before finally entering the NBC.
A comparison of the DP particle distributions at the NBC section with the local Eulerian mean cross section velocities shows that DP particles can be found over the whole depth range and zonal extent of the NBC roughly proportional to the local current strength (Fig. 6d). The DP particle distri-bution at the source section, however, does not directly re-flect the Eulerian cross section flow through Drake Passage (Fig. 6b). The eastward ACC transport through Drake Pas-sage is known to occur mainly within two jets corresponding to the Subantarctic Front and the Polar Front (Cunningham et al., 2003; Firing et al., 2011). These two maxima are cap-tured in the model simulation, but only from the northern one
may virtual fluid particles directly enter the subtropical gyre and contribute to the South Atlantic branch of the AMOC’s upper limb. Particles that follow the ACC south of 53◦S east-ward beyond 35◦W have zero chance to enter the subtropi-cal gyre before leaving the Atlantic sector of the Southern Ocean south of Africa towards the Indian Ocean sector (at least in this model study). These imaginary borders also de-fine the separation between the direct and indirect cold water route, which in our study is located more eastern than re-ported by Speich et al. (2001), who identified it at about 50◦S and 50◦W. This difference is most probably again related to more diverse pathways in our higher-resolution model simu-lation.
When comparing the Lagrangian stream functions and depth distributions from the AC and DP contributions, it becomes apparent that the dominant spreading pathways of both contributions coincide in the horizontal as well as in the vertical plane within the subtropical gyre. However, the spreading of AC waters is concentrated in slightly more northern and shallower branches of the SEC than the spread-ing of DP waters. Consequently, within the NBC, AC waters dominate in the upper 400 m and DP waters below. The coin-ciding pathways indicate that both contributions potentially mix along their transit through the South Atlantic and may experience thermohaline property changes.
3.4 AMOC upper limb thermohaline property modification within the South Atlantic
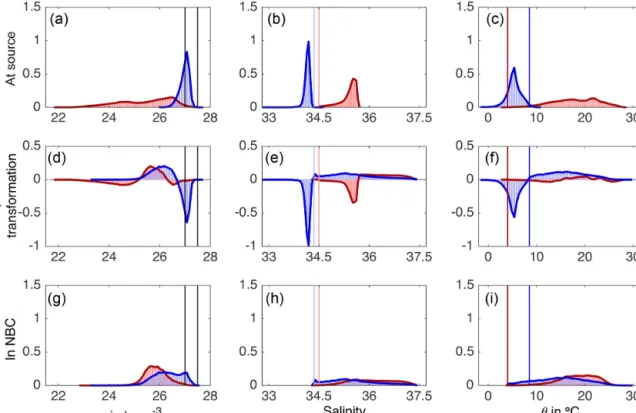
Figure 7a–d visualize the mean potential temperature (θ ) and salinity (S) characteristics of DP and AC waters at their respective source and within the NBC by means of his-tograms of relative transport-weighted particle frequency in θ–S space (0.5◦C ×0.05 bins). In its source regions, the DP contribution is relatively fresh (32.25 to 34.75) and cold (−2 to 11.0◦C) with potential density anomalies (σθ=ρθ−
1000 kgm−3; in the following units are dropped for better readability) between 25.9 and 27.8, whereas the AC
contri-S. Rühs et al.: Cold vs. warm water route 499
Figure 6. Depth distribution for (a) AC waters at source, (b) DP waters at source, (c) AC waters in NBC, and (d) DP waters in NBC as inferred from all 10 REF experiments: relative transport-weighted particle frequency per 0.1◦×50 m bin in percent (color shading); overlaid mean (2000–2009) Eulerian cross section velocities in meters per second (light grey contours; note the different contour intervals); and mean cumulative Lagrangian volume transport per 100 m depth bin in Sverdrups (bar graphs).
Figure 7. Thermohaline properties of waters with AC and DP origin inferred from all 10 REF experiments. (a–d) Mean potential temperature (θ ) and salinity (S) characteristics of AC and DP waters at their source and within the NBC: relative transport-weighted particle frequency per 0.5◦C × 0.1 psu bin in percent (color shading); initially, 99 % of the DP (AC) water volume can be found at temperatures colder (warmer) than 8.5◦C (4.0◦C) and at salinities lower (greater) than 34.45, as indicated by blue (red) lines. (e–g) Mean volume transport per density class (in 0.1 kg m−3bins) of AC (red) and DP (blue) waters at their source and within the NBC, as well as associated transformation in density space (bar graphs); potential density levels used to separate upper, intermediate, and deep waters are highlighted by solid black lines.
bution is more salty (34.30 to 35.75) and spans a broader temperature range (2.5 to 29.0◦C) with σ
θ between 21.7
and 27.7. Note that there is no clear separation of the two sources in temperature as the terminology cold and warm wa-ter routes may imply, since the AC contribution not only con-sists of warm surface waters, but also of colder central and intermediate waters (Beal et al., 2006; Speich et al., 2007; Biastoch and Böning, 2013). In our Lagrangian model anal-ysis 99 % of the DP (AC) contribution originally has temper-atures colder (warmer) than 8.5◦C (4.0◦C), and 75 % (11 %) of DP (AC) waters can be found in the respective shared tem-perature range from 4.0 to 8.5◦C. However, the AC and DP water contributions can be distinguished well by the salin-ity in their source regions: 99 % of the DP (AC) contribution originally has salinities lower (greater) than 34.45. Hence, we may consider fresh and salty routes as an alternative and more precise terminology, which also accounts for the rela-tive role of the two sources with respect to the salt–advection feedback. Yet, dependent on the specific research question, the mean temperature difference between the two may still be of (larger) importance. Therefore, we would recommend referring directly to the geographic origin to avoid ambigui-ties. Upon arrival in the NBC, fluid particles with DP origin cover nearly the same θ –S spectrum as particles with AC origin: temperatures from 3.5 to 30.0◦C and salinities from 34.25 to 37.60 (34.25 to 37.65 for AC waters), with corre-sponding σθ from 22.7 to 27.6 (23.0 to 27.6 for AC waters).
The comparison of the initial and final θ –S spectra shows that substantial thermohaline property modification does oc-cur on the transit through the South Atlantic. The bulk of waters entering the South Atlantic through AC and DP that later reaches the NBC becomes more salty during the tran-sit. Waters of DP origin additionally experience a substantial broadening of their temperature spectrum associated with a general warming.
These thermohaline property modifications are also even-tually associated with transformations in density space. To quantify those, we binned the partial transports of all parti-cles according to their potential density anomaly at their ori-gin (Fig. 7e) and upon arrival in the NBC (Fig. 7g) for each contribution separately. Then we compared the transport-weighted density distributions at the entry sections and the respective distributions in the NBC. The difference between the initial and final distributions quantifies the net transfor-mation of the bulk of water (Fig. 7f), which may be a result of multiple modification processes. We additionally repeated this analysis for respective subsets of upper (σθ <27.0) and
intermediate (27.0 < σθ<27.5) waters. The exact numbers
for the transformation analysis depend on the applied den-sity criteria. Here we chose to follow Macdonald (1993) and Holfort and Siedler (2001) for the definition of the separa-tion of upper and intermediate waters, since it fits with the simulated mean (2000–2009) thermohaline structure of the water column in the South Atlantic (Fig. 8). Other authors followed Roemmich (1983) and chose σθ =26.8, but in our
Figure 8. Mean (2000–2009) simulated Eulerian (a) salinity and (b) potential temperature θ sections at 34.5◦S (color shading); po-tential density anomalies are overlaid in grey contours – those used as a separation of upper, intermediate, and deep waters are in black.
simulation waters with 26.8 < σθ<27.0 seem to fall in the
upper water range with a still relatively large vertical gra-dient in temperature and salinity. The general tendencies of our transformation analysis stay robust with respect to small changes in these criteria (not shown) so that the results are worth a discussion. The AC contribution to the upper limb of the AMOC originally consisted of 5.7 Sv upper and 0.6 Sv in-termediate waters. These waters showed a net transformation to 5.6 Sv upper and 0.7 Sv intermediate waters upon arrival in the NBC. More specifically, 0.3 Sv of the upper waters became intermediate waters, and 0.2 Sv of the intermediate waters became upper waters (Table 1). Hence, the bulk of AC waters experiences a slight net density gain during the transit towards the NBC. The DP contribution to the upper limb of the AMOC originally consisted of 1.6 Sv upper and 3.1 Sv intermediate waters. These showed a net transforma-tion to 3.2 Sv upper and 1.5 Sv intermediate water upon ar-rival in the NBC. More specifically, 0.1 Sv of upper waters became intermediate waters, and 1.7 Sv intermediate waters became upper waters (Table 2). To sum it up, in contrast to AC waters, the bulk of DP waters experiences a net density loss during the transit towards the NBC.
Changes in temperature and salinity and thus density along volume transport pathways generally correspond to the mean effect of surface fluxes, such as direct warming by solar heat flux or precipitation and evaporation processes, and mixing with ambient waters due to parameterized and spurious tracer diffusion of the OGCM. The fact that both DP and AC waters show a salinification during their transit implies that they not only mix with each other, but that mixing with other ambient waters and/or surface fluxes may also play an important role.
S. Rühs et al.: Cold vs. warm water route 501
Table 1. Net water mass transformation of upper and intermediate waters with AC origin between their entry into the South Atlantic and arrival in the NBC in Sverdrups; water volumes without any net transformation into the other class are listed in brackets.
AC
Upper Interm. 6 NBC Upper (5.4) 0.2 5.6 Interm. 0.3 (0.4) 0.7
6 5.7 0.6 6.3
Table 2. Same as Table 1 but for waters with DP origin. DP
Upper Interm. 6 NBC Upper (1.5) 1.7 3.2 Interm. 0.1 (1.4) 1.5
6 1.6 3.1 4.7
To further investigate the transformation in the bulk AC and DP water volumes and to determine their origin, we as-sessed which particles reached the mixed layer on their tran-sit between the DP or AC and the NBC, and then analyzed the net transformation of waters with and without mixed layer contact separately. Following the criterion used during the OGCM integration and also adopted in comparable La-grangian studies (see Blanke et al., 2002; Tim et al., 2018), we assume a particle to have reached the mixed layer if its density (that equals the ambient density) differs by less than 0.01 kgm−3 from the density at 10 m of depth. During the transit through the South Atlantic the surface mixed layer is reached at least once by 66 % (3.1 from 4.7 Sv) and 49 % (3.1 from 6.3 Sv) of DP and AC waters, respectively. That implies that these waters most likely do gain their specific character-istics within the South Atlantic and – if adopting the common definition of a water mass as a body of water with a common formation history – are strictly speaking not water masses with Indian Ocean or Pacific origin as may be suggested by their prior classification as AC or DP waters.
Figure 9 maps the relative transport-weighted frequency of the position of the last mixed layer contact for particles on the transit between AC (left) or DP (right) and the NBC. Re-gions of high frequency can be interpreted as the most proba-ble formation regions for water masses of the NBC within the South Atlantic. Those can be found in the vicinity of mode water formation regions, as depicted in Hanawa and Talley (2001, hereafter H01) and Sato and Polito (2014, hereafter S14): in the eastern and southern subtropical gyre where east-ern subtropical mode water (ESTMW or SASTMW2 in H01 and S14, respectively) and southern subtropical mode water (SASTMW3 in S14) are formed, respectively, as well as east
of Drake Passage where subantarctic mode water (SAMW in H01) originates. Notably, the formation region of classi-cal western subtropiclassi-cal mode water (STMW or SASTMW1 in H01 and S14, respectively) located east of the western boundary current (that is, the Brazil Current) does not stand out in the frequency distribution. This suggests that western subtropical mode water is no major contributor to NBC wa-ters in the analyzed model simulation. A possible explanation for this could be that most western subtropical mode water gets re-entrained into the mixed layer in the eastern subtrop-ical gyre and thus becomes part of the eastern subtropsubtrop-ical mode water. In any case, our findings match those of Tim et al. (2018), who analyzed the same model simulation and found only a minor direct South Atlantic Central Water but strong eastern South Atlantic Central Water contribution to the upwelling water masses of Benguela. Relative high fre-quencies of last mixed layer contacts are further located at the subduction zones along the South Equatorial Current and in particular around 15◦S, which have been shown to be impor-tant source regions for the equatorward subsurface flow re-lated to the shallow overturning of the subtropical cell in the South Atlantic (Zhang, 2003; Schott et al., 2004; Hazeleger and Drijfhout, 2006).
The mixed layer contact of virtual fluid particles on their transit between the AC or DP and the NBC greatly impacts their characteristic properties. Most notably, the net trans-formation in density space of DP and AC waters (Fig. 7f) is almost completely captured by particles with mixed layer contact (Fig. 10d), whereas water property modifications as-sociated with particles without mixed layer contact are char-acterized by only minor changes in density space (Fig. 11d). Nearly all DP waters entering the South Atlantic in the up-per water range (1.5 Sv) and more than half of those entering the South Atlantic in the intermediate water range (1.6 from 3.1 Sv) reach the mixed layer at least once during their tran-sit. The bulk of these DP waters with mixed layer contact ex-periences a substantial salinification (when entering the At-lantic 95 % of the waters have salinities < 34.45, whereas upon arrival in the NBC 95 % of the waters have salinities >34.45) but even stronger warming during the transit. This results in a net decrease in density and a corresponding shift towards upper waters. From the AC contribution, 54 % (3.1 from 5.7 Sv) of waters entering the South Atlantic as upper waters reach the mixed layer during their transit (waters en-tering the intermediate water range do not reach the mixed layer). They enter the South Atlantic at a large range of rel-atively high temperatures, which hardly changes during the transit. However, like DP waters, AC waters with mixed layer contact experience a net salinification, resulting in a net in-crease in density. Since the coherent inin-crease in salinity of AC and DP waters cannot be found for waters without mixed layer contact, we attribute the salinification to the impact of average net evaporative surface fluxes over the subduction zones along the South Equatorial Current, as well as to
mix-Figure 9. Horizontal distribution of the position of the last mixed layer contact for particles on the transit between (a) AC or (b) DP and NBC inferred from all 10 REF experiments. Relative transport-weighted particle frequency per 2◦×2◦bin in percent (referring to the total number of particles that enter the mixed layer at least once during their transit; color shading); hatching highlights the most likely areas for the last mixed layer contact, encompassing 75 % of the transport associated with the respective set of particles entering the mixed layer.
Figure 10. Mean property modification of waters with AC and DP origin that enter the mixed layer at least once during their transit. Mean volume transport per density (a, d, g, 0.1 kg m−3bins), salinity (b, e, h, 0.05 psu bins), and temperature (c, f, i, 0.5◦C bins) class at source region (a–c) and in NBC (g–i), as well as volumetric property transformation (d–f) for waters of AC (red bars) and DP (blue bars) origin. From all 10 REF experiments only particle trajectories with at least one mixed layer contact during their transit are considered. Potential density levels used to separate upper, intermediate, and deep waters are highlighted by solid black lines; light blue (red) lines mark S values that constitute the upper (lower) limit for 95 % of the DP (AC) waters; dark blue (red) lines mark θ values that constitute the upper (lower) limit for 99 % of the DP (AC) waters (see Fig. 7).
ing with ambient subtropical upper-layer waters with high salinities.
Nearly half (1.5 from 3.1 Sv) of the DP waters that are entering the South Atlantic as intermediate waters, as well as all intermediate and 46 % (2.6 from 5.7 Sv) of the upper AC waters, do not experience any mixed layer contact
dur-ing their transit towards the NBC. Interestdur-ingly, AC and DP waters without mixed layer contact show opposite transfor-mations in temperature and salinity: DP waters are warming and becoming more saline, whereas AC waters are cooling and freshening. As a result the salinity and temperature dis-tributions of both components show new common peaks in
S. Rühs et al.: Cold vs. warm water route 503
Figure 11. Same as Fig. 10 but for waters with AC and DP origin that do not enter the mixed layer during their transit.
the temperature and salinity distributions at 3.5–4.0◦C and 34.35–34.40, respectively. This result fits with the idea that intermediate and central waters of western and eastern At-lantic origin mix in the eastern South AtAt-lantic and form new varieties of central and intermediate water (water masses in the same density range but with different temperature and salinity characteristics), as specifically shown by Rusciano et al. (2012) from observations and Rimaud et al. (2012) from a regional modeling experiment for different varieties of Antarctic Intermediate Water.
3.5 Potential decadal changes in AMOC’s upper limb connectivity measures
Figure 12 gives a first impression of the possible sensitiv-ity of the volumetric NBC decomposition to the strength of Agulhas leakage. The underlying data stem from the two ad-ditional sets of Lagrangian experiments for which particles were released in the NBC at 6◦S for years 1960 to 1969 (lowAL) and 2000 to 2009 (highAL) and then traced back-wards toback-wards the source sections (see Fig. 3) by cycling through the velocity data of each period for a maximum of 40 years (more details on the experiments can be found in Sect. 2.2).
We chose the 1960s and 2000s for our comparison, since both periods feature the same simulated Lagrangian mean NBC transport (23.1 Sv) and comparable upper limb trans-port (11.0 Sv in the 1960s and 12.0 Sv in the 2000s)
esti-mates, but are associated with notably different estimated mean values of Agulhas leakage that show an increase from 8.4 Sv in the 1960s to around 14.6 Sv in the 2000s (note that the mean Agulhas leakage transport for the 2000s has been calculated based only on the annual mean values from 2000 to 2005, since the applied methodology of Agulhas leakage estimation required a potential particle tracking towards the Good Hope section for at least 4 years, and the employed model simulation only provided velocity output until 2009; see also Appendix A). The fundamental question is whether this increase in Agulhas leakage induced a corresponding in-crease in the AC contribution to the upper limb of the AMOC in the tropics (and further north).
In highAL the AC contribution amounts to 7.0 Sv, which constitutes 30 % of the total NBC transport and 58 % of the AMOC upper limb transport at 6◦S, whereas the DP only contributes 4.1 Sv, which constitutes 18 % and 34 % of the NBC and upper limb transports, respectively. In con-trast, in lowAL the DP contribution slightly exceeds the AC contribution. The AC contribution only amounts to 5.1 Sv, which is 22 % of the total NBC transport and 46 % of the AMOC upper limb transport at 6◦S, whereas the DP
contri-bution provides 5.3 Sv, which constitutes 23 % and 48 % of the NBC and upper limb transports, respectively. In highAL and lowAL on average 2.1 and 2.8 Sv remained in the do-main after 40 years of integration, respectively, a large part of which would probably additionally add to the DP con-tribution under longer integration times (see Sect. 3.1). The
Figure 12. Sensitivity of NBC sources to the strength of Agul-has leakage (AL): mean volumetric contributions of the individual sources to the NBC inferred from (a) lowAL and (b) highAL (see Fig. 3); (c) interannual variability of AL transport as derived by Schwarzkopf et al. (2019, see Appendix A).
higher number of unsampled particles in lowAL can be re-lated to the generally longer transit time from DP to NBC than from AC to NBC. A circulation pattern with a more pronounced DP contribution is associated with a shift of the total transit time distribution, that is, a transit time distribu-tion inferred from particles from all sources, towards longer timescales (not shown); it consequently yields more particles still in the domain after 40 years of integration. These esti-mates suggest that the increase in Agulhas leakage between the 1960s and 2000s is indeed reflected in an increase in the AC contribution to the AMOC’s upper limb transport and is further accompanied by a decrease in the DP contribution.
The increase in the AC contribution to the AMOC’s up-per limb in the tropics is, however, not directly proportional to the increase in Agulhas leakage but weaker (1.9 Sv com-pared to 6.2 Sv, respectively). This fits with the findings of Durgadoo (2013), who assessed the impact of Southern Hemisphere wind changes on the strength and fate of Ag-ulhas leakage. He showed that the simulated wind-driven in-crease in Agulhas leakage goes along with a strengthening of the South Atlantic subtropical gyre. This strengthening leads to a favored recirculatory route at the bifurcation point of the South Equatorial Current at the coast off Brazil. Conse-quently, less Agulhas leakage water feeds into the NBC as part of the large-scale overturning. The strengthened recircu-latory route could also be regarded as one potential reason for the simulated decrease in the DP contribution. However, due to the conceptual limitations of the idealized analysis pre-sented here, the results are not yet conclusive and should be rather regarded as a motivation for future studies.
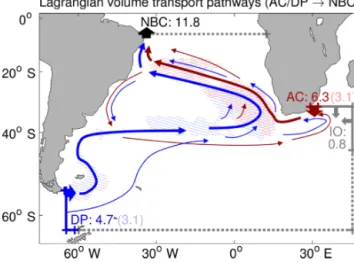
Figure 13. Summary of the AMOC’s upper limb “cold”(DP, blue) and “warm” (mainly AC, red) water routes inferred from O(106) simulated Lagrangian particle trajectories (REF experiments): ma-jor (thick arrows) and minor (thin arrows) advective pathways; La-grangian mean cross section transports in Sverdrups (numbers); respective volumetric contribution of particles entering the mixed layer at least once during the transit (numbers in brackets); and most likely areas of last mixed layer contact (hatching, same as in Fig. 9).
4 Summary and conclusions
In this study we revisited the relative importance of (i) the relatively warm and salty waters entering the South Atlantic from the Indian Ocean mainly via the Agulhas Current (AC) system, commonly referred to as the warm water route, and (ii) the colder and fresher waters entering directly from the Pacific through Drake Passage (DP), termed the (direct) cold water route, for the northward volume transport and thermo-haline properties of the upper limb of the Atlantic Meridional Overturning Circulation (AMOC) in the tropical South At-lantic.
To do so, we performed Lagrangian analyses using 5 d mean output from a hindcast experiment (1958–2009) with the high-resolution (1/20◦) ocean general circulation model INALT20. We employed the Lagrangian tool ARIANE to calculate O(106)advective volume transport trajectories as well as along-track thermohaline property changes between the two source regions and the North Brazil Current (NBC), which channels the upper limb flow in the tropics. The main results in terms of connecting pathways, associated volume transports, and major areas of thermohaline property mod-ifications through mixed layer contact are summarized in Fig. 13.
Even though our results generally agree with the prevailing conception that the AC contribution with around 50 % is the major source for the upper limb transport of the AMOC (and yields together with other minor Indian Ocean contributions a total warm water route contribution of 60 %), they also sug-gest a non-negligible DP or cold water route contribution