HAL Id: hal-02419377
https://hal.archives-ouvertes.fr/hal-02419377
Submitted on 7 Jan 2020
HAL is a multi-disciplinary open access
archive for the deposit and dissemination of
sci-entific research documents, whether they are
pub-lished or not. The documents may come from
teaching and research institutions in France or
abroad, or from public or private research centers.
L’archive ouverte pluridisciplinaire HAL, est
destinée au dépôt et à la diffusion de documents
scientifiques de niveau recherche, publiés ou non,
émanant des établissements d’enseignement et de
recherche français ou étrangers, des laboratoires
publics ou privés.
A reduction strategy to simplify a model of sugar
metabolism for application to a large panel of genotypes
Hussein Kanso, Bénédicte Quilot-Turion, Mohamed-Mahmoud Memah,
Olivier Bernard, Jean-Luc Gouzé, Valentina Baldazzi
To cite this version:
Hussein Kanso, Bénédicte Quilot-Turion, Mohamed-Mahmoud Memah, Olivier Bernard, Jean-Luc
Gouzé, et al.. A reduction strategy to simplify a model of sugar metabolism for application to a large
panel of genotypes. FOSBE 2019 - 8th Conference on Foundations of Systems Biology in Engineering,
IFAC, Oct 2019, Valencia, Spain. �hal-02419377�
A reduction strategy to simplify a model of
sugar metabolism for application to a large
panel of genotypes
Hussein Kanso∗,∗∗ B´en´edicte Quilot-Turion∗ Mohamed-Mahmoud Memah∗∗ Olivier Bernard∗∗∗
Jean-Luc Gouz´e∗∗∗ Valentina Baldazzi∗∗,∗∗∗
∗ INRA, UR1052, GAFL France ∗∗INRA, UR1115, PSH France
∗∗∗University Cˆote d’Azur , Inria, INRA, CNRS, ISA, UPMC Univ
Paris 06, BIOCORE, France
1. INTRODUCTION
In the context of agronomy, increasing efforts are made to select varieties that respond to a large panel of criteria, including abiotic and biotic stress tolerance, increased yield and quality of food products. Genotype-phenotype models have been considered as the tools of the future since they can help to test the performance of new genotypes under different environment and management conditions. A kinetic model of sugar metabolism has been developed by Desnoues et al. (2018) to simulate the accumulation of different sugars (sucrose, glucose, fructose and sorbitol) during peach fruit development as a set of parametric ordinary differential equations (ODEs)
dx
dt = f (x(t), I(t), v(t), p), t = DAB, (1)
x(t0) = x0, (2)
where t is the independent time variable in days after bloom (DAB); x ∈ R10 is the concentration vector of
metabolites in the corresponding intra-cellular compart-ment and x0 ∈ R10 in Eq(2) is the vector of the
cor-responding initial values. I ∈ R is time-dependent in-put of carbon from the plant and v ∈ R7 is the vector
of time-dependent measured enzymatic activities; p = (p1, . . . , p23) is the vector of parameters defining the
re-action rates; f (x(t), I(t), v(t), p) of Eq.(1) describes the change in compounds concentrations. The model correctly accounts for annual variability and for the genotypic vari-ations observed in ten peach genotypes issued from a progeny of 106 genotypes. Two major drawbacks of this model are (a) the number of parameters to estimate and (b) its integration time that can be costly due to non-linearities and time-dependent input functions. Together, these issues hamper the use of the model for the whole genotypic progeny, for which few data are available (Six data or less by sugar).
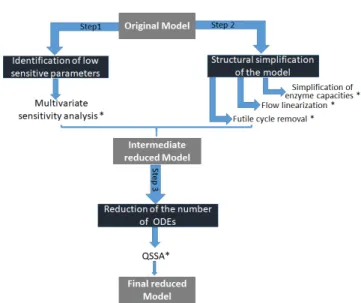
Several reduction and approximation approaches exist in literature, each one addressing a specific aspect of model complexity (Wei and Kuo, 1969; Cariboni et al., 2007; Heinrich and Schuster, 1996; Wang et al., 2007). In this work, we present a reduction strategy that combines differ-ent methods in several parallel steps (Fig. 1). The purpose
Fig. 1. Schema of Model Reduction. (*) The tested reduc-tion is accepted or rejected based on two comparison criteria (∆AIC= AICreduced model−AICoriginal model
value and integration time)
is to obtain a simplified model showing comparable predic-tions as the original model while reducing its integration time and number of parameters.
2. METHODS
First, multivariate sensitivity analysis (Lamboni et al., 2009) was applied to identify those parameters having a significant influence on the outputs of the model, over the whole dynamics and for all tested genotypes.
Second, we operated three structural simplifications in terms of network and reactions rates to reduce the com-plexity of the model:
• Removing temporal and phenotypic effects of the en-zymes capacities: In the original model some of the enzymatic capacities were assumed to vary over time and/or depending on the phenotypic group, according to experimental evidences (Desnoues et al. (2014)).
We systematically tested the possibility of removing these effects.
• Flow linearization: Enzymatic reactions were origi-nally represented by an irreversible Michaelis-Menten equation. The objective of this step was to test a linear approximation to improve the efficiency of the numerical simulation.
• Removing futile cycles: In the model, the presence of internal cycles lead to the appearance of thermo-dynamically unfeasible loops i.e. reactions that run simultaneously in opposite directions and have no overall effect on the exchange fluxes of the system. We removed each futile cycle by eliminating one of its building reactions, while preserving the net exchange flux of the system.
Third, timescale-based approaches and quasi-steady-state approximation (L´opez Zazueta et al., 2018; Heinrich and Schuster, 1996) were applied to reduce the number of ODEs of the model and obtain the final reduced model. The quality of individual and combined reduction steps was systematically evaluated with respect to the original model according to two criteria of major importance for our application: the Akaike Information Criterium (AIC) and the integration time.
3. RESULTS AND CONCLUSIONS
Results from the reduction steps were combined into an final reduced model. This model has only 9 parameters to be estimated, linear flows, 9 ODEs and only one temporal enzymatic capacity, common to all genotypes. Comparison between the reduced and the original model showed an equivalent fit quality (Table 1) and confirmed a strong benefice for most genotypes, both in term of AIC score and integration time (Fig. 2). The validity of our reduction strategy was further verified by the calibration of ten new genotypes of the inter-specific peach progeny, for which few data are available. Results showed a satisfactory agreement between model and experimental data (Fig. 3) opening new promising perspectives for genetic studies and virtual breeding.
Fig. 2. Left: ∆AIC between final reduced and original
models. Right: Gain in the integration time (%) between original and final reduced models for ten genotypes studied
REFERENCES
Cariboni, J., Gatelli, D., Liska, R., and Saltelli, A. (2007). The role of sensitivity analysis in ecological modelling. Ecological Modelling, 203(1), 167 – 182.
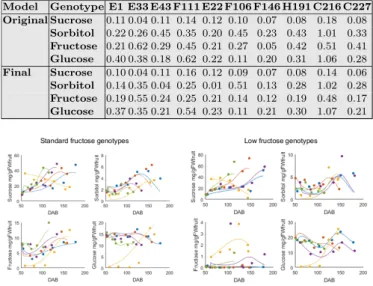
Table 1. NRMSE between model simulation and experimental data for the final reduced and original models. Calculated values of the normalized root mean squared error (NRMSE) are presented for each genotype, the four
sug-ars separately.
Model Genotype E1 E33 E43 F111 E22 F106 F146 H191 C216 C227 Original Sucrose 0.11 0.04 0.11 0.14 0.12 0.10 0.07 0.08 0.18 0.08 Sorbitol 0.22 0.26 0.45 0.35 0.20 0.45 0.23 0.43 1.01 0.33 Fructose 0.21 0.62 0.29 0.45 0.21 0.27 0.05 0.42 0.51 0.41 Glucose 0.40 0.38 0.18 0.62 0.22 0.11 0.20 0.31 1.06 0.28 Final Sucrose 0.10 0.04 0.11 0.16 0.12 0.09 0.07 0.08 0.14 0.06 Sorbitol 0.14 0.35 0.04 0.25 0.01 0.51 0.13 0.28 1.02 0.28 Fructose 0.19 0.55 0.24 0.25 0.21 0.14 0.12 0.19 0.48 0.17 Glucose 0.37 0.35 0.21 0.54 0.23 0.11 0.21 0.30 1.07 0.21
Fig. 3. Evolution of sugar concentration (mg gF W−1) during fruit development (DAB, days after bloom) for ten newly calibrated genotypes. Dots represent experimental data, lines are simulations obtained with the reduced model. Left: standard fructose genotypes, right: low fructose genotypes
Desnoues, E., G´enard, M., Quilot-Turion, B., and Bal-dazzi, V. (2018). A kinetic model of sugar metabolism in peach fruit reveals a functional hypothesis of a markedly low fructose-to-glucose ratio phenotype. The Plant Journal, 94(4), 685–698.
Desnoues, E., Gibon, Y., Baldazzi, V., Signoret, V., G´enard, M., and Quilot-Turion, B. (2014). Profiling sugar metabolism during fruit development in a peach progeny with different fructose-to-glucose ratios. BMC Plant Biology, 14(1), 336.
Heinrich, R. and Schuster, S. (1996). The regulation of cellular systems. Chapman and Hall.
Lamboni, M., Makowski, D., Lehuger, S., Gabrielle, B., and Monod, H. (2009). Multivariate global sensitivity analysis for dynamic crop models. Field Crops Research, 113(3), 312–320.
L´opez Zazueta, C., Bernard, O., and Gouz´e, J.L. (2018). Analytical reduction of nonlinear metabolic networks accounting for dynamics in enzymatic reactions. Com-plexity, 2018.
Wang, F.S., Ko, C.L., and Voit, E.O. (2007). Kinetic mod-eling using S-systems and lin-log approaches. Biochem. Eng. J., 33(3), 238–247.
Wei, J. and Kuo, J.C.W. (1969). Lumping analysis in monomolecular reaction systems. analysis of the exactly lumpable system. Industrial & Engineering Chemistry Fundamentals, 8(1), 114–123.