HAL Id: insu-01300203
https://hal-insu.archives-ouvertes.fr/insu-01300203
Submitted on 27 Nov 2020
HAL is a multi-disciplinary open access
archive for the deposit and dissemination of
sci-entific research documents, whether they are
pub-lished or not. The documents may come from
L’archive ouverte pluridisciplinaire HAL, est
destinée au dépôt et à la diffusion de documents
scientifiques de niveau recherche, publiés ou non,
émanant des établissements d’enseignement et de
Evolution of the Dust Size Distribution of Comet
67P/Churyumov–Gerasimenko from 2.2 au to Perihelion
Marco Fulle, Francesco Marzari, V. Della Corte, Sonia Fornasier, H. Sierks, A.
Rotundi, C. Barbieri, Philippe L. Lamy, R. Rodrigo, D. Koschny, et al.
To cite this version:
Marco Fulle, Francesco Marzari, V. Della Corte, Sonia Fornasier, H. Sierks, et al.. Evolution of the
Dust Size Distribution of Comet 67P/Churyumov–Gerasimenko from 2.2 au to Perihelion. The
Astro-physical Journal, American Astronomical Society, 2016, 821 (1), 14 p. �10.3847/0004-637X/821/1/19�.
�insu-01300203�
Evolution of the dust size distribution of Comet
67P/Churyumov-Gerasimenko from 2.2 AU to perihelion
M. Fulle
1fulle@oats.inaf.it
F. Marzari
2, V. Della Corte
3, S. Fornasier
4, H. Sierks
5, A. Rotundi
3,6, C. Barbieri
7, P. L.
Lamy
8, R. Rodrigo
9,10, D. Koschny
11, H. Rickman
12,13, H. U. Keller
14, J. J.
L´
opez–Moreno
15, M. Accolla
16, J. Agarwal
5, M. F. A’Hearn
17, N. Altobelli
18, M. A.
Barucci
4, J.–L. Bertaux
19, I. Bertini
20, D. Bodewits
17, E. Bussoletti
6, L. Colangeli
11, M.
Cosi
21, G. Cremonese
22, J.–F. Crifo
19, V. Da Deppo
23, B. Davidsson
12, S. Debei
24, M. De
Cecco
25, F. Esposito
26, M. Ferrari
3, F. Giovane
27, B. Gustafson
28, S. F. Green
29, O.
Groussin
8, E. Gr¨
un
30, P. Gutierrez
15, C. G¨
uttler
5, M. L. Herranz
16, S. F. Hviid
31, W. Ip
32,
S. L. Ivanovski
3, J. M. Jer´
onimo
15, L. Jorda
8, J. Knollenberg
31, R. Kramm
5, E. K¨
uhrt
31,
M. K¨
uppers
18, L. Lara
15, M. Lazzarin
7, M. R. Leese
29, A. C. L´
opez-Jim´enez
15, F.
Lucarelli
6, E. Mazzotta Epifani
33, J. A. M. McDonnell
29,34,35, V. Mennella
26, A. Molina
36,
R. Morales
15, F. Moreno
15, S. Mottola
31, G. Naletto
20,24,37, N. Oklay
5, J. L. Ortiz
15, E.
Palomba
3, P. Palumbo
6,3, J.–M. Perrin
19,38, F. J. M. Rietmeijer
39, J. Rodr´ıguez
15, R.
Sordini
3, N. Thomas
40, C. Tubiana
5, J.–B. Vincent
5, P. Weissman
41, K.–P. Wenzel
11, V.
Zakharov
4, J. C. Zarnecki
10,29ABSTRACT
The Rosetta probe, orbiting Jupiter-family comet 67P/Churyumov–Gerasimenko, is detecting individual dust particles of mass larger than 10−10 kg by means of the GIADA dust collector
and the OSIRIS WAC and NAC cameras since August, 2014, till September, 2016. Single dust particle detections allow us to estimate the anisotropic dust flux from 67P, infer the dust loss rate and size distribution at the sunlit nucleus surface, and look if 67P dust size distribution evolves in time. The Rosetta orbiter velocity, relative to 67P, is much lower than the dust velocity measured by GIADA, thus dust counts when GIADA is nadir–pointing will directly provide the dust flux. In OSIRIS observations, the dust flux is derived from the measurement of the dust space density close to the spacecraft. Under the assumption of radial expansion of the dust cloud, observations in the nadir direction provide the distance of the particles by measuring their trail length, with a parallax baseline determined by the motion of the spacecraft. The dust size distribution at sizes > 1 mm observed by OSIRIS is consistent with a differential power index = –4, which was derived from models of the 67P trail. At sizes < 1 mm, the size distribution observed by GIADA shows a strong time evolution, with a differential power index drifting from –2 beyond 2 au, to –3.7 at perihelion, in agreement with the evolution derived from coma and tail models based on ground–based data. The nucleus refractory–to–water mass ratio is close to six during the entire inbound orbit.
Subject headings: comets: general — comets: individual (67P/Churyumov-Gerasimenko) — space vehi-cles: instruments
1
INAF – Osservatorio Astronomico, Via Tiepolo 11, I-34143 Trieste Italy
2Department of Physics, University of Padova, 35131,
Padova, Italy
3
INAF - Istituto di Astrofisica e Planetologia Spaziali, Via Fosso del Cavaliere, 100, 0133, Rome, Italy
4
LESIA, Observatoire de Paris, PSL Research Univer-sity, CNRS, Univ. Paris Diderot, Sorbonne Paris Cit´e, UPMC Univ. Paris 06, Sorbonne Universit´es, 5 Place J. Janssen, 92195 Meudon Pricipal Cedex, France
5
Max-Planck-Institut f¨ur Sonnensystemforschung, Justus-von-Liebig-Weg, 3, 37077, G¨ottingen, Germany
6
Universit´a degli Studi di Napoli Parthenope, Dip. di Scienze e Tecnologie, CDN IC4, 80143, Naples, Italy
7Department of Physics and Astronomy, Padova
Uni-versity, Vicolo dell’Osservatorio 3, 35122, Padova, Italy
8
Laboratoire d’Astrophysique de Marseilles, UMR 7326, CNRS & Aix Marseille Universit´e, 13388 Marseilles Cedex 13, France
9Centro de Astrobiologia (INTA-CSIC), 28691
Vil-lanueva de la Canada, Madrid, Spain
10International Space Science Institute, Hallerstrasse 6,
3012, Bern, Switzerland
11
ESA – ESTEC, Scientific Support Office, European Space Agency, Keplerlaan 1, 2201 AZ Noordwijk, The Netherlands
12Department of Physics and Astronomy, Uppsala
Uni-versity, Box 516, 75120, Uppsala, Sweden
13
PAS Space Research Center, Bartycka 18A, PL-00716 Warszawa, Poland
14
Institute for Geophysics and Extraterrestrial Physics, TU Braunschweig, 38106, Germany
15Instituto de Astrof´ısica de Andaluc´ıa (CSIC), Glorieta
de la Astronom´ıa s/n, 18008 Granada, Spain
16
INAF – Osservatorio Astrofisico di Catania, Via Santa Sofia 78, 95123, Catania, Italy
17
Department of Astronomy, University of Maryland, College Park, MD, 20742-2421, USA
18ESA–ESAC, Camino Bajo del Castillo, s/n., Urb.
Villafranca del Castillo, 28692 Villanueva de la Canada, Madrid, Spagna
19
LATMOS, CNRS/UVSQ/IPSL, 11 boulevard d’Alembert, 78280, Guyancourt, France
20
University of Padova, CISAS, via Venezia 15, 35100 Padova, Italy
21Selex–ES, Via A. Einstein, 35, 50013 Campi Bisenzio
FI, Italy
22
INAF – Osservatorio Astronomico di Padova, Vicolo dell’Osservatorio 5, 35122, Padova, Italy
23
CNR–IFN UOS Padova LUXOR, via Trasea 7, 35131 Padova, Italy
24Department of Mech. Engineering - University of
Padova, via Venezia 1, 35131 Padova, Italy
25
UNITN, Universit di Trento, via Mesiano, 77, 38100 Trento, Italy
26
INAF - Osservatorio Astronomico di Capodimonte,
1. Introduction
The size distribution of dust particles present on the nucleus or embedded in the first few me-ters below the surface is a fundamental parame-ter in various physical processes occurring on a comet. For instance, a different size distribution in the northern and southern comet hemi–nuclei, impacting the thermal properties and the porosity of the nucleus, may drive the outgassing time evo-lution. The dust size distribution can be measured by counting the pebbles on the surface (Mottola et al. 2015), or by measuring the dust flux in the coma using dust detectors, and using optical im-ages of single particles (Rotundi et al. 2015). A comparison between these two size distributions, both defined at the nucleus surface, may allow us to infer information on the physical processes of competing dust release and dust fall–back onto the nucleus surface. In the case of 67P, these two size distributions maintain the same slope for particles
Salita Moiariello, 16, 80133, Naples, Italy
27Virginia Polytechnic Institute and State University,
Blacksburg, VA 24061, USA
28
University of Florida, Gainesville, Florida, 32611, USA
29
Planetary and Space Sciences, Department of Physical Sciences, The Open University, Milton Keynes, MK7 6AA, UK
30Max-Planck-Institut fuer Kernphysik,
Saupfercheck-weg 1, 69117 Heidelberg, Germany
31
Institute of Planetary Research, DLR, Rutherford-strasse 2, 12489, Berlin, Germany
32Institute for Space Science, Nat. Central Univ., 300
Chung Da Rd., 32054, Chung-Li, Taiwan
33INAF - Osservatorio Astronomico di Roma, Via di
Frascati, 33, Monte Porzio Catone, Rome, Italy
34
The University of Kent, School of Physical Sciences, Canterbury, Kent, CT2 7NZ, UK
35
UnispaceKent, Canterbury, Kent, CT2 8EF, UK
36Dep. de Fsica Aplicada, Universidad de Granada,
Facultad de Ciencias, Avda. Severo Ochoa, s/n, 18071, Granada, Spain
37
Dept. of Information Engineering – Padova University, via Gradenigo 6, 35131 Padova Italy
38
Observatoire de Haute Provence OSU Pythas UMS 2244 CNRS-AMU, 04870 Saint Michel lObservatoire, France
39
Department of Earth and Planetary Sciences, MSC03 2040, 1–University of New Mexico, Albuquerque, NM 87131–0001, USA
40Physikalisches Institut, Sidlerstrasse 5, University of
Bern, 3012, Bern, Switzerland
41Planetary Science Institute, 1700 East Fort Lowell,
ranging from 1 mm to a few meters: a differential power index = –3.8 on smooth terrains at sizes above a few cm (Mottola et al. 2015) and a dif-ferential power index of –4 for sizes below a few cm (Rotundi et al. 2015). The remarkable agree-ment between the slopes of the two distributions suggests that no significant selection processes af-fect either the dust release or the dust fall–back between sizes of 1 mm and a few meters. Dust re-lease and fall–back, also defined as aeolian transfer of dust across the nucleus surface (Thomas et al. 2015), are time–dependent because they depend on the local gas loss rate from the nucleus sur-face. The local outgassing in turn depends on the local illumination of the nucleus surface, which de-pends on the nucleus topography, the heliocentric distance, and on the nucleus seasons due to the obliquity of the spin axis. This implies that also the surface dust size distribution extracted from data collected in the coma should strongly depend on time.
Inverse tail models (Fulle 2004) allow us to in-fer the time evolution of the dust size distribution from ground–based data. This model, applied to 2P/Encke (Epifani et al. 2001), has evidenced strong changes in the slope of the dust size dis-tribution. In the time interval from 20 to 3 days before perihelion, the differential power index is constant at –3. Then, it jumps down to –4, and remains constant at –4 up to 23 days after peri-helion. Then, it jumps back to –3, and remains constant at –3 during 3 months after perihelion. Comet 2P/Encke is one of the few Jupiter Fam-ily Comets with known equinox times, extracted by models of the nucleus non-gravitational forces. The equinoxes of comet 2P occur on 3 days be-fore, and on 23 days after perihelion (Sekanina 1988). The dust size distribution of comet 2P is much steeper during the short summer at perihe-lion than during the longer apheperihe-lion winter, show-ing that the northern and southern hemi–nuclei of 2P/Encke are covered by dust of significantly dif-ferent sizes. Models applied to ground–based ob-servations indicate that comet 67P shows a sim-ilar behaviour, with the power index of the dif-ferential dust size distribution (at sizes < 1 mm) changing from –3.0 before, to –4.2 after perihelion (Fulle et al. 2010). Comet 67P equinoxes occur at 1.7 au inbound, and at 2.6 au outbound. The ground–based data taken into account to extract
the time evolution of 67P size distribution (Fulle et al. 2010) stop at 2.6 au outbound. These facts indicate that a time evolution of 67P dust size dis-tribution linked to the nucleus seasons (similar to what occurs for comet 2P/Encke) may be consis-tent with available ground–based data: 67P dif-ferential dust size distribution (at sizes < 1 mm) may have a power index of –4.2 during the short perihelion summer (from 1.7 au inbound to 2.6 au outbound), and a power index of –3.0 during the long aphelion winter (from 2.6 au outbound to 1.7 au inbound).
The Rosetta mission, following 67P comet nucleus from August 2014 (3.6 au inbound) to September 2016 (3.6 au outbound), offers a unique opportunity to verify if 67P dust size distributions evolve in time, and if this evolution is due to 67P nucleus seasons. Detections of dust particles by the GIADA instrument (Colangeli et al. 2007), (Della Corte et al. 2014), and by the OSIRIS NAC camera (Keller et al. 2007) in 67P coma have already allowed us to measure the dust size distribution over 8 mass bins, from 10−10to 10−2
kg when the comet was between 3.6 and 3.4 au inbound (Rotundi et al. 2015). The measure-ments have confirmed the predictions of tail mod-els (Fulle et al. 2010): the dust size distribution shows a knee at about 1 mm (i.e. at about 10−6
kg), with a differential power index of –4 at sizes larger than 1 mm, and close to –2 at smaller sizes. The bulk densities of the particles collected by GIADA, between 103and 3 × 10³kg m−3, suggest
that most of the dust released from 67P consists of compact particles (Rotundi et al. 2015). An-other smaller population of fluffy particles may account for about 15% of the coma brightness from 10−11 to 10−6 kg (Fulle et al. 2015), thus
explaining the power index = –3 obtained from ground–based observations (Fulle et al. 2010). GIADA data suggest a significant bulk density gap between the two populations: fluffy particles have densities even lower than 1 kg m−3, and have
always been detected as short–lasting showers of single detections, resulting from the fragmenta-tion of fragile parents at the interacfragmenta-tion with the spacecraft electric field (Fulle et al. 2015).
In this paper, we extend the results ob-tained beyond 3.4 au inbound (Rotundi et al. 2015) analysing the measurements of GIADA and OSIRIS instruments from 2.2 au to perihelion, a
time period when 67P crossed the spring equinox. GIADA data have shown that in 67P the ejec-tion of compact particles is strongly anisotropic: it is confined within the sunlit hemi–nucleus, thus maximised when the Sun–67P–Rosetta an-gle (phase anan-gle α) is small (Della Corte et al. 2015). The Rosetta spacecraft has spent most of its time in terminator orbits (α = 90 deg), where the dust flux is much lower than at lower phase angles. In order to extract a significant dust loss rate, we consider here dust observations performed at phase angles α < 90 deg. The large nucleus– Rosetta distances maintained during most of 2015 implied very low dust fluxes at the spacecraft. Thus, good statistics of GIADA detections re-quired integration periods at low phase angles at least a week long. We complement GIADA dust counts with detections of individual larger parti-cles by OSIRIS cameras occurred during the same periods. All these conditions have been fulfilled during a few weeks in February (2.2 au inbound), in March 2015 (2.1 au inbound), and then at the end of August 2015 (perihelion, Tab. 1).
2. OSIRIS data
Photometry of individual dust particles de-tected by OSIRIS cameras provides their cross section (times the albedo times the phase func-tion) if the particle distance can be determined by means of parallax. OSIRIS observations by means of the Narrow Angle Camera (NAC, pixel size = 3.8 arcsec) and Wide Angle Camera (WAC, pixel size = 20.5 arcsec) actually provide three inde-pendent parallax measurements, linked to three different baselines. The first baseline is the size of OSIRIS optics (≈ 0.1 m): when a particle is closer than about 200 m in WAC images (about 1 km in NAC images), the particle appears out of focus, and the size of the out-of-focus spot pro-vides the particle distance. The second baseline is the distance between the optical axes of WAC and NAC cameras (≈ 1 m): when the same particle is detected at the same time by NAC and WAC, its distance is provided by its different position in NAC and WAC images with respect to field stars. These two first techniques sample a small coma volume around the spacecraft, too small to provide significant statistics at dust mass bins sig-nificantly larger than those sampled by GIADA. The third technique allows us to sample much
larger distances, but is based on the assumption that the dust motion is mostly radial from the nucleus, a condition that is usually satisfied in the sun-faced coma at small phase angles. If the dust motion is mostly radial from the nucleus, then observations performed in the nadir direc-tion (usually with the nucleus itself in the image center) or in the anti–nadir direction minimize the apparent dust motion in the sky due to the dust velocity. In these conditions, most of the appar-ent dust motion is due to the spacecraft motion. The sky–projected spacecraft velocity vsc(Tab. 1)
provides the third parallax baseline, which is given by the OSIRIS exposure time times vsc. Usually
this baseline is much longer than those provided by the first two parallax techniques, and allows us to sample all the dust mass bins up to the largest ejected masses (Rotundi et al. 2015).
Nadir observations offer a further advantage. Since the nucleus is always present in the image, dust photometry can be measured in units of mean nucleus surface brightness. If we assume that the biggest dust particles and the nucleus surface have the same albedo times the phase function, then in-dividual particle photometry, coupled to the dis-tance determined by parallax, provides a direct es-timate of the particle cross section. Observations of a large number of individual particles by means of this technique allow us to cancel out random de-viations due to the non–radial dust motion from the nucleus surface, and due to different albedo between dust and nucleus. The small field of view of both NAC (2.2 deg) and WAC (11.6 deg) al-lows us to neglect effects due to the albedo phase function. We have identified the OSIRIS observa-tion sequences named DUST–MON (MON means monitoring) as the best ones suited for this pur-pose. They consist of sets of pairs of images at the wavelength of 649 nm (NAC) and 613 nm (WAC): a long exposure (many seconds) where the par-ticles are identified as long tracks, and a much shorter exposure wherein the dust particles appear as dots. The short exposure maximizes the S/N ratio of the particle over the diffuse coma back-ground and allows us to best perform the dust photometry. A dust particle is identified in the difference image between long and short exposures if the corresponding track and dot lie on the same straight line, and if the ratio of the track length in the first exposure and the gap between the track
edge (long exposure) and the dot (short exposure) corresponds to the ratio between the track expo-sure time and the time interval between the two exposures. These two conditions ensure that we are observing the same dust particle in both expo-sures. Examples of difference images where single particle detections have been performed are shown in Figs. 1 and 2 (here the long track appears black and the dot – first exposure – appears white) and Fig. 3 (here the long track – first exposure – ap-pears white and the dot apap-pears black) for the observations listed in Tab. 1. This detection tech-nique provides complete samples up to the faintest (i.e. smallest and closest) detected particles: the closer a particle, the longer and fainter its track on the long exposure image. NAC sequences can be used if R > 300 km, otherwise most of the image is polluted by the nucleus and the brightest inner coma. WAC camera was not available after July, 2015.
The full list of single particle detections is shown in Tab. 2 (2.2 au inbound), Tab. 3 (2.1 au inbound), and Tab. 4 (perihelion). The particle brightness I is expressed in mean nucleus surface brightness units, and directly provides the radius r of the equivalent sphere scattering the observed brightness (the assumed geometric optical scatter-ing is consistent with all the values r > 1 mm): I b2= πr2, where b is the pixel size at the particle
distance. The size b is provided by the parallax equation a b cos β = vsc, where a is the measured
particle apparent velocity in px s−1 units, vsc is
the spacecraft velocity projected on the sky, and β is the angle between the velocities vsc and a.
The angles β and γ (Tab. 2) allow us to esti-mate the dust radial velocity v by the equation v tan γ = vscsin β. The projection of the
space-craft velocity along the line of sight vscz (Tab. 1)
is always much smaller than the radial dust veloc-ity, and has been neglected. The assumption that the dust velocity is mostly radial from the nucleus requires that the particles move outwards with re-spect to the nucleus in the OSIRIS images. This condition is verified for most particles at 2.1 and 2.2 au, but not in the perihelion images. This may be due to the higher phase angle α (Tab. 1) at per-ihelion: close to terminator, the strong gradient of the gas density between nucleus day and night sides may introduce a significant tangential com-ponent in the dust velocity, directed towards the
nucleus night-side. In fact, most β values are pos-itive (the Sun is in the upper direction of Figs. 1, 2 and 3). The dust velocities provided by OSIRIS observations are much more uncertain at perihe-lion than at 2.1 and 2.2 au. Most β values at all heliocentric distances are below 20 deg, showing that the assumption that most of the dust appar-ent motion is due to the sky–projected spacecraft motion is always satisfied.
In order to extract the 67P dust mass distribu-tion, we have grouped the particle counts accord-ing to their mass. The results are shown in Tabs. 5, 6, 7 and 8. The number of counts per OSIRIS image pair and mass bin divided by the coma volume sampled by OSIRIS cameras provides the dust coma space density ρ. It depends on the largest distance D from the spacecraft at which a particle in each mass bin has been detected. This distance D is always much smaller than the space-craft distance from the nucleus R (Tab. 1), so that the dust coma density between R − D and R can be assumed as a constant quantity. In this case, when we approximate the dust ejection from 67P nucleus as a sun–faced hemisphere, the dust num-ber loss rate from the nucleus surface integrated in each mass bin is Qn = 2π R2 v ρ, where v is
the mean dust velocity in each mass bin, and the dust mass loss rate (and mass distribution at the nucleus surface) is Qm = m Qn, where m is the
mean dust mass in each mass bin. The 67P dust mass distribution is shown in Figs. 4, 5 and 6, for two values of the dust bulk density of 103 kg
m−3 and 3 × 10³ kg m−3, following the 67P dust
bulk density estimates provided by the GIADA measurements (Rotundi et al. 2015). In each mass bin, we also compute the mean dust cross section σ, which allows us to compute the quan-tity Af ρ = 2Ap Qn σ v−1, where Ap = 0.065 is
the geometric nucleus albedo at 649 nm (Fornasier et al. 2015), which provides the coma brightness contribution of each mass bin. The integral of Af ρ over all the mass bins can be compared to the same quantity provided by ground–based observations, to check if the mass bins sampled by OSIRIS and GIADA instruments provide a dominant or negli-gible coma brightness contribution, or if the 67P size distribution changes from nucleus distances R to the outer coma observed from ground.
3. GIADA data
GIADA characterises individual dust particles by means of two independent sensors. At the instrument entrance the particle crosses a laser curtain, and is detected by photoelectric sen-sors (GDS, Grain Detection System) registering a signal (proportional to the particle cross–section times the albedo) and the laser curtain crossing time. Then the particle hits the Impact Sensor (IS, with the same GDS cross section, A = 10−2
m2), which registers individual particle impact
momentum and its travel time from GDS to IS. The combination of GDS and IS measurements (GDS+IS particles) provides the particle mass and velocity, and constrains the particle bulk den-sity by means of calibration curves (Della Corte et al. 2016) derived on ground using cometary ana-logues (Ferrari et al. 2014). If the particle is too small to be detected by the GDS system, it may be detected by the IS sensor only (IS particles): in this case the particle momentum is converted to the mass assuming the mean value of the velocities of the GDS+IS particles in the same momentum bin, or assuming the velocities predicted by tail models (Fulle et al. 2010) if Ngds+is= 0 in that
mass bin. The spacecraft velocities listed in Tab. 1 are always much lower than the dust velocities measured by GIADA. In this condition, in the sun–faced coma (assumed to have uniform space density ρ), the dust flux from the nucleus surface corresponds to the dust flux at nadir–pointing GI-ADA scaled by the factor 2π R2/A. The dust
number loss rate at the nucleus surface per GI-ADA detection is Qn = 2π R2 [A ∆t]−1, where
∆t is the total dust collection time (Tabs. 5, 6, 7 and 8). In the same Tables, we show the mass loss rates Qm and the mean dust velocities
al-ready integrated in each mass bin, corresponding to the four GIADA collection periods considered in this paper: from 19 to 28 February 2015 (Tab. 5), from 13 to 17 March 2015 (Tab. 6), on 28 March 2015 (Tab. 7), and from 23 August to 3 September 2015 (Tab. 8). In Tab. 9 we show the data obtained during the first post–perihelion excursion at low phase angles (60 < α < 64 deg, 125 < R < 290 km). The R–values are too small for using the NAC DUST–MON sequences. The uncertainty affecting Af ρ and the loss rates mea-sured by GIADA and OSIRIS depends on the number of detections in each mass bin: an
esti-mate of the relative error is given by N−1/2 p and
by (Ngds+is+Nis)−1/2. The dispersion of the dust
velocities in Tabs. 2, 3 and 4 provides the error affecting the dust velocities measured by OSIRIS, close to 30%. The relative error of the dust veloc-ities provided by each GDS+IS detection is below 10%.
4. Loss rate of boulders at perihelion The 67P dust mass distribution at 2.2 au, 2.1 au and perihelion are shown in Figs. 4, 5 and 6, respectively. The dust mass distribution ob-served by GIADA (smaller mass bins) and OSIRIS (larger mass bins, with a gap of one or two bins in between) are compared to the dust mass distri-butions from ground–based observations (Fulle et al. 2010). These predictions assumed two values of the dust bulk density (102 kg m−3 and 103 kg
m−3) and of the dust geometric albedo (Ap= 0.02
and Ap= 0.06). In Figs. 4, 5 and 6, a dust mass
distribution constant in all mass bins corresponds to a power law for the differential size distribution with index –4; an index +1 in Figs. 4, 5 and 6 cor-responds to a differential power index = –3, and so on. The cut–off at the largest masses observed by OSIRIS in 67P coma agrees with the predictions (Fulle et al. 2010), with a difference of one mass bin before perihelion, and exactly at the predicted average at perihelion. We cannot exclude a bias of the largest detected boulders in the WAC im-ages with respect to NAC imim-ages (the S/N of sin-gle particles depends on the pixel size in arcsec). The largest possible ejected mass was computed by matching the escape velocity from 67P outer coma (0.5 m s−1 at the end of the gas drag) with
the dust velocities required to best fit the 67P tail and coma photometry (Fulle et al. 2010). In–situ observations confirm these predictions and show that the highest 67P gas density can lift–up boul-ders even larger than those observed at R > 50 km. Also, the mechanism determining the cut–off mass of escaping boulders is their fall–back on the nucleus surface where the gas density is lower than at the ejection (e.g., on the nucleus night side).
At 2.2 and 2.1 au inbound, the dust mass dis-tribution observed by OSIRIS matches the predic-tions of tail models (Fulle et al. 2010). Values smaller than the predictions at the lowest mass bins are affected by large relative errors (small Np
values in Tabs. 5, 6, 7 and 8). The fact that WAC images can sample the 67P coma closer to the spacecraft than NAC images may introduce a bias also in the largest mass bins. Taking into account these possible biases, at sizes > 1 mm, OSIRIS observations at 2.2 and 2.1 au inbound are consistent with a power index of –4 of the dif-ferential size distribution, as required by models of 67P trail (Agarwal et al. 2007), (Agarwal et al. 2010). At perihelion, OSIRIS NAC observations show a clear disagreement with this constraint, which is significant, because 67P trail photome-try is mostly sensitive to the dust ejected exactly at perihelion. Using ground–based observations, boulders of mass > 1 kg would not be observ-able in the trail because they would remain con-fined in the pixel occupied by the nucleus. Fig. 6 shows that the Af ρ values at mass > 1 kg give a negligible contribution to the total Af ρ, even if the ejected mass is strongly dominated by these boulders. We have no observational constraint to exclude that the real dust loss rate of 67P at per-ihelion is strongly dominated by boulders of mass > 1 kg, with a total dust mass loss rate close to 2 × 10⁴ kg s−1, and a dust–to–water mass ratio
close to 100. Since this dust–to–water ratio is clearly conflicting with other dust–to–water esti-mates, e.g. the value of six measured for 67P at 3.6 au inbound (Rotundi et al. 2015), we dis-cuss two possible alternative explanations for the OSIRIS observations of boulders.
The first explanation considers the dust–to– water ratio of the boulders. The largest radius of a boulder that can be lifted from the surface of 67P nucleus ranges from 1 to 3 m (Pajola et al. 2015). The local surface gravity field, the cen-trifugal force and the drag force produced by the outflowing gas have been taken into account. If these boulders are composed of a significant frac-tion of water ice, they must be excluded by the dust–to–water ratio computation. In particular, if the dust–to–water mass ratio inside them is even larger than six, they contribute more to the loss rate of water than to the refractory component of 67P. OSIRIS NAC actually provides the opportu-nity to check this possibility, by means of observa-tions of the same boulder in different filters, obser-vations performed necessarily at different times. This requires considering NAC observations of a resolved boulder, i.e. a boulder covering many
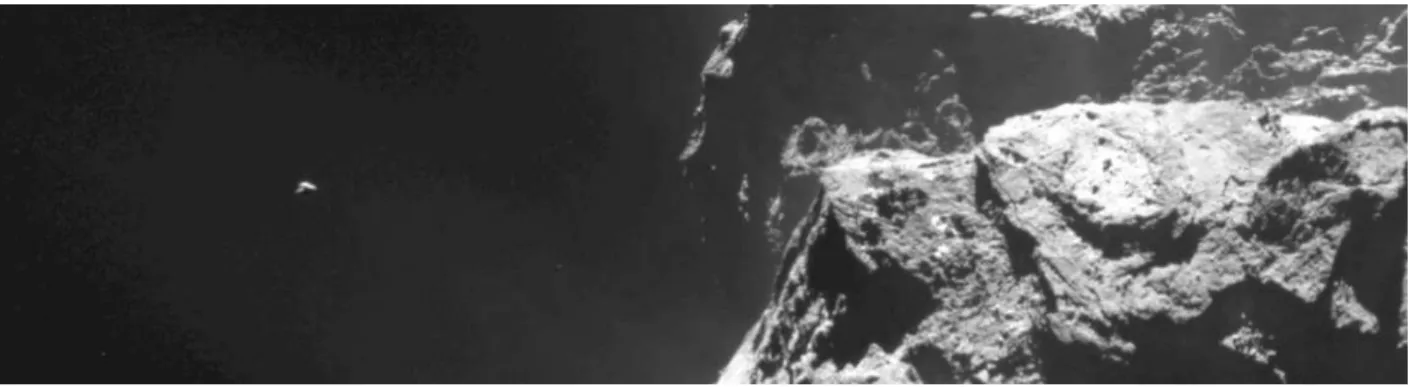
pixels in all useful NAC images. In NAC obser-vations of sub–pixel boulders, it is impossible to disentangle the photometric variations due to the boulder rotation from those really due to the boul-der colour. On 30 July 2015, we have detected one boulder which fits all these requirements (Fig. 7). The boulder shape is very irregular. Follow-ing the parallax procedure described in Section 2 (R = 180 km), for this boulder we get D = 3.5 km and r = 0.4 m, not far from the model esti-mates (Pajola et al. 2015). The observed boul-der color is bluer than that of the nucleus surface (Tab. 10), with a spectral slope value, evaluated between 480 and 880 nm, of -7.5%/(100 nm), while the mean nucleus spectral slope in the same wave-length range is +18.1%/(100 nm). Bluer colors across the nucleus are often coupled with higher albedo regions/spots, which have been associated with local maxima of water ice abundance at the nucleus surface (Fornasier et al. 2015), (Pom-merol et al. 2015), (Filacchione et al. 2016). This suggests that this boulder has a significant mass fraction of water ice. The spectral slope of dust tracks in the OSIRIS images shows that most of the dust reddening is very similar to the nucleus values, but that a fraction of the dust tracks show negative slopes suggesting a different composition, probably water–ice richer than that of the mean nucleus surface (Cremonese et al. 2016).
The second explanation considers the cloud of boulders in bound orbits observed around 67P nu-cleus (Rotundi et al. 2015) at 3.6 au inbound. This cloud had dispersed prior to perihelion by the increasing gas outflow, and is replenished at each perihelion passage by a new cloud surviv-ing dursurviv-ing the followsurviv-ing aphelion (Fulle 1997). Models predict the space density of boulders ac-tually observed in 67P bound cloud (Rotundi et al. 2015). In the mass bin from 10 to 100 kg, 0.12% of the total ejected dust mass during each perihelion passage is injected into bound orbits, with an expected space density of 7 × 10⁻¹² m−3,
a value close to that listed in Tab. 8. In the mass bin from 1 to 10 kg, 0.06% of the total ejected dust mass is injected into bound orbits, with an expected space density of 3 ×10⁻¹²m−3. At lower
dust masses, the solar radiation pressure prevents any long–lasting stable bound orbit (Richter & Keller 1995). Between the two dust populations, i.e. boulders directly escaping the nucleus gravity
field (only these have to be considered in the com-putation of the actual 67P dust loss rate), and boulders entering bound orbits around 67P nu-cleus, there is a third boulder population: boul-ders entering metastable orbits, i.e. not escaping the nucleus gravity field, but unable to enter or-bits stable up to the next aphelion. The number of the boulders in this third population is much larger than that of bound boulders. It is sufficient that 0.06% of the total ejected dust mass from 10 to 100 kg, and 1.8% of mass from 1 to 10 kg, be-long to this third boulder population in metastable orbits, in order to explain the observed space den-sity in these mass bins (Tab. 8) at 67P perihelion. We cannot exclude that the real 67P dust loss rate at mass > 1 kg is orders of magnitudes lower than the values shown in Tab. 8 and Fig. 6. If we take into account dust of mass < 1 kg only, the 67P perihelion total dust loss rate is (1.5 ± 0.5) × 103
kg s−1.
5. Dust–to–water mass ratio
In order to estimate the water loss rate at 2.1 and 2.2 au, we approximate its dependence on the comet heliocentric distance rh by a power law of
rh with an index of -4.6, which provides the
ob-served values of 1.2 kg s−1 at 3.5 au (Rotundi et
al. 2015), and of 150 kg s−1 at perihelion (Fulle
et al. 2010). We obtain a water loss rate of 13 kg s−1 at 2.1 au, and of 11 kg s−1 at 2.2 au. The
dust–to–water mass ratio at the nucleus surface is between five and six at 2.2 au and 2.1 au in-bound, and at most ten at perihelion (depending on the percentage of boulders in metastable orbits with respect to those escaping from the nucleus). The 67P dust–to–water mass ratio remains almost constant during the entire inbound orbit. At post– perihelion times, probably most of the dust in mass bins lower than those sampled by GIADA has been ejected (Tab. 9), making it more diffi-cult to estimate the dust–to–water mass ratio in the outbound orbit.
6. Time evolution of the dust size distri-bution
While the uncertainties affecting the 67P dust size distribution extracted from OSIRIS data pre-vent us from identifying any time evolution at sizes > 1 mm, GIADA data clearly show an evolution
of the 67P dust size distribution at sizes < 1 mm. At 2.2 and 2.1 au inbound, we confirm the results already obtained from 3.6 to 3.4 au inbound. The size distribution is very shallow, with a differen-tial index > −2. This is confirmed by the Af ρ quantity, with the same sharp maximum at the size distribution knee already shown between 3.6 and 3.4 au inbound (Rotundi et al. 2015). The Af ρ quantity integrated over all mass bins is close to the upper limit of the same quantity measured from ground (Fulle et al. 2010). This confirms that the dust size distribution maintains its slope shallower than –3 also at masses < 10−9 kg, with
a negligible brightness contribution from smaller dust. The consistency between the dust size dis-tribution and Af ρ of 67P measured in–situ and from ground indicates that there is no evidence of fragmentation and/or sublimation of compact particles in 67P from R ≈ 100 km up to the outer-most coma. Fluffy and fragile particles contribute < 5% of 67P coma brightness (and much less rel-ative mass) at dust masses > 10−9 kg (Fulle et al.
2015).
At perihelion, the dust size distribution mea-sured by GIADA is much steeper than beyond 2 au, with a differential power index of –3.7, as pre-dicted (Fulle et al. 2010). This confirms that the low number of detections in the lowest GIADA mass bin beyond 2 au is not due to any instru-mental bias, but is due to a real feature of the 67P dust size distribution. This time evolution is confirmed by the Af ρ quantity, which at peri-helion shows a maximum well below the knee of the dust size distribution. The integral of Af ρ over all mass bins provides a value which is about half of that predicted from ground–based obser-vations (Fulle et al. 2010). About half of 67P coma brightness is provided by dust particles of mass < 10−9 kg, thus confirming that the
differ-ential power index remains close to –3.6 in the dust size range from 0.1 µm to 1 mm. The lack of Rosetta orbits favourable to GIADA very close to the spring equinox does not allow us to in-fer when the 67P dust size distribution actually evolved. Future observations close to 67P autumn equinox (March 2016) will allow us to check if sea-sons are the drivers for this time evolution. In the outbound orbit, the 67P differential dust size distribution becomes increasingly steeper, with an index = −5.7 ± 2.2 at 1.56 < rh < 1.71 au (Tab.
9). The large uncertainty in these GIADA data requires further observations before and after the autumn 67P equinox to better constrain this time evolution.
If seasons were responsible for the observed evo-lution of the dust size distribution at sizes < 1 mm, then this evolution, coupled to the fact that at perihelion the 67P gas density in the sub–solar coma can lift–up meter–size boulders, would sug-gest that the pristine differential size distribution has a power index between –3.6 and –4 at all sizes, from a few µm to meters. Dust ejection and fall– back happen mainly during the short perihelion summer, at maximum comet activity. This im-plies an erosion rate of about 1 m per perihelion in the southern hemi–nucleus (Bertaux 2015), and a fall–back of similar thickness on the northern hemi–nucleus, mainly in night at perihelion. De-pending on the nucleus temperature on the night side, part of the gas flux (and of the dust par-ticles dragged in this flow) can fall back on that surface, where the gas re–condenses. On average, dust of size > 1 mm falls back on the nucleus night side without any selection effect, because the 67P night outgassing is too low to affect the trajec-tories of falling big dust. This explains why, at sizes > 1 mm, both hemi–nuclei have the same size distribution, matching the size distribution observed on the nucleus surface with smooth ter-rains (Mottola et al. 2015), dominated by dust falling back on the nucleus surface. Dust of size < 1 mm is affected by the low outgassing occuring in 67P night–side at perihelion. The smaller is the falling–back dust, the more effective the repulsion on it by the night outgassing. This explains the knee of the size distribution at a size of about 1 mm, with a depletion of small dust on the hemi– nucleus in winter at perihelion, i.e. a shallower differential index, close to –2 taking into account compact particles only, possibly close to –3 taking into account fluffy particles as well (Fulle et al. 2015).
7. Conclusions
Our main results can be summarized as follows: – The 67P dust environment observed by means of individual dust particle detections by GI-ADA and OSIRIS instruments on–board Rosetta matches that determined from past ground–based
observations (Fulle et al. 2010). 67P dust size dis-tribution does not change from a nucleus distance of a few hundred km up to the most external coma. The differential dust size distribution is very sim-ilar to that directly measured on the 67P nucleus surface for particle larger than a few cm (Mottola et al. 2015). No significant dust fragmentation and/or sublimation occurs in 67P coma.
– 67P dust activity seems to repeat regularly during each orbit. What was observed in–situ in 2015 by Rosetta instruments matches what was extracted from ground–based observations per-formed before 2010.
– The dust ejection velocities measured in–situ match those extracted by means of coma, tail and trail models (Agarwal et al. 2007), (Agarwal et al. 2010), (Fulle et al. 2010).
– 67P differential dust size distribution at sizes > 1 mm has been extracted by OSIRIS individual particle detections. Although the dust loss rates in this range agree with the predictions based on a power law with index –4, the bias of WAC de-tections, and the pollution from boulders in meta– stable and bound orbits do neither allow us to ex-tract a well defined power index, nor to infer any clear time evolution of this index.
– 67P differential dust size distribution at sizes < 1 mm has been extracted from GIADA individ-ual particle detections. We confirm the shallower distribution with respect to the predictions based on past ground–based observations (index > −2 rather than –3) beyond 2 au from the Sun (Ro-tundi et al. 2015). We confirm the strong evo-lution at perihelion, where an index close to –3.7 has been observed, in agreement with predictions based on ground–based observations (Fulle et al. 2010).
– The mass of the largest boulders observed in– situ matches the predictions of tail models (Fulle et al. 2010). At perihelion, we observe a water– ice rich meter–sized boulder at 3.5 km from the spacecraft, when the gas density at the sub–solar nucleus surface can lift–up even larger boulders (Pajola et al. 2015). The largest ejected mass depends on the fall–back mechanism on 67P nu-cleus surface where the gas density is much lower (e.g. on the nucleus night side). This mechanism may explain the observed time evolution of the 67P dust size distribution.
– At 67P perihelion, OSIRIS NAC has observed the birth of the 67P cloud of boulders in bound orbits (Fulle 1997), (Rotundi et al. 2015).
– The dust–to–water mass ratio at 67P nucleus surface is close to six during the whole inbound orbit from 3.6 au to perihelion. This value char-acterizes the nucleus interior too, because the 67P nucleus surface is eroded up to a depth of about 1 m during each perihelion passage (Bertaux 2015). – Prior to perihelion, both dust mass and coma brightness are dominated by mm–sized particles. After perihelion, both dust mass and coma bright-ness are dominated by particles of mass < 10−9
kg, so that the Rosetta mission will constrain the dust–to–gas mass ratio with less accuracy than pre–perihelion.
OSIRIS was built by a consortium led by the Max-Planck-Institut f¨ur Sonnensystemforschung, Katlenburg-Lindau, Germany, in collaboration with CISAS, University of Padova, Italy, the Lab-oratoire d’Astrophysique de Marseille, France, the Instituto de Astrofsica de Andalucia, CSIC, Granada, Spain, the Scientific Support Office of the European Space Agency, Noordwijk, The Netherlands, the Instituto Nacional de Tcnica Aeroespacial, Madrid, Spain, the Universidad Politchnica de Madrid, Spain, the Department of Physics and Astronomy of Uppsala Univer-sity, Sweden, and the Institutf¨ur Datentechnik und Kommunikationsnetze der Technischen Uni-versit¨at Braunschweig, Germany. The support of the national funding agencies of Germany (DLR), France (CNES), Italy (ASI), Spain (MEC), Swe-den (SNSB), and the ESA Technical Directorate is gratefully acknowledged. GIADA was built by a consortium led by the Univ. Napoli Parthenope & INAF– Oss. Astr. Capodimonte, in collaboration with the Inst. de Astrofisica de Andalucia, Selex– ES, FI and SENER. GIADA is presently managed & operated by Ist. di Astrofisica e Planetologia Spaziali-INAF, IT. GIADA was funded and man-aged by the Agenzia Spaziale Italiana, IT, with the support of the Spanish Ministry of Education and Science MEC, ES. GIADA was developed from a PI proposal from the University of Kent; sci. & tech. contribution were provided by CISAS, IT, Lab. d’Astr. Spat., FR, and Institutions from UK, IT, FR, DE and USA. Science support was provided by NASA through the US Rosetta
Project managed by the Jet Propulsion Labora-tory/California Institute of Technology. We would like to thank Angioletta Coradini for her con-tribution as a GIADA Co–I. GIADA calibrated data will be available through ESAs PSA web site (www.rssd.esa.int/index.php?project=PSA&page=in dex). All data presented here are available on re-quest prior to its archiving in the PSA. We thank the Rosetta Science Ground Segment at ESAC, the Rosetta Mission Operations Center at ESOC and the Rosetta Project at ESTEC for their out-standing work enabling the science return of the Rosetta Mission. This research was supported by the Italian Space Agency (ASI) within the INAF– ASI agreements I/032/05/0 and I/024/12/0. REFERENCES
Agarwal, J., M¨uller M., Gr¨un E. 2007, Space Sci. Rev., 128, 1-4, 79
Agarwal, J., M¨uller M., Reach W.T. et al. 2010, Icarus, 207, 992
Bertaux, J.–L. 2015, A&A, 583, A38
Colangeli, L., Lopez–Moreno J.J., Palumbo P. et al. 2007, Space Sci. Rev., 128, 803
Cremonese, G., Simioni E., Regazzoni R. et al. 2016, A&A, under revision
Della Corte, V., Rotundi A., Accolla M. et al. 2014, J. of Astron. Instrumentation, 3, 1350011–1
Della Corte, V., Rotundi A., Fulle M. et al. 2015, A&A, 583, A13
Della Corte, V., Sordini R., Accolla M. et al. 2016, Acta Astronautica, under review
Epifani, E., Colangeli L., Fulle M. et al. 2001, Icarus, 149, 339
Ferrari, M., Della Corte V., Rotundi A., et al. 2014, Plan. & Space Sci., 101, 53
Filacchione, G., De Sanctis M.C., Capaccioni F. et al. 2016, Nature (in press)
Fornasier, S., Hasselmann P.H., Barucci A. et al. 2015, A&A, 583, A30
Fulle, M. 2004, Comets II, M. C. Festou, H. U. Keller, and H. A. Weaver (eds.), University of Arizona Press, Tucson, p.565
Fulle, M., Colangeli L., Agarwal J. et al. 2010, A&A, 522, A63
Fulle, M., Della Corte V., Rotundi A. et al. 2015, ApJ, 802, L12
Keller, H.U., Barbieri C., Lamy P.L. et al. 2007, Space Sci. Rev., 128, 433
Mottola, S., Arnold G., Grothues H.–G. et al. 2015, Science, 349, aab0232
Pajola, M., Vincent J.–B., G¨uttler C. et al. 2015, A&A, 583, A37
Pommerol, A., Thomas N., El–Maarry M.R. et al. 2015, A&A, 583, A25
Richter K., & Keller H.U. 1995, Icarus, 114, 355 Rotundi, A., Sierks H., Della Corte V. et al. 2015,
Science, 347, aaa3905 Sekanina, Z. 1988, AJ, 95, 911
Thomas, N., Davidsson B., El–Maarry M.R. et al. 2015, A&A, 583, A17
This 2-column preprint was prepared with the AAS LATEX
Table 1
Geometry of OSIRIS observations Date UT a r h b R c α d vsc e vscz f δ g 28/02/15 2.20 110 63 0.27 0.24 30 14/03/15 2.10 80 52 0.27 0.21 30 27/08/15 1.25 400 79 1.09 0.10 23 add/mm/yy
bheliocentric distance (au) cnucleus-spacecraft distance (km) dphase angle (deg)
esky–projected spacecraft velocity (m s−1)
fspacecraft velocity projected along the line of sight
(m s−1)
gcounter–clock–wise angle between the OSIRIS
horizontal image axis and the spacecraft velocity pro-jected on the sky (deg)
Table 2
Photometric and geometric data of the 28 single detections in the 8 WAC pairs of images of sequence STP045–DUST–MON003 collected on 28 February 2015
N I a a b b c r d m e γ f β g v h 01 4.2 14.3 21 2.4 5.8E-05 4.2 -27 1.9 02 10.0 5.4 50 8.9 3.0E-03 1.6 -3 0.5 03 1.9 2.7 100 7.8 2.0E-03 0.9 +3 0.9 04 2.4 6.4 43 3.8 2.3E-04 1.6 +7 1.2 05 5.3 2.8 98 12.7 8.6E-03 3.5 +9 0.7 06 1.4 2.7 111 7.4 1.7E-03 6.0 -26 1.3 07 10.1 17.9 15 2.7 8.2E-05 – 0 – 08 3.7 3.2 96 10.4 4.7E-03 3.4 +29 2.5 09 3.7 11.1 24 2.6 7.4E-05 1.1 +6 1.5 10 5.4 3.5 81 10.6 5.0E-03 5.5 +18 0.9 11 1.8 2.8 106 8.1 2.2E-03 2.1 +25 3.4 12 5.0 10.2 33 4.2 3.1E-04 2.0 +36 5.6 13 1.0 2.7 104 5.9 8.6E-04 5.2 +15 0.8 14 0.7 1.7 185 8.7 2.8E-03 5.5 +31 1.7 15 3.5 3.0 91 9.6 3.7E-03 – +10 – 16 5.5 51.2 5 0.7 1.4E-06 1.0 -8 2.2 17 4.6 3.4 80 9.7 3.8E-03 3.6 -8 0.6 18 4.5 4.7 59 7.1 1.5E-03 2.4 +14 1.6 19 2.7 6.4 44 4.1 2.9E-04 1.1 +15 3.8 20 1.7 4.2 72 5.3 6.2E-04 4.2 +27 1.9 21 3.7 1.7 162 17.6 2.3E-02 3.6 +11 0.8 22 3.3 4.1 67 6.8 1.3E-03 – +11 – 23 2.3 2.3 118 10.1 4.3E-03 1.4 -6 1.2 24 1.6 0.7 399 28.5 9.7E-02 – +15 – 25 1.0 0.8 338 19.1 2.9E-02 1.2 -3 0.7 26 8.4 7.7 35 5.7 7.8E-04 0.3 -1 0.8 27 5.6 16.7 16 2.1 3.9E-05 – +1 – 28 1.4 2.4 113 7.5 1.8E-03 3.7 -2 0.2
aintegrated particle brightness in percentage of nucleus
sur-face brightness (the nucleus is in the center of all 16 images)
bsky-projected speed of the dust particle (px s−1)
cWAC pixel size at the particle distance D from the
space-craft, D = 104b (mm)
dparticle radius, assuming that the particle and the nucleus
have the same albedo times the phase function (mm)
fsky–projected angle between the nucleus and the particle
trajectory across the full image (deg)
gcounter–clock–wise angle between the sky-projected
spacecraft velocity vsc and the apparent particle velocity
(deg)
hparticle radial speed from the nucleus. v cannot be
com-puted if the particle has an apparent motion converging to the nucleus (m s−1)
Table 3
Photometric and geometric data of the 74 single detections in the 9 WAC pairs of images of sequence STP049–DUST–MON001 collected on 14 March 2015. See Tab. 2 for
explanations N I a b r m γ β v 01 1900 defocus 0.48 1.2 6.9E-06 – – – 02 11.9 8.1 34 6.7 1.2E-03 – 10 – 03 6.4 25.5 18 2.6 7.3E-05 3.1 54 4.0 04 28.6 7.9 44 13.3 9.9E-03 6.0 40 1.7 05 1.7 3.1 105 7.7 1.9E-03 6.7 31 1.2 06 4.0 13.1 23 2.6 7.7E-05 4.5 26 1.5 07 1.0 2.8 90 5.1 5.6E-04 -2.8 5 0.5 08 3.5 10.1 30 3.2 1.4E-04 1.3 27 5.4 09 1.7 11.2 41 3.0 1.2E-04 4.0 54 3.2 10 1.8 6.8 39 2.9 1.1E-04 – 8 – 11 3.3 10.2 27 2.8 9.3E-05 1.2 10 2.2 12 41.5 11.0 28 10.2 4.4E-03 5.1 29 1.5 13 1.8 10.8 27 2.0 3.4E-05 -3.0 22 1.9 14 2.8 7.0 39 3.7 2.1E-04 -1.7 7 1.1 15 1.9 4.1 67 5.2 6.1E-04 – 0 – 16 1.0 3.0 91 5.1 5.7E-04 0.5 9 4.5 17 2.4 5.2 55 4.8 4.6E-04 – 10 – 18 2.4 2.0 137 12.0 7.2E-03 – 9 – 19 2.8 1.8 139 13.1 9.5E-03 – 14 – 20 3.1 12.7 22 2.1 4.1E-05 0.9 15 4.5 21 1.3 1.9 140 9.0 3.1E-03 1.4 16 3.0 22 4.5 3.0 94 11.2 5.9E-03 3.4 16 1.2 23 4.3 4.1 68 8.0 2.1E-03 -4.1 7 0.5 24 3.9 2.0 139 15.5 1.6E-02 – 14 – 25 2.0 3.2 90 7.2 1.6E-03 – 0 – 26 2.9 2.9 95 9.1 3.2E-03 1.5 18 3.2 27 2.3 4.2 68 5.8 8.3E-04 0.3 7 7.4 28 1.0 2.1 139 7.9 2.0E-03 1.9 14 2.0 29 3.4 6.8 42 4.3 3.4E-04 -6.8 23 0.9 30 5.2 6.2 45 5.8 8.2E-04 – 4 – 31 10.9 7.1 40 7.5 1.7E-03 – 16 – 32 2.6 3.1 91 8.3 2.4E-03 – 9 – 33 3.4 3.9 67 7.0 1.5E-03 – 0 – 34 10.0 7.1 39 6.9 1.4E-03 2.0 8 1.1 35 5.1 25.8 11 1.4 1.2E-05 3.6 22 1.6 36 2.4 1.1 285 24.9 6.4E-02 4.0 18 1.2 37 1.5 2.2 151 10.4 4.8E-03 – 27 – 38 1.5 1.0 278 19.2 3.0E-02 -1.7 14 2.2 39 2.7 2.9 93 8.6 2.7E-03 -2.3 14 1.6 40 4.1 1.0 272 31.1 1.3E-02 0.1 8 18.9 41 0.6 1.9 139 6.1 9.4E-04 – 14 –
Table 3—Continued N I a b r m γ β v 42 0.5 1.8 135 5.4 6.5E-04 – 0 – 43 5.2 10.7 25 3.2 1.3E-04 -2.8 3 0.3 44 2.6 6.2 45 4.1 2.9E-04 -0.8 4 1.4 45 3.0 3.9 73 7.2 1.5E-03 3.0 23 2.0 46 3.6 2.2 139 14.9 1.4E-02 1.3 14 2.9 47 1.3 4.1 70 4.5 3.9E-04 2.8 16 1.5 48 5.4 3.9 70 9.1 3.2E-03 – 14 – 49 6.6 24.7 14 2.0 3.2E-05 -7.6 37 1.2 50 2.7 3.8 73 6.8 1.3E-03 – 23 – 51 2.4 2.1 138 12.0 7.3E-03 – 11 – 52 2.9 4.2 70 6.8 1.3E-03 – 17 – 53 1.4 7.9 37 2.5 6.4E-05 3.0 25 2.2 54 1.8 3.8 68 5.2 5.8E-04 -3.2 8 0.7 55 2.5 9.8 27 2.4 5.9E-05 -1.1 5 1.2 56 9.3 21.7 13 2.2 4.2E-05 -4.2 12 0.8 57 4.1 6.8 39 4.4 3.7E-04 -1.8 8 1.2 58 2.6 7.9 36 3.2 1.4E-04 – 18 – 59 1.4 3.9 68 4.5 3.8E-04 – 0 – 60 6.8 8.8 32 4.8 4.6E-04 3.6 22 1.6 61 0.3 5.9 45 1.4 1.1E-05 – 0 – 62 2.8 12.1 23 2.1 4.1E-05 0.6 5 2.3 63 2.1 4.1 70 5.7 7.7E-04 – 14 – 64 1.5 3.9 70 4.8 4.7E-04 -5.9 14 0.6 65 6.2 4.8 55 7.7 1.9E-03 -6.2 11 0.5 66 18.6 13.8 20 4.8 4.7E-04 -3.8 14 1.0 67 2.2 6.2 47 3.9 2.5E-04 -6.0 15 0.7 68 3.5 2.0 151 15.9 1.7E-02 – 27 – 69 1.5 4.1 68 4.7 4.3E-04 – 0 – 70 3.3 2.9 95 9.7 3.9E-03 1.0 18 4.8 71 1.4 2.1 13 9.2 3.2E-03 1.2 11 2.5 72 3.2 4.9 54 5.5 6.9E-04 2.4 7 0.8 73 1.2 1.8 139 8.6 2.7E-03 6.5 14 0.6 74 0.6 0.8 382 16.7 1.9E-02 -2.0 45 5.4
Table 4
Photometric and geometric data of the 102 single detections in the 8 NAC pairs of images of sequence STP071–DUST–MON001 collected on 27 August 2015. See Tab. 2 for
explanations N I a a b b r m γ β v 001 3.9 1.3 978 109 5.4E-00 29 003 1.0 1.7 630 35 1.8E-01 4 010 3.6 2.1 620 66 1.2E-00 33 011 2.7 7.1 206 19 2.9E-02 43 012 1.6 3.6 299 21 3.9E-02 2 013 1.5 2.3 465 32 1.4E-01 1 016 1.4 2.1 530 35 1.8E-01 11 017 9.5 1.6 665 115 6.4E-00 -5 018 7.7 1.8 640 100 4.2E-00 22 019 1.8 1.8 595 45 3.8E-01 -5 020 8.8 7.2 167 28 9.2E-02 27 025 6.2 9.2 117 16 1.7E-02 0.4 3 7.7 026 1.8 2.7 428 32 1.4E-01 22 030 0.3 6.4 175 5 6.6E-04 16 031 6.6 2.1 657 95 3.6E-00 40 034 53.0 9.5 145 59 8.6E-01 38 042 92.6 14.6 74 40 2.7E-01 4 043 5.2 1.5 753 97 3.8E-00 17 045 10.5 1.7 630 115 6.4E-00 4 048 4.4 1.6 658 78 2.0E-00 0.3 -2 7.6 052 3.2 1.7 652 66 1.2E-00 18 054 6.5 2.5 475 68 1.3E-00 23 055 > 100 10.7 106 200 3.3E+01 18 056 3.7 1.5 873 95 3.6E-00 37 059 3.7 1.5 702 76 1.8E-00 0.6 7 11.8 060 7.2 2.2 564 85 2.6E-00 29 063 16.5 5.6 211 48 4.6E-01 23 067 4.8 2.0 589 73 1.6E-00 26 071 2.5 3.4 315 28 9.2E-02 0.9 4 5.1 073 3.6 2.2 506 54 6.6E-01 1.0 13 14.8 074 3.6 1.5 808 87 2.8E-00 27 076 4.4 3.1 367 43 3.3E-01 20 077 6.9 6.4 188 28 9.2E-02 26 082 14.1 2.4 477 101 4.3E-00 22 086 8.6 4.1 271 45 3.8E-01 14 088 2.0 2.5 497 40 2.7E-01 28 094 4.7 2.6 442 54 6.6E-00 19 097 4.0 2.1 657 74 1.7E-00 40 101 28.3 4.4 401 120 7.2E-00 52 102 11.6 3.4 397 76 1.8E-00 36 103 11.1 13.2 83 15 1.4E-02 -8
Table 4—Continued N I a a b b r m γ β v 105 4.9 3.8 285 36 2.0E-01 0.7 1 1.6 106 3.9 4.1 286 32 1.4E-01 1.0 22 23.8 107 2.8 2.9 373 35 1.8E-01 1.0 9 9.2 108 10.6 1.5 701 129 8.8E-00 6 112 13.0 1.7 628 128 8.8E-00 3 114 13.1 2.0 556 114 6.2E-00 18 115 11.0 2.9 433 81 2.2E-00 30 118 3.8 2.3 471 52 5.6E-01 0.5 12 23.6 119 3.4 3.4 320 33 1.5E-01 0.5 1 2.2 120 21.2 3.3 336 87 2.8E-00 0.6 13 24.0 121 2.0 1.8 679 54 6.6E-03 26 123 28.6 3.2 343 104 4.7E-00 0.7 10 15.0 125 47.4 6.1 228 88 2.9E-00 39 128 3.7 3.8 287 31 1.2E-01 0.7 7 10.1 134 1.6 2.0 549 39 2.5E-01 0.7 6 9.1 139 > 100 24.1 45 135 1.0E+01 2 143 32.6 2.6 420 135 1.0E+01 4 150 1.7 2.3 451 33 1.6E-01 12 154 6.1 3.8 285 40 2.7E-01 0.9 1 1.2 157 4.9 10.2 107 13 9.2E-03 1.0 6 6.8 159 3.8 4.4 247 27 8.2E-02 0.9 6 7.6 162 2.4 1.6 670 59 8.6E-01 13 165 4.3 2.3 465 54 6.6E-01 1 166 77.8 1.9 579 288 1.0E+02 14 168 2.8 2.8 382 36 2.0E-01 5 176 11.5 1.9 781 149 1.4E+01 43 178 7.8 3.9 284 45 3.8E-01 15 179 59.0 7.2 150 65 1.2E-00 0.2 2 13.6 182 1.4 2.3 471 31 1.2E-01 0.8 12 16.3 189 7.0 2.2 564 84 2.5E-00 29 192 3.3 1.9 649 67 1.3E-00 30 193 5.3 1.2 923 120 7.2E+01 18 194 9.7 7.1 158 28 8.2E-01 16 195 16.7 16.0 68 16 1.7E-02 10 198 82.3 6.3 189 94 3.5E-00 24 200 15.1 12.7 104 23 5.1E-02 35 202 1.0 17.0 80 5 3.8E-04 22 203 12.2 16.2 69 13 9.2E-03 13 204 7.2 18.1 61 9 3.2E-03 10 205 6.1 1.6 762 106 5.0E-00 31 206 9.2 11.7 92 16 1.7E-02 0.3 2 6.4
Table 4—Continued N I a a b b r m γ β v 209 5.7 22.9 670 90 3.1E-00 13 215 17.9 22.9 48 11 5.6E-03 0.7 10 15.7 219 4.3 5.8 193 23 4.5E-02 0.5 14 27.4 220 6.8 1.5 702 103 4.6E-00 0.9 7 8.6 221 4.8 5.2 216 27 7.4E-02 0.9 16 18.6 229 7.7 1.9 579 91 3.1E-00 1.0 14 14.4 230 1.6 3.1 352 25 6.5E-01 0.7 7 9.9 232 2.1 2.2 465 38 2.3E-01 0.9 1 1.1 233 11.3 6.3 172 33 1.5E-01 0 234 2.7 2.7 428 40 2.7E-01 22 235 9.2 2.3 515 88 2.9E-00 25 237 7.9 3.0 389 62 1.0E-00 22 241 13.8 2.7 412 86 2.7E-00 16 243 3.9 1.9 649 72 1.6E-00 30 245 0.6 5.2 216 9 3.2E-03 16 247 3.4 4.6 236 25 6.5E-02 -1 248 5.5 4.6 257 34 1.6E-01 25 250 4.4 9.4 122 14 1.1E-02 20 253 7.6 8.4 160 25 6.5E-02 37 254 11.9 1.7 630 122 7.6E-00 0.9 4 4.9
aWhen I > 100% the particle radius was directly measured
in the NAC image
bThe particle distance from the spacecraft is D = 5.4 ×
104b. Only particles with D < 50 km have been taken into
Table 5
Dust size distribution of 67P at 2.2 au pre-perihelion
∆m a N
p/Ni b Ngds+is c Nis d D e ρ f v g Qn h Qm i σ j Af ρ k
1E-02–1E-01 3/8 – – 3.99 4.4E-10 0.6 2.0E+01 1.0 1.6E-03 6.9E-03 1E-03–1E-02 14/8 – – 1.85 2.1E-08 1.1 1.8E+03 5.9 2.7E-04 5.7E-02 1E-04–1E-03 6/8 – – 1.04 5.0E-08 2.1 8.0E+03 4.1 7.7E-05 3.8E-02 1E-05–1E-04 4/8 – – 0.24 2.7E-06 1.5 3.1E+05 19.5 1.9E-05 5.1E-01 1E-06–1E-05 1/8 – – 0.05 7.5E-05 2.2 1.1E+07 15.4 1.5E-06 1.1E-00
1E-07–1E-06 – – – – – – – – – –
1E-08–1E-07 – 14 13 – – 5.5 1.1E+08 5.24 1.6E-07 4.2E-01 1E-09–1E-08 – 0 2 – – 15. 1.1E+07 0.06 3.8E-08 3.6E-03
amass bins (kg). 5 upper mass bins: data from 28 OSIRIS single particle detections on 28 February 2015
(Tab. 2), assumed dust bulk density of 103kg m−3). 2 lower mass bins: 29 GIADA single particle detections
from 19 to 28 February 2015 (∆t = 7.3 × 10⁵s) bnumber of OSIRIS detections N
p averaged over the number of different images Ni
cnumber of GIADA detections by the GDS and IS sensors (measurement of dust mass and velocity) dnumber of GIADA detections by the IS sensor only, dust velocity assumed from tail model (Fulle et al.
2010)
ethe largest distance from the spacecraft at which a particle has been detected (km)
fdust space density, provided by N divided by the sampled coma volume up to the distance D (m−3) gmeasured dust radial velocity (assumed (Fulle et al. 2010) if N
gds+is= 0) (m s−1) hdust number loss rates at the nucleus surface (s−1)
idust mass loss rates at the nucleus surface (kg s−1) jdust cross section (m2)
Table 6
Dust size distribution of 67P at 2.1 au pre-perihelion (see Tab. 5 for explanations)
∆m a N
p/Ni Ngds+is Nis D ρ v Qn Qm σ Af ρ
1E-02–1E-01 7/9 – – 3.82 1.0E-09 2.7 1.1E+02 2.8 1.0E-03 5.3E-03 1E-03–1E-02 27/9 – – 1.51 6.5E-08 1.6 4.2E+03 13.4 2.6E-04 8.8E-02 1E-04–1E-03 27/9 – – 1.39 8.4E-08 1.7 5.7E+03 2.6 7.1E-05 3.1E-02 1E-05–1E-04 13/9 – – 0.45 1.2E-06 1.9 9.2E+04 4.1 1.5E-05 9.5E-02 1E-06–1E-05 – – – – – – – – – – 1E-07–1E-06 – 7 0 – – 0.5 1.7E+07 7.66 7.0E-07 3.1E+00 1E-08–1E-07 – 5 19 – – 9.1 7.9E+07 1.66 9.3E-08 1.1E-01 1E-09–1E-08 – 0 7 – – 15. 4.4E+07 0.18 3.0E-08 1.1E-02
a4 upper mass bins: data from 74 OSIRIS single particle detections on 14 March 2015 (Tab. 3, assumed
dust bulk density of 103 kg m−3). 3 lower mass bins: 38 GIADA single particle detections on 28 March
Table 7
Dust size distribution of 67P at 2.1 au pre-perihelion (see Tab. 5 for explanations)
∆m a N
p/Ni Ngds+is Nis D ρ v Qn Qm σ Af ρ
1E-02–1E-01 15/9 – – 3.82 2.2E-09 2.6 2.3E+02 10.4 1.5E-03 1.7E-02 1E-03–1E-02 38/9 – – 1.40 1.2E-07 1.6 7.7E+03 30.8 3.0E-04 1.8E-01 1E-04–1E-03 17/9 – – 0.47 1.4E-06 2.0 1.1E+05 37.4 5.9E-05 4.2E-01 1E-05–1E-04 4/9 – – 0.45 3.7E-07 1.2 1.8E+04 0.85 1.6E-05 3.1E-02
1E-06–1E-05 – – – – – – – – – –
1E-07–1E-06 – 1 1 – – 3.5 2.0E+07 4.3 2.1E-07 1.6E-01 1E-08–1E-07 – 17 52 – – 9.3 7.0E+08 18.9 5.2E-08 5.1E-01 1E-09–1E-08 – 2 8 – – 14.5 1.0E+08 0.37 1.4E-08 1.3E-02
a4 upper mass bins: data from 74 OSIRIS single particle detections on 14 March 2015 (Tabs. 3, assumed
dust bulk density of 3 × 10³ kg m−3). 3 lower mass bins: 81 GIADA single particle detections from 13 to
Table 8
Dust size distribution of 67P at perihelion (see Tab. 5 for explanations)
∆m a N
p/Ni Ngds+is Nis D ρ v Qn Qm σ Af ρ
1E+01–1E+02 5/8 – – 50 1.0E-11 8.2 8.2E+01 3.0E+03 1.3E-01 0.16 1E-00–1E+01 39/8 – – 49 8.8E-11 14.0 1.2E+03 4.0E+03 2.7E-02 0.30 1E-01–1E-00 33/8 – – 34 2.2E-10 10.3 2.3E+03 8.1E+02 6.0E-03 0.17 1E-02–1E-01 18/8 – – 19 6.9E-10 10.8 7.5E+03 3.5E+02 1.6E-03 0.14 1E-03–1E-02 5/8 – – 11 9.9E-10 12.8 1.3E+04 7.9E+01 4.0E-04 0.05 1E-04–1E-03 2/8 – – 9 7.2E-10 16.0 1.2E+04 4.8E+00 6.6E-05 0.01
1E-05–1E-04 – – – – – – – – – –
1E-06–1E-05 – – – – – – – – – –
1E-07–1E-06 – 2 0 – 6.9E-06 26 1.8E+08 7.6E+01 6.8E-07 0.61 1E-08–1E-07 – 5 24 – 1.2E-04 20 2.5E+09 5.3E+01 9.2E-08 1.50 1E-09–1E-08 – 1 92 – 2.4E-04 35 8.4E+09 5.1E+01 4.0E-08 1.25
a6 upper mass bins: data from 102 OSIRIS single particle detections on 27 August 2015 (Tab. 4, assumed
dust bulk density of 103 kg m−3). 3 lower mass bins: 124 GIADA single particle detections from 23 August
Table 9
Dust size distribution of 67P at 1.56 < rh< 1.71 au post–perihelion (see Tab. 5 for
explanations) ∆m a N gds+is Nis v Qm 1E-06–1E-05 1 0 15 1.3 1E-07–1E-06 0 2 10 0.8 1E-08–1E-07 3 101 10 9.13 1E-09–1E-08 1 15 6 0.14
amass bins (kg). 123 GIADA single particle
detections from 1 to 20 November 2015 (∆t = 1.8 × 10⁶s)
Table 10
Photometry of the resolved boulder shown in Fig. 7 Time UT a λ b (I/F )
N c (I/F )B d
22h07m13s 481 1.26E-03 5.81E-03 22h07m02s 882 4.06E-03 2.18E-03
aObservation time of the boulder on 30
July 2015
bcentral wavelength of OSIRIS NAC filter
(nm)
cfraction of solar light flux scattered by
the nucleus at α = 90 deg
dfraction of solar light flux scattered by
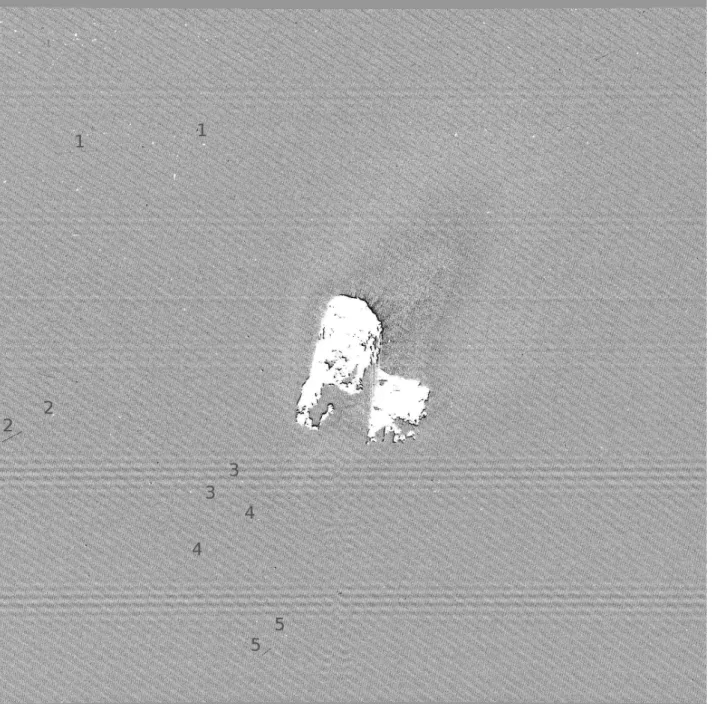
Fig. 1.— OSIRIS WAC subtraction image between the exposures of 0.48 and 12 sec taken on 28 February 2015, 11h35m UT. The numbers mark the first 5 identified moving dust particles of the sequence STP045– DUST–MON003 (Tab. 2). 67P nucleus at image center.
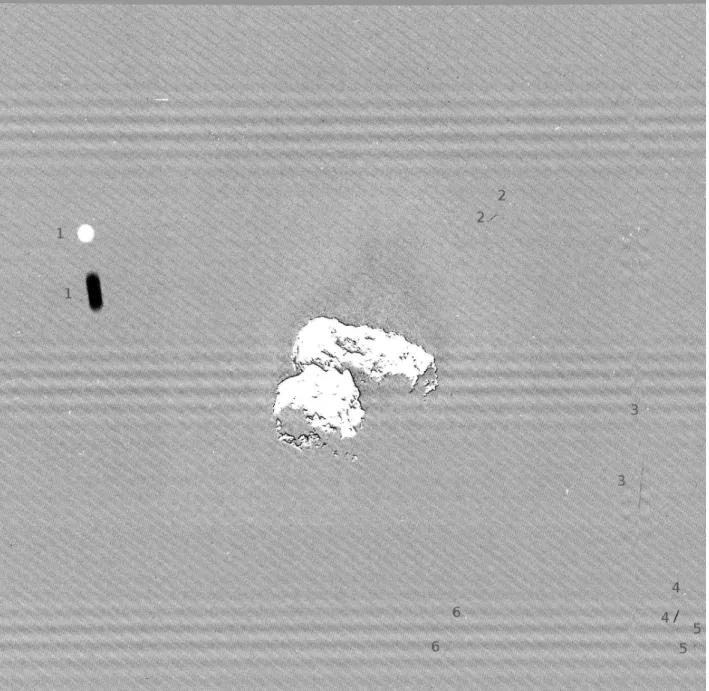
Fig. 2.— OSIRIS WAC subtraction image between the exposures of 0.24 and 6 sec taken on 14 March 2015, 02h37m UT. The numbers mark the first 6 identified moving dust particles of the sequence STP049–DUST– MON001, see Tab. 3 for the full data set. The track 1 is out of focus, its size has directly provided the particle distance.
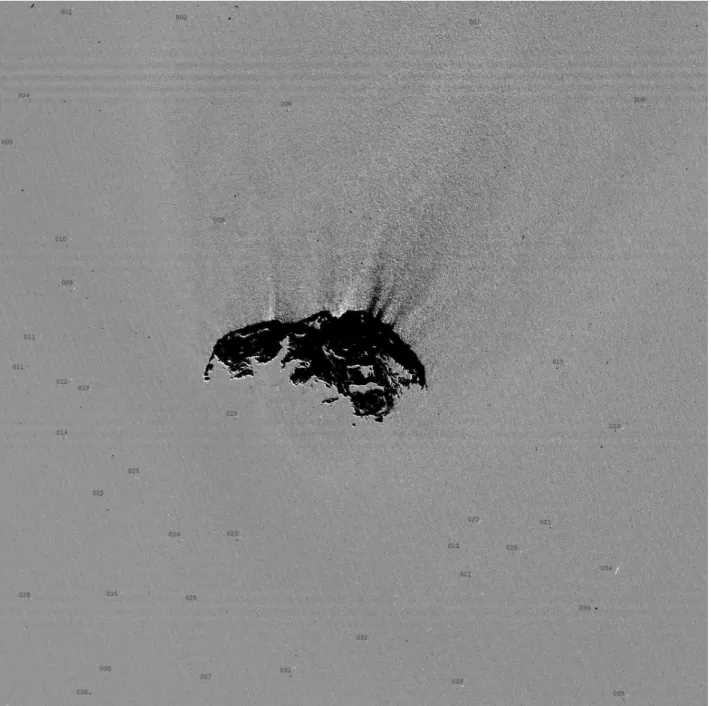
Fig. 3.— OSIRIS NAC subtraction image between the exposures of 2.4 and 0.096 sec taken on 27 August 2015, 05h51m UT. The numbers mark the first 35 identified moving dust particles of the sequence STP071– DUST–MON001, see Tab. 4 for the full data set.
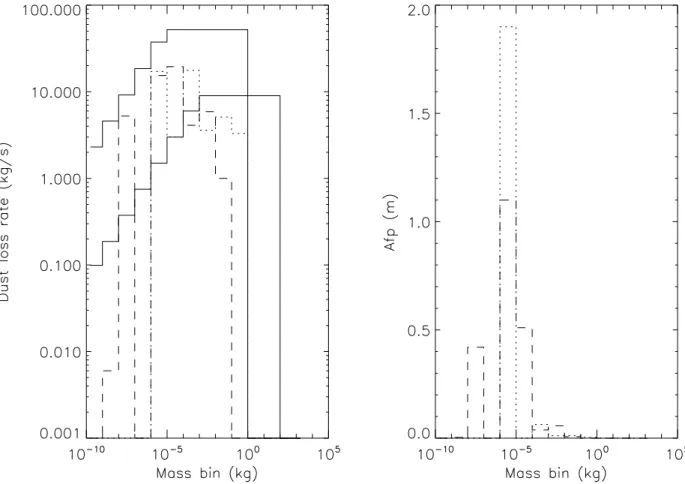
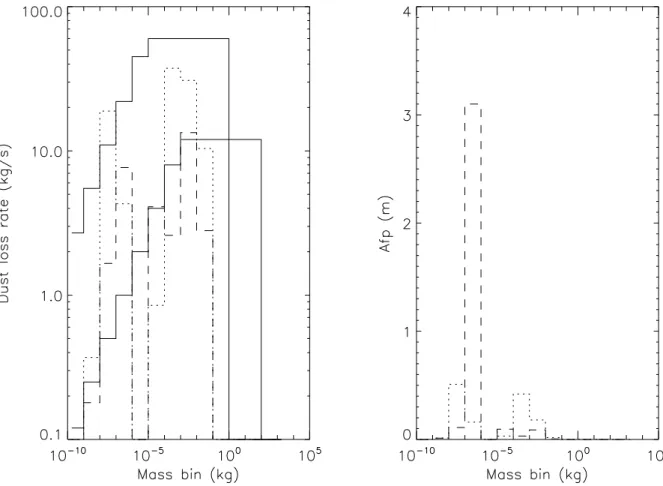
Fig. 4.— 67P dust mass distribution at 2.2 au pre-perihelion. Left panel, continuous line: upper and lower limts of the predicted dust loss rate (Fulle et al. 2010). The power index of the associated differential size distribution is –3 below 10−6 kg and –4 above 10−5kg. Left panel, dashed line: observed dust loss rate (29
GIADA detections in the 2 lower mass bins; and 28 OSIRIS detections in the 5 upper mass bins, assumed bulk density of 103 kg m−3; data in Tab. 5). Left panel, dotted line: observed dust loss rate (28 OSIRIS
detections in the 5 upper mass bins, assumed bulk density of 3 × 10³ kg m−3). Right panel: observed Af ρ
(GIADA detections in the 2 lower mass bins, OSIRIS detections in the 5 upper mass bins; dashed line, assumed dust bulk density of 103kg m−3; dotted line, assumed dust bulk density of 3 × 10³ kg m−3). The
Fig. 5.— 67P dust mass distribution at 2.1 au pre-perihelion. Left panel, continuous lines: upper and lower limits of the predicted dust loss rate (Fulle et al. 2010). The power index of the associated differential size distribution is –3 below 10−6 kg and –4 above 10−5kg. Left panel, dashed line: observed dust loss rate (39
GIADA detections on 28 March 2015 in the 3 lower mass bins; and 74 OSIRIS detections in the 4 upper mass bins, assumed bulk density of 103kg m−3; data in Tab. 6). Left panel, dotted line: observed dust loss rate
(81 GIADA data on 13-17 March 2015 in the 3 lower mass bins; and 74 OSIRIS detections in the 4 upper mass bins, assumed bulk density of 3 × 10³ kg m−3; data in Tab. 7). Right panel: observed Af ρ (GIADA
detections in the 3 lower mass bins, OSIRIS detections in the 4 upper mass bins; dashed line, assumed dust bulk density of 103kg m−3; dotted line, assumed dust bulk density of 3 × 10³kg m−3). The total dust loss
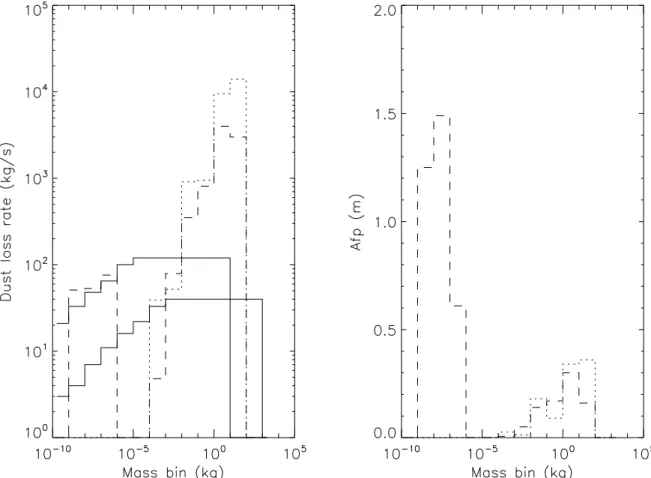
Fig. 6.— 67P dust mass distribution at perihelion. Left panel, continuous lines: upper and lower limits of the predicted dust loss rate (Fulle et al. 2010). The power index of the associated differential size distribution is –3.6 below 10−6 kg and –4 above 10−5 kg. Left panel, dashed line: observed dust loss rate (124 GIADA
detections in the 3 lower mass bins; and 102 OSIRIS detections in the 6 upper mass bins, assumed bulk density of 103kg m−3, data in Tab. 8). Left panel, dotted line: 102 OSIRIS detections in the 6 upper mass
bins, assumed bulk density of 3 × 10³ kg m−3). Right panel: observed Af ρ (GIADA in the 3 lower mass
bins, OSIRIS in the 6 upper mass bins; dashed line, assumed dust bulk density of 103kg m−3; dotted line,
assumed dust bulk density of 3 × 10³kg m−3). The total dust loss rate is (1.7 ± 0.9) × 104kg s−1in all mass
Fig. 7.— Resolved boulder (on the left) observed by OSIRIS NAC camera on 30 July 2015, 22h07m UT. Nucleus distance R = 180 km, boulder at D = 3.5 km and of radius r = 0.4 m. 67P nucleus on the right.