HAL Id: hal-00008807
https://hal.archives-ouvertes.fr/hal-00008807
Preprint submitted on 16 Sep 2005
HAL is a multi-disciplinary open access
archive for the deposit and dissemination of
sci-entific research documents, whether they are
pub-lished or not. The documents may come from
teaching and research institutions in France or
abroad, or from public or private research centers.
L’archive ouverte pluridisciplinaire HAL, est
destinée au dépôt et à la diffusion de documents
scientifiques de niveau recherche, publiés ou non,
émanant des établissements d’enseignement et de
recherche français ou étrangers, des laboratoires
publics ou privés.
Evolution of morphology in the Chandra Deep Field
South
Sébastien Lauger, Olivier Ilbert, Véronique Buat, Laurence Tresse, Denis
Burgarella, Stéphane Arnouts, Olivier Le Fèvre
To cite this version:
Sébastien Lauger, Olivier Ilbert, Véronique Buat, Laurence Tresse, Denis Burgarella, et al.. Evolution
of morphology in the Chandra Deep Field South. 2005. �hal-00008807�
ccsd-00008807, version 1 - 16 Sep 2005
Evolution of morphology in the Chandra Deep Field South
S´ebastien Lauger1 , Olivier Ilbert2 , V´eronique Buat1 , Laurence Tresse1 , Denis Burgarella1 , St´ephane Arnouts1 , Olivier Le F`evre1
, and the VVDS team1,2 1
Laboratoire d’Astrophysique de Marseille, Marseille, France
2
INAF-Osservatorio Astronomico di Bologna, Bologna, Italy
Abstract. We studied the morphology of galaxies in the Chandra Deep Field South using ACS multi-wavelength data from the Great Observatories Origin Deep Survey and 524 spectroscopic redshifts from the VIMOS VLT Deep Survey completed with 2874 photometric redshift computed from COMBO-17 multi-color data. The rest-frame B-band makes it possible to discriminate two morphological types in an asymmetry-concentration diagram: bulge- and disk-dominated galaxies. The rest-frame color index B − I is found to be very correlated with the morphological classification: wholly bulge-dominated galaxies are redder than disk-dominated galaxies. However color allowed us to distinguish a population of faint blue bulge-dominated galaxies (B − I < 0.9), whose nature is still unclear. Using the rest-frame B-band classification from z ∼ 0.15 up to z ∼ 1.1, we quantified the evolution of the proportion of morphological types as a function of the redshift. Our large sample allowed us to compute luminosity functions per morphological type in rest-frame B-band. The bulge-dominated population is found to be composite: on the one hand the red ((B − I)AB >0.9), bright galaxies, which seem to increase in density toward low
redshifts. On the other hand the blue, compact, faint bulge-dominated galaxies, strongly evolving with the redshift.
1
Introduction
Hierarchical models predict the formation of massive elliptical galaxies by merging of smaller galaxies. One way to put some constraints on these scenarios is to measure the evolution of the morphology of galaxies with the redshift to find a link with physical processes acting on them.
The peculiar morphologies observed at high redshift (e.g. [18]), and the need for automatic and objective morphological classification led to the development of quantitative methods, notably based on asymmetry and concentration parameters (e.g. [3], [1], [12]). The morphological study of distant galaxies was most often restricted to only one band, and their morphologies may suffer from morphological k-corrections above z ∼ 1 and from the intrinsic galaxy evolution ([1], [4]). Today multi-band data provides a rest-frame classification comparable over all the redshift range.
Up to now, most of the luminosity functions (LFs) at low and high redshifts were computed using spectral or photometric types of galaxies. However a galaxy of a given morphological type may change of spectral type as a function of the redshift by following a passive evolution. Morphology brings a complementary, alternative way to study the evolution of galaxies. The automatic morphological classification of a large sample of galaxies allowed to compute the LFs per morphological type and per bin of redshift. The used cosmology is: H0= 70
km s−1 Mpc−1, Ω0= 0.3, Λ0= 0.7. Magnitudes are given in the AB system.
2
Data and method overview
We used images provided by the Great Observatories Origins Deep Survey (GOODS, [9]) with the Hubble Space Telescope (HST) and the Advanced Camera for Surveys (ACS) of the Chandra Deep Field South (CDFS) in the F850LP, F775W, F606W and F435W filters (called hereafter z, i, V , and B bands). From these images, we built two samples.
The first sample used the public data release of the VIMOS VLT Deep Survey (VVDS, [13]) which provide 1599 spectroscopic redshifts up to IAB = 24 in the CDFS. So we secured HST multi-band imaging and redshifts for
524 galaxies up to IAB = 24 and z ∼ 4. The second sample used the photometric redshifts derived from the
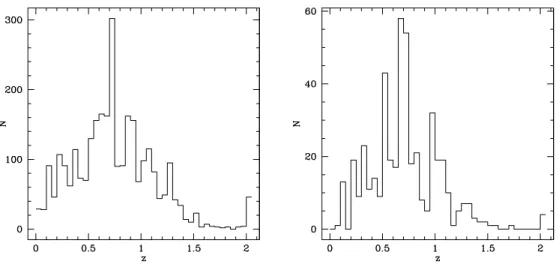
multicolor catalogue of COMBO-17, described in [10]. This photometric redshift sample contains 2874 galaxies at IAB <24. The redshift distribution of galaxies shows that there is a dense structure around z ∼ 0.7 (Figure
1). This is consistent with the results obtained with spectroscopic redshift (e.g. [13], [2]).
For both samples we computed concentration (C) and asymmetry (A) parameters for the images of each galaxy in the four bands. These parameters are defined in [12].
Figure 1: Photometric (on the left) and spectroscopic (on the right) redshift distribution of the galaxies selected at IAB= 24.
3
The morphological classification
Although the method is subjective, we visually classified the galaxies of the spectroscopic redshift sample. We defined the following visual classes: compact galaxies: quasi-stellar objects, small and concentrated. Elliptical galaxies: bulge-like galaxies without any outer visible structure. Early spiral galaxies: bulge-dominated galaxies with an outer visible disk. Late spiral galaxies: disk-dominated galaxies. Irregular galaxies: no apparent structure. Merger galaxies: major or minor disturbed appearance, double cores; and finally: miscallenous. We plotted an (A, C) diagram of the whole sample in rest-frame (RF) B-band as a function of the visual classification (Figure 2). The visual classification is quite consistent with the automatic classification. We visually traced a line separating the disk-dominated galaxies and the bulge-dominated galaxies. Even if for the faintest galaxies the visual classification is strongly subjective and less reliable, the comparison between quantitative and visual classifications remains in excellent agreement.
Figure 2: Asymmetry-concentration diagram of the spectroscopic redshift sample, as a function of the visual classification.
4
Morphology and color
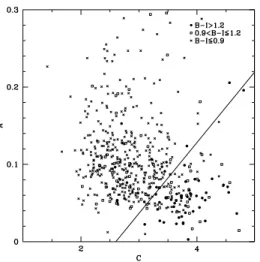
We studied the dependence on the color of the (A, C) diagram. Absolute magnitudes and color indices were determined by fitting spectral energy distribution (SED) templates at fixed spectroscopic redshift on COMBO-17 multi-color data ([20]) using Le Phare1
(S. Arnouts & O. Ilbert). RF color index and location in the (A, C) diagram seem correlated (Figure 3). The reddest objects are mostly the bulge-dominated galaxies; and the bluest are mostly the disk-dominated galaxies. It clearly appears some unexpected population of red (or blue) galaxies in the disk-dominated area (or respectively bulge-dominated area). The red galaxies in the disk-dominated area could be simply explained by extinction. The nature of the blue population in the bulge-dominated area remains unclear (see later). Both informations, morphology and color, are complementary to discriminate between two different populations in the bulge-dominated area. It is crucial to interpret our results in the galaxy evolution.
Figure 3: Asymmetry-concentration diagram of the spectroscopic redshift sample, as a function of the rest-frame color index (B − I)RF.
5
Evolution with the redshift
A large number of galaxies is required to perform a study of the galaxy evolution. In order to improve our statistics, we used hereafter the huge photometric redshift sample.
We selected the 817 galaxies that are brighter than MAB(B) = −20 in the range of redshift [0.15-1.1], in
order to avoid selection effects in apparent magnitude (IAB < 24). In Figure 4, on the left, we plotted the
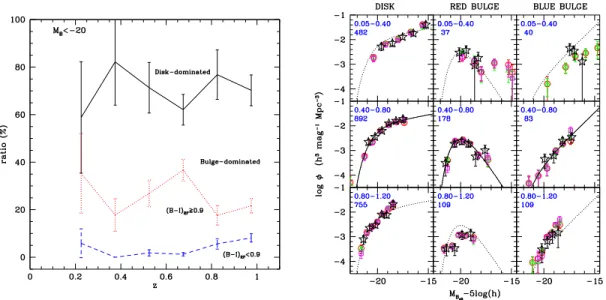
proportion of bulge- and disk-dominated galaxies as a function of the redshift. We did not see any evident trend in the variation with z of the proportion of morphological types. This result suggests that the majority of early-type galaxies was in place at z ∼ 1, in agreement with the works of [17], [11] and [5]. The only general trend is for the bluest bulge-dominated galaxies (B − I < 0.9). These galaxies are more frequent (or brighter) at high redshift: their rate monotonically increases from z ∼ 0.4 toward z ∼ 1. The proportion of each type is sensitive to the presence of large structures in the field. At z ∼ 0.7 which is a high-density region, the rate of red bulge-dominated galaxies is particularly high, reaching 38% of the galaxies at this redshift. Our results are consistent with morphology-density relations (e.g. [7]). The high rate of bulge-dominated galaxies in dense environment is expected in the hierarchical picture since there is an higher probability of merging in the large structure of black matter. However a volume limited sample has the inconvenient to throw out the faintest galaxies of the sample, which is an inconvenient to study the evolution of this faint blue bulge-dominated population.
We derived the LF per morphological type using the Algorithm for Luminosity Function (ALF) described in [10]. The Figure 4 shows on the right the evolution of the disk-, red bulge- and blue bulge-dominated populations from z = 0.05 up to z = 1.2. The results obtained with the photometric redshift sample are fully in agreement with the results obtained with the spectroscopic redshift sample (see the open stars of Figure 4, on the right). This comparison insured us that our measurement of the LF evolution is not due to systematic trends in the photometric redshift estimate.
Figure 4: Evolution of the proportion of bulge- and disk-dominated galaxies brighter than MAB(B) = −20, at
0.15 < z < 1.1. The bulge-dominated population is divided into a blue (RF B − I < 0.9) population (dashed line) and a red (RF B − I ≥ 0.9) population (dotted line). Each point is computed on an interval of redshift ∆z = 0.15. The error bars at 1σ are poissonnian.
The LF of the dominated galaxies remains consistent over all the redshift range. The slope of the disk-dominated galaxies is also in agreement with local values obtained by [14] or by [16]. We found a very small evolution of the disk-dominated population although irregular galaxies which are included in the disk-dominated population are expected to evolve strongly with z. The density of the red bulge-dominated population decreases at high redshift z = 0.8 − 1.2. The evolution of the LF for the red bulge-dominated population is opposite to the increase in density observed by [6] between z = 0.5 − 0.75 and z = 0.75 − 1 but is in agreement with the result obtained by [8] on the same field. However, the observed evolution of the red bulge-dominated population remains small in comparison to the strong decrease in density of the elliptical galaxies measured by [19] using a photometric type. Our results show rather a population of Ell/S0 galaxies already in place at z ∼ 1.
The LF slope of the blue bulge-dominated population remains extremely steep in all the redshift bins. This population strongly evolves. To quantify the LF evolution, we first set the M∗−αparameters to the z = 0.4−0.8
values and look for an evolution in Φ∗. We measure an increase in density of a factor 2.4 between z = 0.4 − 0.8
and z = 0.8 − 1.2. Using the same procedure, we set the α − Φ∗parameters to the z = 0.4 − 0.8 values and look
for an evolution in M∗. We measure a brightening of 0.7 magnitude between z = 0.4 − 0.8 and z = 0.8 − 1.2.
The same trend is also present between z = 0.05 − 0.4 and z = 0.4 − 0.8.
The nature of these blue, faint bulge-dominated galaxies must be investigated. It is unlikely than a large fraction of this blue bulge-dominated population are misclassified spiral at high redshift since the visual inspection of the UV rest-frame image at z ∼ 1 should have clearly shown star formation region in the spiral arms. If a large fraction of these blue bulge-dominated galaxies are misclassified spirals at z < 0.7 as claimed by [8], the observed evolution of the blue bulge-dominated galaxies is even stronger.
6
Conclusions
1. Using multi-band imaging of HST/ACS, we were able to build a reliable morphological classification of galaxies in the CDFS. An asymmetry-concentration diagram in rest-frame B band allowed us to distinguish bulge- and disk-dominated galaxies. The study of the correlation between morphology and color highlights that both informations are complementary: even if the link between morphology and color is very strong, we found unexpected blue bulge-dominated galaxies whose nature is still unclear.
2. Using a MAB(B) < −20 selection within the interval of redshifts [0.15-1.1], we studied the evolution of
the proportion of morphological types with the redshift. We did not find any significant general trend in the variation with z of the proportion of disk- and bulge-dominated galaxies, in agreement with works of [17], [11], [5] who suggested that the majority of early-type galaxies was already in place at z ∼ 1.
3. The variation of the proportion of morphological types appeared to be very sensitive to the presence of large structures. At z ∼ 0.7 where a wall of galaxies is detected in the redshift distribution, the proportion of bright red bulge-dominated galaxies reached a peak of 38%, to about 20% at z = 0.4 and at z ∼ 0.8. This results is consistent with the hierarchical scenario of formation of early-type galaxies.
4. We derived the rest-frame B-band LF per morphological type up to z = 1.2. We obtained a strong dependency of the LF shape on the morphological type. The LF of the disk-dominated population has a steep slope, which does not change significantly with the redshift. The LF of the bulge-dominated population is the combination of two populations: a red, bright population (68% of the bulge-dominated sample) with a strong decreasing slope; and a blue population of more compact galaxies (32% of the bulge-dominated sample) dominating the fain-end of the LF.
5. We measured an increase in density of red bulge-dominated population with the age of the Universe. The observed evolution of the red bulge-dominated LF could be related to the building-up of massive elliptical galaxies in a hierarchical scenario, formed by merging and accretion of smaller galaxies. We observe a very strong evolution of the blue bulge-dominated population corresponding to a brightening of 0.7 magnitude (or an increasing in density by a factor 2.4) between z ∼ 0.6 and z ∼ 1.
Our analysis clearly shows the next steps toward a strong constraint on the scenarios of galaxy formation: an increase of the covered area to limit the cosmic variance which will be possible with the COSMOS survey, the development of quantitative methods to discriminate more morphological classes in particular merger and irregular galaxies, the necessity to combine morphological and spectral classifications.
References
[1] Abraham, R. G., van den Bergh, S., Glazebrook, K., et al., 1996, ApJS, 107, 1 [2] Adami C., Mazure A., Ilbert O. et al., 2005, A&A, submitted
[3] Bershady, M. A., Jangren, A., & Conselice, C. J. 2000, AJ, 119, 2645. [4] Brinchmann, J., Abraham, R., Schade, D., et al. 1998, ApJ, 499, 112 [5] Conselice, C. J, Blackburne, J. A., & Papovich, C. 2005, ApJ, 620, 564 [6] Cross N.J.G., Bouwens R. J., Ben´ıtez N. et al., 2004, AJ, 128, 1990 [7] Dressler, A., Oemler, A., Couch, W. J., et al. 1997, ApJ, 490, 577
[8] Ferreras I, Lisker T., Carollo C.M., Lilly S.J., Mobasher B., 2005, ApJ, submitted, astro/0504127 [9] Giavalisco, M., Ferguson, H. C., Koekemoer, A. M., et al. 2004, ApJ, 600, L93
[10] Ilbert, O., Lauger, S., Tresse, L., et al. 2005, submitted [11] Kajisawa, M. & Yamada, T. 2001, pasj, 53, 833
[12] Lauger, S., Burgarella, D., & Buat, V. 2005, A&A, 434, 77
[13] Le Fevre, O., Vettolani, G., Tresse, L., et al. 2004, A&A, 428, 1043 [14] Marinoni C., Monaco P., Giuricin G. & Costantini B., 1999, ApJ, 521, 50 [15] Menanteau F., Martel A.R., Tozzi P. et al., 2005, ApJ, 620, 697
[16] Nakamura O., Fukugita M., Yasuda N. et al., 2003, ApJ, 125, 1682 [17] Schade, D., Lilly, S. J., Crampton, D., et al. 1999, ApJ, 525, 31 [18] van den Bergh, S. 2002, PASP, 114, 797
[19] Wolf C., Meisenheimer K., Rix H.-W. et al., 2003, A&A, 401, 73