Development of a methodology for evaluating investments in
infrastructure for the sustainable exploitation of shale energy in
Argentina
byBruno R. Agosta
Civil Engineer, Pontifical Catholic University of Argentina, 2008
Submitted to the Department of Civil and Environment Engineering in partial fulfillment of the requirements for the degrees of
Master of Science in Transportation
at the
MASSACHUSETTS INSTITUTE OF TECHNOLOGY
MASSACHUSETTS INSTITUTE
OF TECHNOLOLGY
JUL
02
2015
LIBRARIES
June 20152015 Massachusetts Institute of Technology. All rights reserved.
Signature redacted
Sign atu re o f A u th o r ... .. .. ... ...
Department of Civil d E
iro
nta1 ineering Iay 21,2015 Certify by... JR East Prof Accepted by...S ig r
Signature redacted
V Joseph M. Sussmanor
of Civil and Environmental Engineering and Engineering Systems Thrsis Supervisornature
redacted
J ' Held epf
Donald and Martha Harleman Professor of Civil and Environmental Enginering Chair, Departmental Committee for Graduate Students
Development of a methodology for evaluating investments in infrastructure for the
sustainable exploitation of shale energy in Argentina
by Bruno R. Agosta
Submitted to the Department of Civil and Environmental Engineering on May 21, 2015 in partial fulfillment of the requirements for the degree of Master of Science in Transportation
Abstract
In 2011, a new word entered into the popular vocabulary of Argentina: Vaca Muerta (VM, literally:
Dead Cow); almost like a discovery, it was announced that Argentina had large hydrocarbon
resources that were trapped in underground shale and tight rocks. In reality, these resources were known by geologists from the beginning of the oil industry, but only became economically extractable in the 2000s, with the use of two old technologies developed in the US and already used on conventional fields: hydraulic fracturing and horizontal drilling. With this "discovery," the Argentine energy perspective changed radically: a sector that was declining became dynamic again and became a target for investment for a project that for many Argentines was still just a name. By 2014, around three billion dollars has been invested in VM almost exclusively by the oil & gas sector, led by the national oil company (YPF), but there were very few analyses on how VM would affect other sectors, like the logistics and transportation system. By the intrinsic technical characteristics of these two essential technologies, the amount of inputs required in the wellheads is extremely high (especially in comparison with conventional exploitations), producing a strong demand for transportation and logistics services. This high volume of transportation services requires infrastructure capacity, meaning large long-term investments. Following this, a key question arises: who should pay for new capacity of public infrastructure that will be used by a few actors in a private business (oil and gas) that is profitable? Should it be the public sector through the use of tax-revenues or should it be the private sector that must pay with its own savings
generated by using more efficient transport modes?
Seeking to answer these questions, this thesis developed and implemented a Simultaneous Economic-Financial Analysis Model (SEFAM) to evaluate the private and public incentives that will finally determine investment alternatives to achieve socially optimal solutions. The CLIOS Process, for studying complex sociotechnical systems, is used to study the relationships between the shale oil production system and the logistic and transportation system, with the institutional actors that govern them. The East-West VM supply corridor was selected as the research case of this thesis, in order to implement SEFAM and draw some general conclusions.
This research describes this interaction between shale energy production and its logistic and transportation requirements, along with the proposition of certain questions that advance a better understanding of the problem. SEFAM is then seen as an integrative tool that allows the decision-maker to have useful and relevant information for a prospective negotiation process between the public and private sectors, looking to ensure the implementation of the socially optimal alternative.
Thesis Supervisor: Joseph M. Sussman
"If we had to summarize in one sentence the mission of engineers and technical workers in this country [Argentina] today, we could say that it is to be at the service of national development. So, that they should stimulate the productiveforces, widening at the same time the social and economicfoundations of our democracy. It is essential that our engineers and technicians take into account the national reality and the need to transform it into a reality of progress and welfare. This means that they must act in technical-economic function and should deepen and enhance its scientific and technological capacity, aiming to solve the most urgent problems of our economy."
Arturo Frondizi
32nd President of Argentina (1958-1962)
Acknowledgements
This incredible experience at MIT and in particular this thesis would not have been possible without the help of many people, to which this work is dedicated. I feel fortunate, and I thank God, to have had the support of such good people who helped me in this challenging path.
To Joe Sussman, who trusted in me and my ideas and proposals over these years; your unconditional support was a source of inspiration and confidence, professionally and personally. To Fred Salvucci and Mikel Murga, who were always open to give me advice and personal support from the beginning of this initiative.
To members of the HSR/R research group: Maite, Sam, Rebecca, Joanna, Patton, Alex, Tatsu, Soshi, Tommy, Ryan and Joel, thank you for the meetings, presentations and discussions that enriched this experience. Also to members of the Transit research group, with whom I shared my first year at MIT.
To a group of outstanding professionals and researchers from different sectors who gave me their time to listen and criticize my ideas, helping to improve them, in particular to: Eduardo Levy Yeyati, Tony Gomez Ibanez, Rafael Di Tella and Robert Kleinberg. Also, a special thanks to Kate Konschnik from Harvard Law School, who created with great dedication the informal discussion group about shale that helped me to know more about the subject, but especially surprised me with the openness and conciliatory spirit in a subject of heated debate.
I'm profoundly thankful to Miguel Galuccio for trusting an Argentine student initiative to further explore new subjects and his excellent team at YPF, led by Fernando Giliberti: Sergio Affronti, Daniel Quifnones, Marcelo Broccoli, Enrique Bevilacqua and Sebastian Sabatini.
To my groups of friends in Argentina and to our new friends in Boston: thanks for your highest value of friendship and for giving advice, listening and challenging ideas.
However, the key to these acknowledgments is my family. To my wife Natalia for her unconditional support and love; to my sisters Laura and In6s who are always present, even living at opposite ends of the world. And in particular to my parents, Carola and Roberto that gave me everything that I am and in particular the desire to always seek more, be a better person and work hard to achieve a more equitable society. To my grandparents Elba, Betty, and Salvador who taught me by example the culture of work, family dedication and courage to face new challenges, even the most difficult. Special thanks to the institutions that financially supported me and my research at MIT over this years: the Fulbright Commission, the BEC.AR program of the Cabinet of Ministers of the Argentine government, the Organization of American States and the International Road Federation.
Biographical note
Bruno R. Agosta is a Civil Engineer from the Catholic University of Argentina (UCA). Upon his graduation in 2008, he received the Medalla de oro, the university's highest award for graduating students, and was the valedictorian with the highest GDP along graduating civil engineers by the Civil Engineers Professional Council of Argentina (CPIC). Before joining MIT, Bruno led logistics and transportation infrastructure projects in Europe and Latin America, and since 2011 has been part of the engineering company AC&A. In 2013, Bruno was awarded the Fulbright-BEC.AR Fellowship, the Organization of American State (OAS) Scholarship representing Argentina and the International Road Federation Fellowship, to study for a master's degree in the United States. Bruno grew up in Buenos Aires, Argentina where his family still resides.
Table of Contents
Chapter 1. Introduction and Motivation...15
1 .1 . T h e sis P u rp o se...2 0 1.2. Thesis Questions and Approaches ... 21
1.3. Simultaneous Economic-Financial analysis ... 23
1.4. Research Case: corridor to supply Vaca Muerta (VM)... 24
1 .5 . C lo s in g ... 2 5 Chapter 2. Understanding shale energy, its infrastructure requirements and characteristics...26
2 .1 . S h a le E n e rg y ... 2 6 2.2. The shale energy transportation and logistic system ... 72
2.3. Findings and initial conclusions...87
Chapter 3. The interactions between the actors involved in the infrastructure development for VM 88 3.1. Background on CLIOS System Representation stage ... 88
3.2. CLIOS System representation diagram ... 88
3.3. Institutional actors and their interactions... 90
3.4. Initial bundles of strategic alternatives ... 93
3.5. Findings and initials conclusions...95
Chapter 4. A methodology for Simultaneous Economic-Financial Analysis to evaluate in frastru ctu re altern atives... 9 7 4.1. Need for a new methodology...97
4.2. Structure of the Simultaneous E conomic-Financial Analysis Model (SEFAM)...100
4 .3 . V alu e ad d ed by SE FA M ... 1 10 4.4. Implementation of SEFAM to the research case of VM ... 112
4.5. Findings and initial conclusions of the implementation of SEFAM to the VM research case 128 Chapter 5. Conclusions, recommendations and further research questions. ... 131
5 .1. Su m m ary of th e context...13 1 5 .2 . F in d in g s... 1 3 3 5.3. Problem formulation and Methodological Approach ... 139
5.4. Conclusions and Recommendations... 142
5.5. Further questions and final Thoughts ... 144
A ) A p p e n d ix ... 1 4 6
List of figures
Figure 1-1 World petroleum and other liquid fuel consumption by region in million barrels per day
(E IA 2 0 1 4 ) ... 1 7
Figure 1-2 Total world's energy consumption by source in 2012 in quadrillion Btu (EIA
International Energy Statistics w ebsite)... 17
Figure 1-3 World liquids fuel production in million barrels per day 1990-2035 (EIA 2011b)...18
Figure 1-4 Research case corridor (Adapted from Google Earth) ... 24
Figure 2-1 Basics of petroleum system processes (AAPG 1990)... 26
Figure 2-2 Conventional and Unconventional Reservoir Types (WSGS 2015)...27
Figure 2-3 Horizontal drilling allows the exploitation of the Barnett reservoir below the Dallas/Fort Worth (DFW) Airport (Star Telegram 2015)... 29
Figure 2-4 Horizontal drilling + hydraulic fracturing schematic well (Council of Foreign Relations 2 0 1 5 ) ... 3 1 Figure 2-5 Oil and Gas production per shale formation in the US (EIA Drilling Productivity Report F e b 2 0 1 5 ) ... 3 2 Figure 2-6 US shale oil by play projection (Wood Mackenzie 2014)... 32
Figure 2-7 US petroleum and other liquids fuel supply by source 1970-2040 in million barrels per d a y (E IA 2 0 1 4 b ) ... 3 3 Figure 2-8 Bakken-Three Forks: per well production and decline curves overt ime, 2007-2012 (M a u g e ri 2 0 1 3 )... 3 4 Figure 2-9 Map of basins with assessed shale oil and shale gas formations, as of May 2013 (EIA 2 0 1 3 ) ... 3 6 Figure 2-10 World shale oil production in the Reference case, 2010 and 2040 in million barrels per d a y (E IA 2 0 1 4 )3...3 9 Figure 2-11 Crude oil and natural gas production in Argentina (Author with data from IAPG)...45
Figure 2-12 Gas -Balance of trade of Argentina (Author with data from ASoE)... 46
Figure 2-13 Crude Oil -Balance of trade of Argentina (Author with data from ASoE)...46
Figure 2-14 Overview of YPF (YPF Investor Presentation-March 2015)...50
Figure 2-15 Argentine crude oil and natural gas production in 2014 by company (Author with data fro m A S o5E ) ... 5 3 Figure 2-16 Argentine main basins (YPF Investor Presentation-March 2015) ... 54
Figure 2-17 Crude oil and product main pipelines in Argentina in 2015 (Author with data from A S o E ) ... 5 6 Figure 2-18 Main gas pipelines in Argentina (Author with data from ASoE)... 58
Figure 2-19 Market share in the downstream sector of Argentina 2014 (Author with data from A So E)... ... ... ... . . . ... ... .. 5 9 Figure 2-20 Argentine main crude oil refineries (Author with data from ASoE-letters reference in first colu m n of T ab le 2 -1 0 )...6 0 Figure 2-21 Total energy domestic consumption in Argentina in thousands of Tonne of Oil Equivalent (Author with data from ASoE)... 61
Figure 2-22 Changes in the energy domestic supply between 1979 and 2013 (Author with data fro m A S o E ) ... 6 1 Figure 2-23 Composition on input energy for electricity generation in 2013 (Author with data from A S o E ) ... 6 2 Figure 2-24 Prospective shale basins of Argentina (EIA 2013)... 63
Figure 2-25 Neuqu n Basin stratigraphy (Howell et. al. 2005)... 65
Figure 2-26 Main indicator comparison between US shale plays and VM (YPF VM Update 2014) .... 67
Figure 2-27 Evolution of the number drilling rigs in Argentina (Author with data from Baker H u g h e s w eb site) ... 6 8 Figure 2-28 Evolution of the well drilling cost (YPF VM Update 2014)... 70
Figure 2-29 Volumes trucks by stage of development (Department of Environmental Conservation, State o f N ew Y o rk, U SA )...7 4
Figure 2-30 Logistics requirements by stage (Accenture 2012)...74
Figure 2-31 Logistics structure typical of unconventional hydrocarbon developments in the US (Accenture Logistics Marcellus Field Study, August 2011)... 75
Figure 2-32 Logistics costs by material type for all wells drilled and completed on one pad (Delloite W ellsite Logistics M odel 2012 from OGJ 2012) ... 75
Figure 2-33 Local and regional impact according to transportation volume and distance (Author) 76 Figure 2-34 National and Provincial road subsystem (DNV and DPV Neuqu6n)... 78
Figure 2-35 Ferrosur Roca concession network (Adapted from Ferrosur Roca website)... 79
Figure 2-36 Total freight volume in railroad in Argentina (Martinez 2014)... 80
Figure 2-37 Aerial view of a well in Bakken shale (PLG 2013)... 81
Figure 2-38 Example of supply chain frac-sand from a mine in Minnesota to a well in Wyoming. (A ccen tu re re search ) ... 8 2 Figure 2-39 Cost structure of frac-sand in the US (Accenture Research)... 82
Figure 2-40 Cost improvements closely related to logistics optimization (YPF VM Update 2014) .... 83
Figure 2-41 Example proximity of an unconventional well with suburban towns of Pennsylvania, U SA (city -d ata .co m )...8 4 Figure 3-1 CLIO S representation (A uthor) ... 89
Figure 3-2 Bundles of strategic alternatives for developing logistics infrastructure in the East-West VM supply corridor -Research case-(Author) ... 94
Figure 4-1 Comprehensive methodology of SEFAM (Author)...101
Figure 4-2 Mathematical formulation of the comparison of economic and financial alternatives (A u th o r)1...1 0 2 Figure 4-3 Main characteristic of Kurowski's analysis framework (Kurowski et al. 2011)...104
Figure 4-4 Layout steps Stage A: Global Economic Assessment (Author) ... 105
Figure 4-5 Layout steps Stage B: Financial Evaluation for YPF (Author)...108
Figure 4-6 Interaction of the simultaneous economic and financial analysis (Author)...111
Figure 4-7 Detailed map (Author adapted from Google Earth and provincials official cartography) ... 1 1 3 Figure 4-8 Bundles of strategic alternatives for developing logistics infrastructure in the East-West VM supply corridor - Research case- (Author) ... 114
Figure 4-9 Traffic (2013) profile on RN 22 on each km, identifying the cities and provinces it crosses (A uthor w ith data from D N V ) ... 1 17 Figure 4-10 Alternatives for the Financial Analysis in the bottom row (Author)...121
Figure 4-11 Results Global Economic Assessment (Author)...123
Figure 4-12 Results financial evaluation of alternatives for a private company in current $/tonne by ty p e o f co st (A u th o r)... 1 2 4 Figure A-1 Tight vs. conventional production curves (Barchana Advisory)...147
List of tables
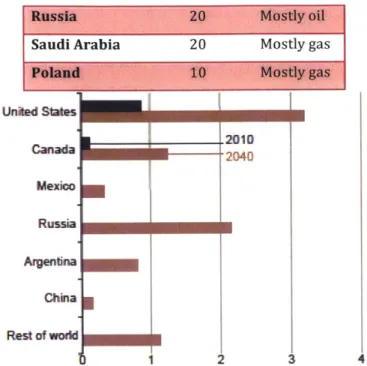
Table 2-1 Top-10 countries with technical recoverable reserves shale oil and shale gas resources (2013) and their total crude oil and natural gas reserves (2014). (Author with data from EIA).
... ... ... .. ... ... ... ... ... .... ... .. .. ... ... ... 3 6
Table 2-2 Estimated number of shale gas and tight oil wells drilled in 2013 (Author with data from
K le in b e rg 2 0 1 4 ) ... 3 8
Table 2-3 Production and reserves of YPF and Argentina during Repsol period 1999 to 2011
(Author with data from ASoE and HBS 2015) ... 48
Table 2-4 Benchmark of distribution of dividends as % of Net Income in 2010 in local currency (H B S 2 0 1 3 ) ... 4 8 Table 2-5 Shareholders structure of YPF under Entenssoro and Galuccio management (Author) .... 49
Table 2-6 Crude Oil production per basin in 2014 (Author with data from ASoE)...54
Table 2-7 Natural gas production per basin in 2014 (Author with data from ASoE) ... 54
Table 2-8 Crude oil main pipelines in Argentina (Author with data from ASoE) ... 56
Table 2-9 Refined products main pipelines in Argentina (Author with data from ASoE)...57
Table 2-10 Main crude oil refineries in Argentina (Author from various sources indicated below).59 Table 2-11 Argentine shale gas and shale oil reserves with conservative recovery factors (KPMG 2 0 1 4 ) ... 6 4 Table 2-13 YPF's Joint Ventures for exploiting VM (Author with data from YPF Investor P resen tation -M arch 2 0 15 ) ... 6 9 Table 2-14 Drilling related truck movements per well in Bakken (Author with data from Tolliver 2 0 1 4 ) ... 8 5 Table 4-1 "Yes" and "No" basis statements for public investment of new infrastructure (Author) ... 98
Table 4-2 Details of alternatives A and B (Author) ... 115
Table 4-3 Transportation capacity by unit (Author)...115
Table 4-4 Num ber of trips per alternative (Author)... 116
Table 4-5 Impact of VM on RN22 road deterioration (Author) ... 117
Table 4-6 Impact on congestion by traffic generated by VM (Author)...118
Table 4-7 Impact on the number of road accidents by traffic generated by VM (Author)...118
Table 4-8 Fuel burned and CO2 generated by alternative (Author)...119
Table 4-9 Railroad construction w orks (Author) ... 119
Table 4-10 Economic operating cost (Author)... ... 120
Table 4-11 Results Global Economic Assessment (Author) ... 121
Table 4-12 Results of financial evaluation of alternatives (Author)... 122
Table 4-13 Analysis of additional income for the government due to VM (Author) ... 126
Table 4-14 Return of investment analysis for the public sector (Author) ... 127 Table A-1 Main players in the Neuqu6n Basin for oil and natural gas production (Author with data
fro m A S o E ) ... 1 4 6
Table A-2 Assessment of congestion impact: application methodology Chapter 20 of HCM (2000)
Glossary of terms and acronyms
AADT Annual Average Daily Traffic ASoE Argentine Secretary of Energy
BCA Benefit Cost Analysis
BTU British Thermal Unit
CLIOS A methodology for studying for studying complex sociotechnical systems Process described in Sussman (2014).
CLIOS system Complex, large-scale, interconnected, open, sociotechnical system (Sussman 2014)
DNV Direcci6n Nacional de Vialidad of Argentina EIA United States Energy Information Administration
ENARSA State owned energy company of Argentina. The acronym refers to ENergia
ARgentina Sociedad Annima
ESAL Equivalent Single Axle Load
GyP Gas y Petr6leo de Neuqu6n. Provincial state-owned oil company
HCM Highway Capacity Manual
IOC International Oil Company
jV Joint Venture
LM Los Molles formation
LNG Liquefied Natural Gas
MIT Massachusetts Institute of Technology
NOC National Oil Company
O&G Oil and Gas
OPEC Organization of the Petroleum Exporting Countries
Open Access Open Access involves physical infrastructure (i.e. railways) being made available to clients other than the owners, for a toll
PPP Public-Private Partnership
RN22 Argentine National Highway No 22 RP7 Neuquen Provincial Highway No 7
SEFAM Simultaneous Economic-Financial Analysis Model
Tcf Trillion cubic feet
tonne Metric tonne: unit of mass equivalent to 1,000 kilograms
US United States of America
US DoE United States Department of Energy
VM Vaca Muerta formation
YPF National oil company of Argentina. The acronym refers to Yacimientos
Chapter 1.
INTRODUCTION AND MOTIVATION
In November 2011, a series of public announcements about the "discovery"1 of unconventional oil in a formation called "Vaca Muerta"2 (VM) in Patagonia (NY Times 2011), together with a publication of a US Energy Information Agency (EIA) report indicating that Argentina had the third largest shale gas reserves in the world, after the United States and China (EIA 2011), generated a shock in expectations in the Argentine energy sector. In a very short time, the oil-industry perspective radically changed to such an extent that a resource that less than three years before was not even generally mentioned, was now seen as a potential "game-changer" for the country.
These changes generated a climate of uncertainty about what this "unknown" resource was and what would be the impact on the real economy. The author found himself very intrigued by the potential of these "new" resources that overnight became the great promise of national development, and in particular the implications on transportation and logistics infrastructure development.
After the unification of the country and the consolidation of a federal government in the second half of the nineteenth century, the Argentine economy started a period of extraordinary growth and prosperity, with an economic structure based on the export of agricultural commodities. This period positioned the country as one of the 8 major economies in the world in 1910 (in 2014 it was 24). In this context, Argentina's oil industry was born in late 1907 with the first oil discovery in Comodoro Rivadavia, Patagonia, which was then followed by a series of investments, domestic and foreign (Gadano 2006).
The economic history of Argentina in the twentieth century was marked by political instability, generating a real deterioration of the economy and a partial change in the production structure, incorporating industrial and services sectors, based in major cities. The agricultural sector remained one of the economic pillars of Argentina, but decreased its relative weight. The oil industry followed the general trend, having periods of growth and decline, but always conditioned by the limited amount of oil and gas reserves that were available. In particular, there was a relatively good development of the sector in the late 1990s, when a predominantly private sector
1 Even if the existence of these resources was included in the geological literature since 1892 (AAPG 2012), for the
general public these announcements were seen as "new discoveries" (La Naci6n 2011).
2 The name of Vaca Muerta Formation was introduced to the geological literature in 1931 by an American geologist
Charles E. Weaver, that was exploring the area for the California Stardard Oil (now Chevron) and identified the
investment generated not only self-sufficiency of the country but exportable surpluses. These achievements were blurred for various reasons at the beginning of this century. In any case, Argentina was always considered as a country with oil, but not as an "oil country.3"
Within this context, there was a general feeling that the unconventional oil and gas in Patagonia could be the key for development, allowing the country to return the path of growth and prosperity with social inclusion and the regional and global importance that it once had a century ago. The challenge for the social inclusion is to avoid that the "extractive economy" only benefits part of the population, leaving apart the most vulnerable sectors (The Economist 2012b).
However by 2014, the author realized that beyond the oil industry's own investments, there was no research studying the real challenges that this project would bring to the Argentine society. In particular, there was a need to understand how to assess the impact on existing transportation and logistics infrastructure and to investigate the planning and financing process of the new investments that this development would require. In this regard, studies made in different oil-production states of the US from 2005 were a strong inspiration to identify the real problems that the region and the country would eventually face, and the need to address these challenges in the early stages of the development.
This thesis will try to help answer questions focused on the understanding of the potential of these resources, and then to promote the debate about how transportation and logistics infrastructure should be built, not only to support this development, but also to induce it by lowering transportation costs, gaining greater efficiency.
There is almost general consensus that the world energy consumption will grow in the coming decades at an increasing pace. In 2011, the EIA estimated that the overall energy consumption of the world would increase by 53% between 2008 and 2035 with half of the increase in demand attributed to China and India (Figure 1-1). In this context, fossil fuels continue to be fundamental and probably will remain so in the medium term. In fact the same EIA report estimates that fossil fuels share by 2035 will be 80% of total world energy supply, when currently it is 86% (Figure 1-2).
3 The phrase: "Argentina is not an oil country; it is a country with oil" was apparently said by Gustavo Petracchi,
60 120 100 80 43.6 .2 40 20 2009 Actual 2030 Projections 2040
Figure 1-1 World petroleum and other liquid fuel consumption by region in million barrels per day (EIA 2014)
Figure 1-2 Total world's energy consumption by source in 2012 in quadrillion Btu (EIA International Energy
Statistics website4)
US Energy Information Administration website retrieved on March 6 th, 2015:
http://www.eia.gov/countries/data.cfm.
2010 2020 2025 2035
6 Re
Within this context, the increasing supplies of natural gas extracted from shale (called "unconventional" because of the method of extraction) are in line with the projected growth in natural gas use worldwide. In terms of crude oil, the unconventional are expected to be 12% of world total production by 2035 (Figure 1-3)
world liquids production million barrels per day
History 2008 Projections 1212-100 - 12% 5% 80 40% 60 40 48% 20 0 1990 1995 2000 2005 2010 2015 2020 2025 2030 2035
Figure 1-3 World liquids fuel production in million barrels per day 1990-2035 (EIA 2011b)
But there are still some big issues to be addressed, especially greenhouse gas emissions reduction. Renewables and natural gas are growing fast, but coal will probably still fuel the largest share of the world's electricity in 2035 (EIA 2011), generating the largest share of carbon dioxide emissions. In this regard, gas operations with rigorous control systems to avoid methane leaks, can be
environmentally very efficient for electricity generation in comparison with the burning of coal.
Given that the demand for energy is high and will continue to grow in the future, driven by the development of new emerging economies, and even if energy sources will diversify, at least in the medium term oil and especially gas will continue to be essential. Therefore unconventional resources will be important in the global energy sector, but also can be "game-changers" in regional terms, like in the case of Argentina. This "game-changer" effect, as will be discussed in the following chapters, will be driven in part by oil, but especially by natural gas through the possibility of having "cheap" energy in large amounts available for other sectors, such as for example energy-intensive industries like petrochemicals and aluminum. This multiplier effect goes beyond the energy sector, as is being seen in the last years in the US, and may profoundly impact the industrial structure of a
region or a country. As will be presented in Chapter 2, inbound logistics for natural gas and crude oil are the same since, since both resources require the same extraction technologies. In the case of outbound logistics, in general natural gas is transported by pipelines and crude oil is transported by railcars, pipeline or even trucks.
A parallel point that is worth mentioning at this point is the current debate in some US states and especially in Europe about the environmental risks associated with the technologies required to extract shale oil and shale gas, specifically hydraulic fracturing, commonly called "fracking." At this point, under the scope of this thesis, the author propose a hypothesis in order to allow this thesis to focus on the specific object of this research: infrastructure planning. The hypothesis is to assume that, knowing that environmental risks exist, there are good construction and operating practices implemented in the US and abroad that allow the safe exploitation of these types of resources. This hypothesis is based on the findings of two reports: "The Future of Natural Gas: An Interdisciplinary MIT Study" from the MIT Energy Initiative and the "Second Ninety Day Report" from the Shale Gas Production Subcommittee of the Secretary of Energy Advisory Board of November 2011. These reports state:
MIT Energy Initiative Report (MIT 2011): "The environmental impacts of shale development are challenging but manageable. Shale development requires large-scale fracturing of the shale formation to induce economic production rates. There has been concern that these fractures can also penetrate shallow freshwater zones and contaminate them with fracturing fluid, but there is no evidence that this is occurring. There is, however, evidence of natural gas migration into freshwater zones in some areas, most likely as a result of substandard well completion practices by a few operators. There are additional environmental challenges in the area of water management, particularly the effective disposal of fracture fluids. Concerns with this issue are particularly acute in regions that have not previously experienced large-scale oil and natural gas development, especially those overlying the massive Marcellus shale, and do not have a well-developed subsurface water disposal infrastructure. It is essential that both large and small companies follow industry best practices; that water supply and disposal are coordinated on a regional basis and that improved methods are developed for recycling of returned fracture fluids."
US DoE Report (US DoE 2011): "On August 18, 2011 the Subcommittee presented its initial Ninety-Day Reporti including twenty recommendations that the Subcommittee believes, if implemented, would assure that the nation's considerable shale gas resources are being developed responsibly, in a way that protects human health and the environment and is most beneficial to the nation."
Thus, this thesis will focus on how the decisions about the public infrastructure required for the shale energy development should be made. How should the interaction between public and private actors in the development of this infrastructure be managed? What should the planning, financing and regulation structure be? The following Section 1.1 provides further background on the purpose of this thesis. Then, Section 1.2 specifies the more precise questions that were the basis for this thesis and explains the methodology used to address them. In Section 1.3, the actual research case that is going to be used as an example will be shown and finally this opening chapter is concluded in Section 1.5.
1.1. THESIS PURPOSE
The aim of this thesis is to understand the process of changes in the Argentine energy sector due to the shale energy developments, and its particular interaction with the transportation and logistics systems. With the analysis of what happened in the US shale boom and identifying the differences and similarities with the Argentine case, this thesis will seek to define the overall context and provide a new methodology for analyzing how infrastructure decisions should be made in this context. For an example of that methodology, a research case related to the transportation infrastructure in Argentina will be used.
The location of VM, away from large urban centers, coupled with the high requirements of inputs that are needed to be transported into the area (one of the main characteristics of the extraction technique) makes the logistics and transport components key elements of the analysis of the shale energy industry. At the same time and because of the historic economic development of the country, the oil industry and the region, the logistics system and transport infrastructure in this region was not designed for the level of demand that the exploitation of VM requires. Immediate problems like lack of network connectivity and high saturation of the existing infrastructure are problems that should be solved in the short term in order to achieve an efficient operation. In fact a report by the Belfer Center of the Harvard Kennedy School (Mares 2013) states: "Investment in logistics and infrastructure is necessary to support it [VM exploitation], the lack of which has made the cost of a shale well in Argentina more than double that in the United States ($7-8 million compared to $3 million)."
The situation is a major challenge for the transportation and logistics industry, which will affect not only the oil industry but will generate changes in regional economies. Therefore it is necessary to assess synergies and evaluate transportation alternatives to make strategic decisions at early stages
of the project. However, this investment planning requires a different perspective than regular public infrastructure project evaluation, since in this case there is a strong interaction between public and private actors to be considered in the decision. The absence of a global view in the planning process may generate errors that could affect the development of Argentina in the coming decades.
It is noteworthy that the use of technologies needed to develop such non-conventional oil and gas became widespread in recent years, so the knowledge regarding methodologies of infrastructure planning, has not been thoroughly investigated worldwide; this is what makes this research interesting and innovative. To advance the detailed analysis of the problem, in Section 1.2 three clusters of interrelated questions are introduced.
1.2. THESIS QUESTIONS AND APPROACHES
In the process of answering the general question stated-how should the logistics and transportation infrastructure related to shale developments, in particular VM, be planned and funded-, three more detailed question clusters are posed. This set of three question clusters created from the point of view of a decision-maker, are ultimately the input to conceptualize the requirements of the methodology developed in Chapter 4. This methodology will be based on the Benefit-Cost Analysis (BCA) technique applied to a specific complex-decision scenario where there are private actors with strong decision-power and a complex public and institutional framework.
1.2.1. QUESTION CLUSTER 1: TRANSPOR TA TION AND LOGISTICS REQUIREMENTS
The infrastructure investments are long-term and expensive decisions for society. What is driving the demand for new infrastructure capacity for shale energy developments in Argentina? What are the bundles of strategic alternatives for providing this transportation
capacity? Which institutional actors have influence over the implementation of these alternatives?
This cluster of questions is answered at two levels: the first focusing on the shale energy development system and the second focusing on the logistics and transportation system. The first level analyzes shale developments identifying general and local characteristics, evaluating the development over time and particularly identifying the key drivers of transportation demand. The second level focuses on identifying current and future transportation alternatives. This response seeks to identify the general context of the shale industry and the transportation system in Argentina, in order to introduce in Question 2 the analysis of the interrelationships among actors.
1.2.2. QUESTION CLUSTER 2: ANALYSIS OF BUNDLES OFSTRATEGICALTERNA TIVES INA CLIOS SYSTEM
How can we analyze these bundles of strategic alternatives taking into account the particular interests of each of the actors? How should we design the infrastructure? How can we generate useful information for the discussions on infrastructure finance that allows the actors to work toward an optimal decision for the country? How does uncertainty affect the strategies of the actors?
The response to this question will look at the interaction between the actors involved. To respond to Questions 1 and 2, concepts from the CLIOS Process will be used to organize the work. The CLIOS Process is an approach to studying complex, large-scale, interconnected, open, sociotechnical (CLIOS) Systems. CLIOS systems are a class of complex sociotechnical systems with "nested complexity" (Sussman 2014). Besides being a tool for understanding the system, the CLIOS Process can be used for "intervening in" and changing the system to improve outcomes or performance. These alternatives are intended to enhance the performance of the CLIOS System are called "bundles of strategic alternatives" (Sussman 2014).
The CLIOS Process is organized into three stages:
1. Representation of the CLIOS System structure and behavior,
2. Design, Evaluation and Selection of CLIOS System bundles of strategic alternatives, and 3. Implementation of the selected bundles of strategic alternatives.
This thesis will use the first stage that is descriptive as an "organizing mechanism for mapping out the system's underlying structure and behavior-a precursor to identifying strategic alternatives for improving the system's performance" (Sussman 2014). This representation will be used as the definitions of the systems and the interaction between the actors that will be the background for the development of the methodology of analysis to answer the Question cluster 3.
1.2.3. QUESTION CLUSTER 3: PUBLICAND PRIVATE PARTICIPATION
If the private sector should lead the role of financing infrastructure development, what considerations of planning and regulation should be addressed? What should the framework be to ensure fair competition for the use of the infrastructure to guarantee the pursuit of
efficiency for all current or future stakeholders? What should the design of the institutional architecture be?
The response to this question will be the product of the methodology described in Chapter 4. The objective will be to develop a framework that contains the interaction between the different systems and the institutional sphere that look into the decision on how the logistics and transportation infrastructure required for the shale energy development in Argentina should be planned, built and operated. In particular, this methodology will consider different perspectives, starting from a global analysis of economic efficiency to move towards a financial assessment from the point of view of private investment. This dual vision seeks to identify incentives and linkages between all the actors, to finally define the range of possible alternatives.
1.3. SIMULTANEOUS ECONOMIC-FINANCIAL ANALYSIS
The methodology that will be presented in Chapter 4 is the Simultaneous Economic-Financial Analysis Model (SEFAM), which allows us to analyze the system from different perspectives, including those of each major actor. This methodology leads to the definition and generation of the useful information required in a prospective negotiation between the actors, in the attempt to reach the optimal solution for the society.
As will be described in the Section 4.5, the existing literature is mainly focused on two perspectives: on one side, some authors analyze the methods of Benefit-Cost Analysis (Kurowski et al. 2011 and Zerbe 1994) and on the other are those who study the Public Private Partnerships or other instruments of private sector participation in infrastructure investments (Delmon 2009, Merna et al. 2002 and Grigg 2010). In this thesis, ideas and quotes from these authors are presented to illustrate the thinking on these topics. The author believes that the value added by SEFAM is the consolidation in one tool of known methods, which provides the decision maker with useful information for a negotiation process that may lead to the social optimum, helping to understand and solve a concrete problem from a dual perspective.
The use of SEFAM allows us to generate new alternatives that would not exist if the government and the private sector did both analyses individually. As will be seen in the application of SEFAM to the research case, the creation of possible new solutions that align the incentives of the private sector toward the socially optimum alternative is a value added by this model. Since the solution will require a negotiation process, the structure of SEFAM as a model that makes this simultaneous
analysis together with a fiscal assessment, is a novel idea especially for the use of decision makers in the private sector dealing with expensive infrastructure decisions.
1.4.
RESEARCH CASE: CORRIDOR TO SUPPLY VACA MUERTA(VM)
Looking to illustrate the methodology developed in Chapter 4 (SEFAM), within the scope of this thesis, the author chose to use as a research case the corridor between Bahia Blanca and Neuqu6n that includes a railway line and a main national highway as a proof of concept.
As will be explained in Chapter 2, VM formation is included in the so-called "Neuqu6n Basin" in Patagonia. Its depth, its geological characteristics and the results of the first stages of exploration and production are very promising, positioning this formation as one of the best current shale plays
outside the US (McGowen 2013).
The main infrastructure that serves this area is the national and provincial road system and the railway branch Bahia Blanca-Zapala under the private concession of Ferrosur Roca. This railway has an extensive network including important port connections in Buenos Aires and Bahia Blanca.
Figure 1-4 Research case corriaor (Aaaptea irom txoogie tarmn)
This corridor was chosen as research case because it exemplifies the competition between modes.
In particular the railway infrastructure segment is important because:
- It is a key infrastructure in terms of its potential transportation capacity
- For its development, a coordination of different actors is required: national government, rail operator, regulator, operators of oil fields, unions, etc.
- To achieve an efficient operation, this infrastructure requires a high level of capital investment, requiring a considerable planning effort.
The application of this research case is an academic exercise to demonstrate the use of SEFAM, which can then be applied in other infrastructure planning cases or even could serve as a conceptual framework for analyzing a similar problem in the development of other natural resources (e.g. mining). This implementation was developed with public information from secondary sources, so the results are suitable for the first overview analysis. We will call this corridor the "East-West VM supply corridor", for further reference.
Section 1.5 will summarize the structure of the following chapters of this thesis.
1.5. CLOSING
This chapter started with the discussion about the increasing global energy consumption and the perspectives of the shale energy as a potential driver for the development of Argentina. Those general ideas were then related to the need for large investments in infrastructure in a context of public-private decisions that will be detailed in Chapter 4. Finally we introduced the motivations for writing this thesis, developing the associated methodology and using the VM supply corridor research case to exemplify its application. This methodology will look to this problem from different perspectives, seeking to define how to implement the socially optimum transportation alternative.
In a logical order, the following Chapter 2 will focus on the definition of the systems involved and their characteristics. Chapter 3 will analyze the interactions between the different actors through the implementation of Stage 1 of the CLIOS Process and Chapter 4 use the outcome from the first two chapters to present SEFAM and its application in the research case of VM. Finally Chapter 5 summarizes the main conclusions and recommendations and enumerates possible further studies.
Chapter 2.
UNDERSTANDING SHALE ENERGY, ITS
INFRASTRUCTURE REQUIREMENTS AND CHARACTERISTICS
This chapter describes the characteristics of the development of shale energy in general, to understand their structure and especially to give a theoretical framework to determine why the infrastructure capacity is crucial. Within this chapter a benchmark of the US shale boom and the Vaca Muerta case will be developed, looking at similarities and differences, given that Argentina is already the largest producer of shale energy outside the United States and Canada (YPF Press 2015).
2.1.
SHALE ENERGY2.1,1. INTRODUCTION TO SHALE ENERGY
For decades geologists have known that inside the "source rock" vast amounts of hydrocarbons were trapped. Because of the very low permeability and porosity of the rock, these hydrocarbons were unable to flow to areas of lower pressure (reservoirs) in a process called "migration" (Figure 2-1) and consequently could not be extracted in the conventional way (Figure 2-2).
This light crude oil with low sulfur content and gas found in low-permeability shale and tight formations are called shale oil/gas and tight oil/gas. Even shale oil reservoirs are rich with clay and fissile, and tight oil formations are made of siltstone or mudstone without a lot of clay. However, the resemblance on data logs between the two made the term "shale" the common name for both types of oil. However, this kind of oil should not be confused with "oil shale", a product with different chemical composition that requires different extraction and refining techniques (Maugeri 2013).
The shale resources are included in the group of "unconventional" since they are produced or extracted using techniques other than the conventional method. The attention to these resources has increased in the last decades driven by the known scarcity of conventional oil reserves. Inside the "unconventional" group, there are others kinds of crude oil such as the oil sands (bitumen), extra-heavy oils and oil shale (kerogen) (Belouga 2012).
In particular, the tar sands (or oil sands) in Canada are another example of massive development of unconventional oil, but it is important to mention that the physical-chemical characteristics of the oil sands and the shale oil are very different, as are their extracting technologies. In the case of oil sands in Canada, the operation is very similar to a mining process and requires a lot of energy to extract, process and transport the oil. In the case of shale oil, the product is lighter with a better quality, and it is extracted through perforations as is the conventional oil, even if the processes involved different technologies that require more input materials and consequently more transport services.
In Figure 2-2, a simplification of the difference between conventional and unconventional reservoir types is shown.
Conventional and Unconventional Reservoir Types
14
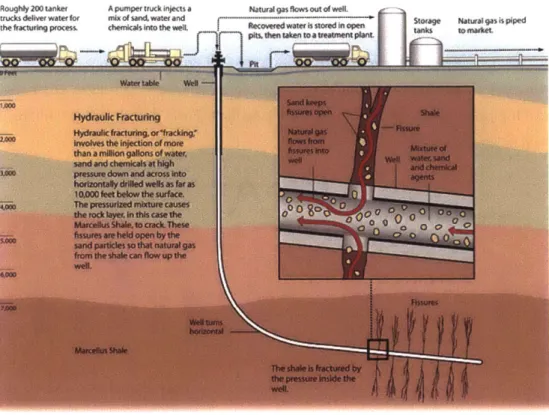
Two technologies are crucial for the exploitation of these resources: hydraulic fracturing combined with horizontal drilling.
Hydraulic fracturing is a technique that was first introduced into commercial practice in 1947 for well stimulations on conventional reservoirs in which the rock is fractured by a hydraulically pressurized mix of water, sand and chemicals. The water fractures the rock through high-pressure. The sand (or frac-sand) is used as a propping agent in order to assure that the fissure created remains open after the external hydraulic pressure disappears. This frac-sand could be in some cases replaced by man-made ceramic materials. Finally chemicals have different functions during the process, as we will see in the following chapters, and their composition is a topic of heated discussion, especially in some states of the US who are concerned about groundwater contamination. So, it is important to make clear that hydraulic fracturing did not begin in the twenty-first century with the US shale boom, but comes from developments from over 50 years and diverse implementations.
Horizontal drilling is a technology that has been widely practiced since the 1980s to extract conventional oil, allowing a directional drilling in different angles, even horizontal. This directional drilling allows the producer to:
- Increase the length of the exposure section through the reservoir, allowing more surface to be in contact with the reservoir rock
- Drill into parts of the reservoir where vertical drilling would be impossible, as for example under a occupied surface (i.e. under Dallas/Fort Worth Airport shown in Figure 2-3) or a difficult-to-drill covering rock
- Combine different wellheads into one pad, reducing the surface disturbance - Reduce the pressure of an uncontrolled well in an emergency action.
In conclusion, neither the horizontal drilling nor hydraulic fracturing are new technologies, but their application in recent years were at an unprecedented pace and scale, becoming key drivers for the development of shale resources in an economically viable manner. This combination has allowed oil producers to economically extract oil from these sources in the US, raising the production from almost no production up to 1.5 million barrels per day of shale oil in 2012 (Maugeri 2013).
s Oil well stimulation is the general term describing a variety of operations performed on a well to improve its
Figure 2-3 Horizontal drilling allows the exploitation of the Barnett reservoir below the Dallas/Fort Worth (DFW) Airport (Star Telegram 2015)
As was introduced in the first chapter, the author considers that it is important to highlight the controversy that exists in terms of the use of these two technologies, specially hydraulic fracturing ("fracking"). Clearly, this is a complex debate with both technical objective and subjective elements, like any discussion of this type. As was previously mentioned, since this study is focused in infrastructure developments and not in analyzing the environmental effects of the technologies involved in the extraction, the author proposed in Chapter 1 to advance a hypothesis in the context of this thesis: to assume that, knowing that environmental risks exist, there exists good construction and operating practices implemented in the US and abroad that allow the safe exploitation of these types of resources. This does not mean that always this good practices are applied or even that it should not be extremely necessary to have a set of clear, precise and transparent regulations, but this hypothesis just states that these good practices are materially possible and can mitigate the environmental risks associated with the shale exploitations. This hypothesis is based on the findings of two reports: "The Future of Natural Gas: An Interdisciplinary MIT Study" from the MIT Energy Initiative (MIT 2011) and the "Second Ninety Day Report" from the Shale Gas Production Subcommittee of the Secretary of Energy Advisory Board of November 2011 (US DoE 2011), previously quoted in Chapter 1.
Resuming the explanation of the two essential technologies (hydraulic fracturing and horizontal drilling), with the objective of providing the reader a scientific back-ground of why these two methods combined were the key for the development of the shale boom in the US, the author will use the example provided by Dr. Robert Kleinberg in a presentation organized in November 2014 by the MIT Energy Club (Kleinberg 2014):
The objective of the exploitation is to get the oil and gasflowing into the pipes of the wells. The flow offluids in an oil wellfollows Darcy's Law:
k Q = A -VP
y
where
Q
=fluid flow [cm3/s]A = contact area [cm2]
VP= pressure gradient [atm/cm]
p= viscosity [cP] pressure gradient [atm/cm]. In natural gas, P=0.01 cp (100 C)
and k= permeability tofluidflow [D]
Since the permeability (k) of a conventional good gas reservoir is about 10-3D and the
permeability of a shale gasformation is about 10VD, the only possibility to keep the same flow
Q
with the same viscosity and pressure gradient is by expanding the reservoir contact area (A)by afactor oj 104
So, if the conventional reservoir is being exploited by a vertical 20 cm borehole in a 30 m thick
reservoir providing a reservoir contact area of20 i 2, the analogous required reservoir contact
area for the shale case would be: 200,000 M2 in order to produce the sameflow (Q). This huge
increment in the contact area is achieved by a dual action: increasing the pore dimension (fracturing of the rock) and increasing the length of the perforation in contact with the reservoir (the horizontal drilling), as shown in Figure 2-4.
A. pumper tuck Inje"t a Naturi al 9 MWS 4 of owevt mix of Sand water and
ctwmwks in~to the wet
J-1r2
Roered WSW~ Is stored in openptheUn takens to a Vtetv labnt
Graphi by #J Canberg
Figure 2-4 Horizontal drilling + hydraulic fracturing schematic well (Council of Foreign Relations 2015)
During this work, the compilation of shale oil and shale gas will be referred to as shale recourses. Both elements have similar geological formation and extraction techniques. However they have significant differences in economic terms since both products have very different markets, because of the impossibility of massively storing and transporting the natural gas. This "natural" restriction creates very different price behavior and socio-economic impacts between the two products: natural gas has a more local/regional impact than crude oil. The differences between products are addressed in the following chapters; for now the author will concentrate on the description of the technical aspects of both resources.
As was introduced before, since the early 2000s, the combination of horizontal drilling and hydraulic fracturing have allowed oil companies to put into production formations in different parts of the United States with different levels of production (Figure 2-5). The most important are:
e Marcellus shale (Pennsylvania, New York, and Ohio) e Barnett, Permian Basin, and Eagle Ford shales (Texas) - Haynesville (Louisiana)
- Bakken (North Dakota)
In particular Bakken has remade the energy map in the United States incorporating over one million barrels per day of crude oil production (Council of Foreign Relations 2015), allowing the country to reach more than 9 million barrels per day in production of oil in 2014 (EIA 2015), becoming a top global producer and close to reaching the historic record of 10.04 million barrels a
day reached in November 1970.
Oil production Natural gas production
thcusad bafisday mkon cubaw feeday
zFebruary-2014 a February-2015 vFebruary-2014 aFebnary2015
18,000 2400 15000 2.000 Q2 W) 9.000 1,200 3,000 t
U S Energy Informnation Admistrat f Diang ProductwIy Report 2
Figure 2-5 Oil and Gas production per shale formation in the US (EIA Drilling Productivity Report Feb 2015)
US fight oil base case by play Eagle Ford & Bakken sweet spots
5,0
4,5 Play tight oil
4,0 groupings mOther Established 1.0 W 24 non-core
tight oil producing
S3,5 countes
3,0 Two discrat sprin ofap 08 cor counties
2,5 plays aNiobrara P-2009 e 0.5 2.0 mEagle Ford 1,5 1,0 aakken 0,5 0,0 0.0 R R a 9 99 9 9 9 a C
SoinvW Wood mckenzie Gbo"aI Oi Suppy Tol
Histor
2012
Projections
25
20
Net petroleum and o
biofuel imports ,32%
15
40%
12%
10
sf
M16%
Tight oil production
r7%
5
12%
23%o a Crude oil production 2r%
(excluding tight oil
tean
01
1970
1980
1990
2000
2010
2020
2030 2040
Figure 2-7 US petroleum and other liquids fuel supply by source 1970-2040 in million barrels per day (EIA
2014b)
Apart from the
low
permeability and porosity of the rocks, the other key technical characteristic of the shale wells is the rapid decrease in production rates. According to research developed byMaugeri (2013), from the initial production achieved during the first 30 days, production drops
generally to 40-50% by the end
of
the first year (compared to 80% for conventionaloil)
and furtherto 30-40% by the end of the second year (conventional: 70%), according to results in the main 3
plays of the US (Bakken, Eagle Ford and Permian). Finally after 5-6 years, the production rate is
approximately 20% of the initial production (conventional: 30%). A graphic showing the difference
in production curves between conventional and tight oil is included in the Appendix of this thesis. The particular values of these rates depends on the geology of the formation and the technologies utilized by the operators, and is evolving over time (Figure 2-8), even if the pattern is maintained as a distinct intrinsic characteristic of this type of exploitation.
12,000
Now NtOwid I 2N7 2M W 2010 IOU MI2
b.n
Figure 2-8 Bakken-Three Forks: per well production and decline curves overt ime, 2007-2012 (Maugeri 2013) This rapid decrease in production rates is a technical property that creates what Maugeri calls the need for a constant "drilling intensity" to maintain the production rate over time. This requirement of constant investment, joined with the relatively high overall costs, makes the unconventional exploitation vulnerable to both price drops and environmental opposition in new and populated areas (Maugeri 2013). This will be subject of analysis in the following chapters, but the price fall that began in the second half of 2014, when prices dropped more than 50% in less than six months, provides the scenario of analysis of this idea. According to the Council of Foreign Relations (2015): "By January 2015, companies were telegraphing their intentions to reduce shale operations, with ConocoPhillips, the largest U.S. exploration and production company, planning to cut capital spending by 20 percent by deferring shale projects. And many shale producing companies have also incurred major up-front debt-the sector is more than $160 billion in debt-which could constrain the ability of smaller companies in particular to continue financing exploration and production in the event of sustained low prices." Surely this period of volatility and falling prices led to changes in expectations, which a priori seem difficult to assess. The particular impact of this phenomenon in the Argentine case will be developed in Section 2.1.3.
As will be discussed in the followings chapters, the most important socio-economical impact of the unconventional natural gas activity in the US has been lowered energy costs, as well as prices, for a wide range of goods and services, especially for manufacturers in energy-intensive industries like energy-related chemicals, petroleum refining, aluminum, glass, cement, and the food industry. These industries "are expected to invest and expand their US operations in response to declining domestic prices for their energy inputs" (IHS Report 2013). According to the same report, the lower