HAL Id: hal-00129330
https://hal.archives-ouvertes.fr/hal-00129330
Submitted on 8 Feb 2007HAL is a multi-disciplinary open access archive for the deposit and dissemination of sci-entific research documents, whether they are pub-lished or not. The documents may come from teaching and research institutions in France or abroad, or from public or private research centers.
L’archive ouverte pluridisciplinaire HAL, est destinée au dépôt et à la diffusion de documents scientifiques de niveau recherche, publiés ou non, émanant des établissements d’enseignement et de recherche français ou étrangers, des laboratoires publics ou privés.
in fasted and refed rats.
C. Habold, C. Foltzer-Jourdainne, Y. Le Maho, J.-H. Lignot
To cite this version:
C. Habold, C. Foltzer-Jourdainne, Y. Le Maho, J.-H. Lignot. Intestinal apoptotic changes linked to metabolic status in fasted and refed rats.. Pflügers Archiv European Journal of Physiology, Springer Verlag, 2006, 451 (6), pp.749-759. �10.1007/s00424-005-1506-3�. �hal-00129330�
Intestinal apoptotic changes linked to metabolic status in fasted and refed rats Caroline HaboldP 1 P , Charlotte Foltzer-JourdainneP 2 P , Yvon Le MahoP 1 P , Jean-Hervé LignotP 1 P P 1 P
CNRS, Centre d’Ecologie et Physiologie Energétiques,
23 rue Becquerel, STRASBOURG cedex 2, F-67087, France ;
P
2
P
INSERM, U381, 3 avenue Molière, Strasbourg, F-67200, France.
P
P
Correspondence to: Caroline Habold, Centre d'Ecologie et Physiologie Energétiques C.N.R.S.
23 rue Becquerel. 67087 STRASBOURG, France.
E-mail address: caroline.habold@c-strasbourg.fr
Abbreviations: Cdx2: Caudal-related homeodomain protein, RT-PCR: Reverse Transcription – Polymerase Chain Reaction, TGFβ1: Transforming Growth Factor β1, TNFα: Tumor Necrosis Factor α.
Abstract
Intestinal apoptosis and expression of apoptosis inducers – the cytokines TNFα, TGFβ1 – and the intestinal transcription factor Cdx2, were studied according to two different metabolic and
hormonal phases which characterize long-term fasting: the long period of protein sparing
during which energy expenditure is derived from lipid oxidation (phase II), and the later phase
characterized by a rise in body protein utilization and plasma corticosterone (phase III).
Apoptosis was further studied in 2, 6 and 24h refed rats. Morphological apoptotic events were
observed by environmental and conventional scanning electron microscopy and TUNEL test
was used to characterize the final stages of apoptotic death. The gene and protein expressions of TNFα, TGFβ1, and Cdx2 were measured. Apoptotic events and TNFα, TGFβ1, and Cdx2 gene and protein expressions did not vary significantly during phase II compared to
normally-fed animals. However, phase III fasting induced a delay in intestinal epithelial apoptosis, along with a 92%, 58% and 25% decrease in TNFα, TGFβ1 and Cdx2 mRNAs, respectively. The amounts of TNFα, TGFβ1 and Cdx2 proteins decreased by 70%, 36% and 25%, respectively. Apoptosis was restored rapidly after 2h refeeding following phase III, accompanied by a significant increase in TNFα, TGFβ1 and Cdx2 mRNA and protein levels, compared to the phase III fasting values. The concomitant decreases in cytokines and Cdx2
and in apoptotic cells during phase III suggest the preservation of enterocytes during this
critical fasting period in order to optimize nutrient absorption as soon as food is available and
thus, to rapidly restore body mass.
Introduction
Three distinct metabolic phases have been described during a fast (7, 21, 30, 32). During the
first phase (phase I), glycogen stores are completely exhausted and fat stores are progressively
used. This phase lasts only a few hours in rats. The second phase (phase II) corresponds to a
phase of economy with the mobilization of fat stores for energy expenditure whereas body
proteins are efficiently spared. The third phase (phase III) is characterized by an increasing
protein catabolism caused by a rise in plasma corticosterone levels. During this later phase,
there is a clear change in behavior which promotes food foraging, therefore anticipating a
lethal depletion of energy stores (30). In rats, fasting during either phase II or phase III
induces a significant decrease in the size of intestinal villi and thus, in the small intestinal
mass (13). Also, during the phase of protein sparing (phase II), cell proliferation in crypts and
cell migration along the crypt-villus axis decrease, whereas apoptosis at the tip of the villi is
maintained (22). In phase III however, when the rat has reached a critical threshold in body
reserves utilization, intestinal cell proliferation and migration increase significantly compared
to phase II fasted and normally-fed rats. In parallel, we observed a delay in apoptotic events at
the tip of the villi (22). The increase in cell proliferation and the preservation of absorptive
cells are concomitant with a rise in locomotor activity reflecting the search for food (30) and
may prepare the mucosa to nutrient absorption as soon as food is available. The aim of the
current work is to further evaluate the intestinal apoptotic changes linked to the metabolic
state of fasted rats.
During the normal course of the development of the animal, apoptosis is activated as a response to specific endogenous factors such as TNFα and TGFβ1 (15, 36); the caudal-related homeodomain protein Cdx2 has also been shown to be critical in these processes (3).
changing levels of specific hormones, and fasting. A short period of starvation (less than 3
days) has been shown to increase apoptosis in the small intestine mucosa (19, 27, 28).
However, other authors (34) have related a decrease in apoptosis following a 3-day starvation
period. The effects of longer periods of fasting and of refeeding on apoptotic events in the
small intestine remain almost unknown and intestinal apoptosis has never been studied by
other authors in relation to whole body metabolism.
In this study, we evaluate the effects of phase II and phase III fasting and of refeeding on
apoptotic events in the intestinal epithelium. Apoptosis was studied at the level of cell
morphology by Scanning Electron Microscopy (SEM), and cell biology using the TUNEL test. The concomitant variations of proapoptotic cytokines (TNFα, TGFβ1) and of the intestine specific transcription factor Cdx2 were analyzed by RT-PCR in order to determine gene expressions, and by western blot in order to quantify TNFα, TGFβ1 and Cdx2 protein levels. Finally, TGFβ1 and Cdx2 protein distribution along the crypt-villus axis was investigated by immunohistochemical detection.
Materials and methods
Animals
Male Wistar rats weighing 350g were obtained from Iffa-Credo (Lyon, France). The animals
were housed individually in leucite cages with a wire mesh floor to minimize coprophagia,
and were maintained at 23°C with a 12-hour light period. They had free access to the control
diet (A03 pellets from UAR, Epinay-sur-Orge, France) consisting of 23% (by mass) protein,
51.1% carbohydrates, 4.3% fat, 4% cellulose, 5.6% minerals, and 12% water. The rats had
free access to water throughout the experiments. They were weighed every day between 9.00
and 10.00 a.m. Our experimental protocol followed the Centre National de la Recherche
Scientifique (CNRS) guide for care and use of laboratory animals.
Experimental procedures
After a one week acclimatization, normally-fed rats served as control animals (Ctrl, n=15),
whereas the other rats were food-deprived. The fasting phases were determined by calculating
the specific daily rate of body mass loss dM/Mdt (g/kg/day) for each animal (dM represents
the loss of body mass during dt=tB1B-tB0B and M is the rat body mass at tB0B). This calculation
permitted a daily monitoring of the physiological status for each animal through fasting. With
this monitoring, all the animals survived the prolonged starvation procedure and could be
successfully refed. The first fasting phase (phase I) lasted only a few hours and was
characterized by a rapid decrease in dM/Mdt. The specific daily body mass loss then reached
a steady rate (approximately 55g/kg/day) representing phase II and finally, strongly increased
which was characteristic of phase III.
The phase II fasting period lasting between one and six days (for 350g rats), a first group of
during 2h (P2r2, n=5), 6h (P2r6, n=5), or 24h (P2r24, n=5) following phase II, and then
killed. Four additional groups continued fasting until the second day of phase III, reaching on
average eight days of fasting. One group was killed in phase III without refeeding (P3r0,
n=15), whereas the three others were killed after refeeding for 2h (P3r2, n=5), 6h (P3r6, n=5),
or 24h (P3r24, n=5) following phase III.
The animals were killed between 9.00 and 10.00 a.m. The jejunum was removed, weighed,
and cut into segments. These segments were then treated separately depending on the analysis
considered (CSEM, ESEM, immunohistochemistry, RT-PCR, western blotting).
Plasma parameters
Blood samples were collected immediately after sacrifice to measure plasma concentrations of
urea and corticosterone in all experimental groups. To assess the metabolic state for each
animal, plasma urea was determined with a Urea Nitrogen Kit (Sigma Diagnostics, St Louis,
USA), according to the manufacture's guidelines. The plasma concentration of corticosterone
was determined with an Enzyme Immunoassay Kit (Assay Designs Inc., Ann Arbor, USA).
Environmental Scanning Electron Microscopy
Samples of jejunal mucosa were placed in 1% glutaraldehyde and buffered saline for 30s to
block mucus secretion, and then viewed with a Philips XL-30 ESEM. The pressure in the
sample chamber was maintained at 5 Torr and the temperature at 4°C, in order to hold a
relative humidity rate of 80% at the sample surface.
Conventional Scanning Electron Microscopy
Jejunal mucosal samples were fixed for 2h at 4°C in 5% glutaraldehyde in 0.05M cacodylate
dried with hexamethyldisilazane. After being mounted on stubs, samples were coated with
gold and examined with a Philips XL-30 ESEM.
TUNEL assay procedure
The TUNEL assay (in situ Cell Death Detection Kit, fluorescein) was performed according to
the manufacturer's specifications (Roche, USA). Each experiment set up by TUNEL reaction
mixture without terminal transferase served as negative control. Samples pre-treated with
DNAse (2mg/mL) served as positive controls. Sections were examined with a fluorescent
microscope (Zeiss Axioplan) equipped with the appropriate filter set (450-590nm bandpass
excitation filter). TUNEL-positive cells with fully condensed nuclei were counted in a
minimum of 30 villus sections per animal and in 5 animals per group and expressed as a
percentage of the total epithelial cells.
RT-PCR analysis
Total RNA from jejunal mucosa was extracted by the method of Chomczynski and Sacchi (8).
cDNA was synthesized from 2µg total RNA in 25µL reaction buffer (Finnzymes OY,
Finland) containing 1µL of avian myeloblastosis virus reverse transcriptase (Finnzymes OY,
Finland), oligo(dT)B17B primer (50pM, Eurogentec, Belgium) and 0.2mM of deoxynucleotide
triphosphate (Promega, France), (60min at 42°C). cDNA was then amplified by Polymerase
Chain Reaction (PCR) using specific primers (Table I). The PCR reactions were carried out in
10µL Red’Y’StarMix (Eurogentec, Belgium) diluted to a final volume of 20µL, 50pM of each
primer and 1µL of the cDNA mixture. cDNAs were amplified for a determined number of
cycles (Table I) as follows: hot starting for 10min at 95°C, denaturation for 45s at 94°C,
annealing at 50°C for 45s, and elongation at 72°C for 45s. PCR products were resolved on a Table I
3% agarose gel and visualized by ethidium bromide staining. The staining intensity was
evaluated using the Molecular Analyst software (Bio-Rad Laboratories, USA). Results were
expressed as relative densitometric units, normalized to the values of a phosphoribosomal
protein mRNA used as internal control.
Western blotting and immunohistochemistry
Western blotting and immunohistochemistry were conducted as described previously (23). The primary antibodies used were polyclonal rabbit anti-rat TGFβ1 [anti-LC-(1-30)] (generously provided by Dr. K. C. Flanders), monoclonal mouse anti-human Cdx2 (BioGenex, San Ramon, Ca, USA) and polyclonal rabbit anti-human TNFα (Genzyme Diagnostics, Cambridge, USA).
Cdx2 antibody could be detected on paraffin sections after incubation with Alexa B488B -conjugated goat anti-mouse IgG (Molecular Probes), whereas TGFβ1 immunolocalization was performed using the standard extravidin-biotin-peroxidase complex technique and
diamino-benzidine coloration.
Statistical analysis
Data are presented as mean values +/- SEM. Statistical comparisons of experimental data
were performed by one-way analysis of variance (ANOVA) and Tukey post-hoc test by using
Results
Evolution of the metabolic and hormonal status
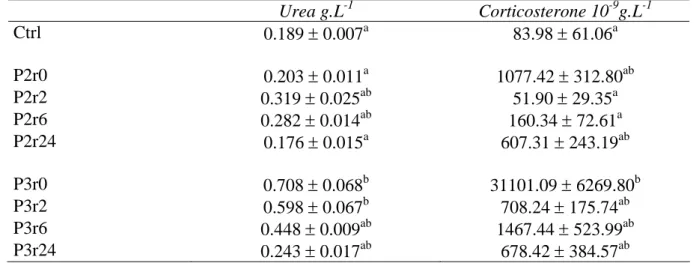
Plasma urea concentration (Table II) did not vary between control, phase II fasted rats and
refed rats following phase II. A phase III fast induced a 3.7-fold significant increase in urea
concentration. Uremia then decreased in rats after 6h refeeding following phase III.
Plasma corticosterone concentration (Table II) showed a 13-fold increase in P2r0 fasted
animals compared to controls, but it was not significant. After refeeding following a phase II
fasting period, plasma corticosterone concentration was lower compared to control values. In
phase III fasted rats, plasma corticosterone concentration exhibited a 370-fold significant
increase compared to controls, and a 29-fold increase compared to P2r0 fasted rats. Refeeding
following phase III induced a rapid decrease in plasma corticosterone.
Apoptotic events
Environmental Scanning Electron Microscopy makes it possible to examine fresh, lightly
fixed biological specimens (neither dehydrated, nor gold coated) without artifacts linked to
sample manipulation and treatment. A morphological study of apoptotic events at the tip of
the villi was therefore possible for our 9 experimental groups (figure 1, a to i). These
observations were made along the jejunum for 5 animals per group. Apoptotic zones were
observed at the villi tips in control (figure 1a) and phase II fasted rats (figure 1b), but very few
apoptotic events could be seen in phase III fasted rats (figure 1c) and in rats refed 2 and 6h
following phase II (figure 1, d and e). In animals refed 24h following phase II (figure 1f), and
in those refed following phase III (figure 1, g to i), the intestinal villi tips looked like those in
controls. Observations made at higher magnifications with Conventional Scanning Electron
Microscopy (figure 1, j to l) showed apoptotic cells being extruded from the epithelium and Table II
losing their microvilli in control (figure 1j) and in phase II fasted rats (figure 1k) but not in
phase III fasted rats (figure 1l).
There were no differences in the number of TUNEL-positive cells at the tips of the villi
between control and phase II fasted rats (figure 2, a, b and j). Only a few apoptotic cells could
be seen in animals refed 2h and 6h after a phase II fast (figure 2, d, e and j). Numerous
TUNEL-positive cells could be seen again after 24h refeeding following phase II (figure 2f
and j). In phase III, almost no apoptotic cells could be detected at the tip of intestinal villi
(figure 2c and j). However, after refeeding following phase III, the apoptotic index was the
same as in control animals (figure 2, g to j).
Changes in TNFα and TGFβ1 gene and protein expressions
TNFα and TGFβ1 were expressed in the small intestine mucosa (figures 3 and 4). However, TNFα was only faintly expressed, as indicated by the high number of PCR cycles needed to detect its mRNA (Table I).
TNFα transcripts and protein level (figure 3A and B) did not vary during a phase II fast compared to control animals. However, TNFα mRNA levels were very low in animals refed 2h and 6h after phase II compared to controls and phase II fasted rats, but no significant difference in the amounts of TNFα protein could be detected. A phase III fast strongly reduced TNFα gene expression and protein level. After 2h refeeding following phase III, the amount of TNFα mRNA exhibited a 7.5-fold increase compared to the control value, and a 94-fold increase compared to the phase III value. It then decreased during 6h and 24h refeeding following phase III, but was still higher than in control rats. TNFα protein level rose to control value after only 2h refeeding following phase III.
TGFβ1 (figure 4A and B) gene expression and protein level did not vary during a phase II fast compared to controls, but a significant increase was observed between animals refed 2h Figure 2
Figure 3
following phase II and control and phase II fasted animals. TGFβ1 gene expression and protein level were then lowered to control values in 6h and 24h refed rats following phase II. During phase III fasting, TGFβ1 mRNA level and protein amount were decreased by 58% and 36%, respectively. After refeeding following phase III, TGFβ1 gene expression and protein level increased and rapidly reached the control values.
TGFβ1 was localized in the cytoplasm of intestinal epithelial cells, and particularly in the apical part of the enterocytes (figure 4C). It was observed in the upper third of the intestinal
villi in control and refed rats, but was weakly expressed in phase III fasted rats.
Modulations of Cdx2 expression and localization
Cdx2 gene expression and protein level (figure 5A and B) did not change during a phase II
fast. However, a significant increase was observed after 2h refeeding following phase II. After
6h refeeding, Cdx2 gene expression and protein level were then lowered to control values. A
phase III fast induced a 25% decrease in Cdx2 mRNA level and protein amount. After
refeeding following phase III, Cdx2 gene expression and protein level increased and rapidly
reached the control values.
Cdx2 was localized in the nuclei of intestinal cells and showed a decreasing gradient along the
crypt-villus axis (figure 5C). A decrease in the expression of Cdx2 protein was observed in
phase III fasted animals compared to controls. The number of strongly labeled nuclei
increased in animals refed 2h following either phase II, mainly in the crypt compartment, or
phase III, all over the crypt to villus axis. Figure 5
Discussion
This study provides evidence that the different apoptotic events described in the small
intestinal epithelium during fasting and refeeding appear concomitantly with the different
metabolic states of prolonged fasting. During phase II fasting, i.e. when the energy
requirements are mostly derived from lipid oxidation, changes in intestinal villus cell
apoptosis are not obvious compared to normally-fed animals. However, a phase III fast
characterized by an increase in protein utilization as a substitute fuel for lipids, induces a
down-regulation of apoptotic events accompanied by significant modifications in the expression of the proapoptotic cytokines TNFα and TGFβ1 and of the intestinal specific transcription factor Cdx2. Whereas refeeding after phase II induces a reduction in apoptosis, refeeding following phase III rapidly restores apoptosis at the villi tips with TNFα, TGFβ1 and Cdx2 expression, also rapidly normalized. In a previous work (22), we also demonstrated
that crypt cell proliferation and migration were decreased during a phase II fast and
extensively increased during phase III. All together, these changes could correspond to the
preparation of a physiologically functional epithelium able to digest and absorb nutrients at
refeeding.
We clearly demonstrate a difference in the occurrence of apoptotic events in the intestinal
mucosa according to the different metabolic phases through fasting. During the phase of lipid
oxidation (phase II), apoptosis was observed at the villus tips with the same frequency as in
normally-fed animals. In phase III however, when the depletion in lipid reserves has reached
about 80% of the initial stores, no apoptotic cells were observed at the tips of the villi. This
may explain the conflicting results obtained in previous studies. Apoptosis appeared to
duration, the rats used in this study and weighing 250-300g were most probably in a phase of
lipid oxidation (phase II). During a longer starvation period (3 days), data obtained in younger
rats (200-250g) with less adiposity showed on the contrary, a down-regulation of DNA
fragmentation (34). These animals may not have been in the same hormonal and metabolic
state as in the Iwakiri’s study (27), and were likely to be in a phase of protein catabolism
(phase III).
From these data, it appeared necessary to further evaluate the effects of phase II and phase III starvation periods on early apoptotic inducers and particularly on TNFα, TGFβ1, and Cdx2, normally present in the gastrointestinal mucosa. TNFα is a cytokine involved in enterocyte apoptosis; mice treated with TNFα show marked villus atrophy (37). High doses of TNFα have been shown to inhibit cell growth, whereas TNFα at low doses promotes epithelial cell proliferation (10, 15, 25, 29, 43). This cytokine is secreted in the intestinal mucosa by
immune competent cells present in the lamina propria, by intraepithelial lymphocytes (16) and also by enterocytes (39). The decrease in TNFα protein during phase III may induce the delay in enterocyte apoptosis at the tip of the villi thus preventing the intestinal mucosa from further degradation during long-term fasting. In addition, the decrease in TNFα may also favor the increase in crypt cell proliferation previously observed in phase III (22). By its effects on both apoptosis and proliferation, TNFα may contribute to the preservation of the mucosal integrity during phase III. The observed increase in TNFα gene and protein levels 2h after refeeding following phase III, may explain the restoration of epithelial apoptosis.
TGFβ1 is a multipotent cytokine playing an important role in regulating intestinal epithelial cell growth and differentiation (35, 38). It is an inhibitor of crypt cell proliferation (1, 31) and
has a proapoptotic role by regulating gene transcription of proteins associated with apoptosis such as Bcl-2 family members (24). In our study, TGFβ1 gene and protein expressions did not vary during the phase II fast. This result is in accordance with the absence of modifications in
apoptotic events during a phase II fast. However, despite the marked drop in villus apoptosis after 2h refeeding following phase II, a rapid increase in TGFβ1 mRNA level and protein expression was observed. The proapoptotic effect of TGFβ1 may be blocked by the increase in plasma insulin level (6) occurring after refeeding following phase II (23). In our previous
study (22), we demonstrated that refeeding after a phase II fast induces a rapid restoration of villus morphology. At this stage, TGFβ1 could stimulate mucosal repair by increasing extracellular matrix protein synthesis (26), and epithelial cell restitution (9, 11). A similar increase in the gene expression of TGFβ1 has also been reported in aberrant crypt foci and in the surrounding mucosa of refed rats (4). The severe decrease in TGFβ1 gene and protein expressions and the faint epithelial labeling observed in phase III fasting animals could partly
explain the disappearance of intestinal apoptotic cells and the increase in crypt cell proliferation (DNA synthesis and mitosis) occurring during this metabolic phase. TGFβ1 mRNA level and protein expression returned to control value after only 2h refeeding
following a phase III and was accompanied by the rapid restoration of apoptotic events.
The homeobox gene Cdx2 is known to reduce intestinal cell proliferation, and to stimulate
cell differentiation and apoptosis (12, 18, 33, 41, 42). To our knowledge, the effects of
short-term and prolonged fasting on Cdx2 in vivo are still scanty. Only one study indicates a
decrease in Cdx expression in 48h fasted chicks (20). Our results show that Cdx2 is located in
the nuclei of crypt cells and of differentiating enterocytes with a decreasing crypt-villus
gradient. The amount of Cdx2 protein decreased during the phase III fast and the crypt-villus
gradient became barely detectable. This suggests that the absence of Cdx2 in epithelial cells
from the villi tips may be involved in the downregulation of apoptosis during phase III and its
faint expression in crypt cells may favor the increase in cell proliferation previously observed
during this fasting phase (22).
increase in plasma corticosterone (this study, 2) concomitant to the decrease in cytokine
expression in the jejunum, the increased cell proliferation rate in intestinal crypts and the
arrest in apoptotic events at the villi tips. In an early study, the role of glucocorticoids on
cytokines secretion was pinpointed as injection of glucocorticoids in vivo induced a decrease in TGFβ1 gene expression (40). Glucocorticoids also, negatively regulate TNFα expression in cultured myofibroblats isolated from the jejunum (40) and suppress TNFα secretion by human lamina propria lymphocytes (14). Finally, it has been shown that adrenalectomy leads
to partial atrophy and disorganization of the villi architecture, associated with a decrease in
crypt cell proliferation, and an increase in apoptotic cells at the tip of the villi (17).
Therefore, in light of the data presented here, one can hypothesize that the levels of energy
depletion reached by fasting animals are involved in the occurrence of apoptosis in intestinal
villi through fasting and after refeeding. The down-regulation of apoptosis during phase III
must preserve differentiated epithelial cells and seems strongly correlated with the decreased expression of the homeoprotein Cdx2 and cytokines TNFα and TGFβ1. These changes may lead to the already observed increased cell proliferation rate inducing mucosal repair during
the phase III fast, before food becomes available (22). Preservation of absorptive cells and
initiation of cell proliferation during phase III fasting is concomitant with a peak of locomotor
activity in these animals induced by a rise in plasma corticosterone and reflecting the search
for food (5, 30). The unaltered absorption capabilities of the intestine could then permit rapid
food assimilation immediately after refeeding and thus, the restoration of the whole body
condition. This could be crucial for surviving prolonged fasting, since animals entering phase
Acknowledgments:
We thank M. Kedinger, C. Domon-Dell and J.N. Freund for helpful discussion, and C. Arbiol
and E. Martin for technical help. We are also grateful for K.C. Flanders for providing us the TGFβ1 antibody.
C.H. was recipient of a Nestlé Nutrition grant.
References
1. Barnard JA, Beauchamp RD, Coffey RJ, Moses HL. Regulation of intestinal epithelial
cell growth by transforming growth factor type beta. Proc Natl Acad Sci 86(5):
1578-82, 1989.
2. Belkhou R, Bechet D, Cherel Y, Galluser M, Ferrara M, le Maho Y. Effect of fasting
and thyroidectomy on cysteine proteinase activities in liver and muscle. Biochim
Biophys Acta 1199(2): 195-201, 1994.
3. Bonhomme C, Duluc I, Martin E, Chawengsaksophak K, Chenard MP, Kedinger M,
Beck F, Freund JN, Domon-Dell C. The Cdx2 homeobox gene has a tumour
suppressor function in the distal colon in addition to a homeotic role during gut
development. Gut 52(10): 1465-71, 2003.
4. Caderni G, Perrelli MG, Cecchini F, Tessitore L. Enhanced growth of colorectal
aberrant crypt foci in fasted/refed rats involves changes in TGFbeta1 and p21CIP
expressions. Carcinogenesis 23(2): 323-7, 2002.
5. Challet E, Le Maho Y, Robin JP, Malan A, Cherel Y. Involvement of corticosterone in
the fasting-induced rise in protein utilization and locomotor activity. Pharmacol
Biochem Behav 50: 405-412, 1995.
6. Chen RH, Su YH, Chuang RL, Chang TY. Suppression of transforming growth
factor-beta-induced apoptosis through a phosphatidylinositol 3-kinase/Akt-dependent
pathway. Oncogene Oct 15;17(15):1959-68, 1998.
7. Cherel Y, Robin JP, Le Maho Y. Physiology and biochemistry of long-term fasting in
8. Chomczynski P, Sacchi N. Single-step method of RNA isolation by acid guanidinium
thiocyanate-phenol-chloroform extraction. Anal Biochem 162(1):156-9, 1987.
9. Ciacci C, Lind SE, Podolsky DK. Transforming growth factor beta regulation of
migration in wounded rat intestinal epithelial monolayers. Gastroenterology 105(1):
93-101, 1993.
10. Diab-Assef M, Reimund JM, Ezenfis J, Duclos B, Kedinger M, Foltzer-Jourdainne C.
The phosphodiesterase inhibitor, pentoxifylline, alters rat intestinal epithelial cell
proliferation via changes in the expression of transforming growth factors. Scand J
Gastroenterol 37(2): 206-14, 2002.
11. Dignass AU, Podolsky DK. Cytokine modulation of intestinal epithelial cell
restitution: central role of transforming growth factor beta. Gastroenterology 105(5):
1323-32, 1993.
12. Domon-Dell C, Wang Q, Kim S, Kedinger M, Evers BM, Freund JN. Stimulation of
the intestinal Cdx2 homeobox gene by butyrate in colon cancer cells. Gut 50(4):
525-9, 2002.
13. Dunel-Erb S, Chevalier C, Laurent P, Bach A, Decrock F, Le Maho Y. Restoration of
the jejunal mucosa in rats refed after prolonged fasting. Comp Biochem Physiol 129A:
933-947, 2001.
14. Elitsur Y, Lichtman SN, Neace C, Dosescu J, Moshier JA. Immunosuppressive effect
of budesonide on human lamina propria lymphocytes. Immunopharmacology 38(3):
279-85, 1998.
15. Fesus L. Biochemical events in naturally occurring forms of cell death. FEBS Lett
328: 1-5, 1993.
16. Fiocchi C. Intestinal inflammation: a complex interplay of immune and nonimmune
17. Foligne B, Aissaoui S, Senegas-Balas F, Cayuela C, Bernard P, Antoine JM, Balas D.
Changes in cell proliferation and differentiation of adult rat small intestine epithelium
after adrenalectomy: kinetic, biochemical, and morphological studies. Dig Dis Sci
46(6): 1236-46, 2001.
18. Freund JN, Domon-Dell C, Kedinger M, Duluc I. The Cdx-1 and Cdx-2 homeobox
genes in the intestine. Biochem Cell Biol 76(6): 957-69, 1998.
19. Fukuyama K, Iwakiri R, Noda T, Kojima M, Utsumi H, Tsunada S, Sakata H, Ootani
A, Fujimoto K. Apoptosis induced by ischemia – reperfusion and fasting in gastric
mucosa compared to small intestinal mucosa in rats. Dig Dis Sci 46 (3): 545-549,
2001.
20. Geyra A, Uni Z, Gal-Garber O, Guy D, Sklan D. Starving affects CDX gene
expression during small intestinal development in the chick. J Nutr 132(5): 911-7,
2002.
21. Goodman MN, Larsen PR, Kaplan MN, Aoki TT, Young VR, Ruderman NB.
Starvation in the rat. II. Effect of age and obesity on protein sparing and fuel
metabolism. Am J Physiol 239: E277-E286, 1980.
22. Habold C, Chevalier C, Dunel-Erb S, Foltzer-Jourdainne C, Le Maho Y, Lignot JH.
Effects of fasting and refeeding on jejunal morphology and cellular activity in rats in
relation to body stores depletion. Scand J Gastroenterol 39(6): 531-9, 2004.
23. Habold C, Foltzer-Jourdainne C, Le Maho Y, Lignot JH, Oudart H. Intestinal
gluconeogenesis and glucose transport according to body fuel availability in rats. J
Physiol 566(Pt 2):575-86, 2005.
24. Hague A, Bracey TS, Hicks DJ, Reed JC, Paraskeva C. Decreased levels of p26-Bcl-2,
but not p30 phosphorylated Bcl-2, precede TGFbeta1-induced apoptosis in colorectal
25. Hsu H, Shu HB, Pan MG, Goeddel DV. TRADD-TRAF2 and TRADD-FADD
interactions define two distinct TNF receptor 1 signal transduction pathways. Cell 26;
84(2): 299-308, 1996.
26. Ignotz RA, Massague J. Transforming growth factor-beta stimulates the expression of
fibronectin and collagen and their incorporation into the extracellular matrix. J Biol
Chem 25; 261(9): 4337-45, 1986.
27. Iwakiri R, Gotoh Y, Noda T, Sugihara H, Fujimoto K, Fuseler J, Aw TY. Programmed
cell death in rat intestine: Effect of feeding and fasting. Scand J Gastroenterol 36:
39-47, 2001.
28. Jeschke MG, Debroy MA, Wolf SE, Rajaraman S, Thompson JC. Burn and starvation
increase programmed cell death in small bowel epithelial cells. Dig Dis Sci 45(2):
415-20, 2000.
29. Kaiser GC, Polk DB. Tumor necrosis factor alpha regulates proliferation in a mouse
intestinal cell line. Gastroenterology 112(4): 1231-40, 1997.
30. Koubi HE, Robin JP, Dewasmes G, Le Maho Y, Frutoso J, Minaire Y.
Fasting-induced rise in locomotor activity in rats coincides with increased protein utilization.
Physiol Behav 50: 337-343, 1991.
31. Kurokowa M, Lynch K, Podolsky DK. Effects of growth factors on an intestinal
epithelial cell line: transforming growth factor beta inhibits proliferation and
stimulates differentiation. Biochem Biophys Res Commun 13; 142(3): 775-82, 1987.
32. Le Maho Y, Vu Van Kha H, Koubi H, Dewasmes G, Girard J, Ferre P, Cagnard M.
Body composition, energy expenditure, and plasma metabolites in long-term fasting
33. Lorentz O, Duluc I, Arcangelis AD, Simon-Assmann P, Kedinger M, Freund JN. Key
role of the Cdx2 homeobox gene in extracellular matrix-mediated intestinal cell
differentiation. J Cell Biol 15; 139(6): 1553-65, 1997.
34. Luciano L, Gupta PD, Groos S, Adamski J. Modulation of apoptosis by starvation:
morphological and biochemical study of rat intestinal mucosa. Cell Death and Diff 2:
259-266, 1995.
35. Massague J. TGFbeta signaling: receptors, transducers, and Mad proteins. Cell 28;
85(7): 947-50, 1996.
36. Oberhammer FA, Pavelka M, Sharma S, Tiefenbacher R, Purchio AF, Bursch W,
Schulte-Hermann R. Induction of apoptosis in cultured hepatocytes and in regressing
liver by transforming growth factor beta 1. Proc Natl Acad Sci 15; 89(12): 5408-12,
1992.
37. Piguet PF, Vesin C, Donati Y, Barazzone C. TNF-induced enterocyte apoptosis and
detachment in mice: induction of caspases and prevention by a caspase inhibitor,
ZVAD-fmk. Lab Invest 79(4): 495-500, 1999.
38. Roberts AB, Sporn MB. Physiological actions and clinical applications of
transforming growth factor-beta (TGF-beta). Growth Factors 8(1): 1-9, 1993.
39. Ruemmele FM, Beaulieu JF, Dionne S, Levy E, Seidman EG, Cerf-Bensussan N,
Lentze MJ. Lipopolysaccharide modulation of normal enterocyte turnover by toll-like
receptors is mediated by endogenously produced tumour necrosis factor alpha. Gut
51(6): 842-8, 2002.
40. Schaeffer C, Diab-Assef M, Plateroti M, Laurent-Huck F, Reimund JM, Kedinger M,
Foltzer-Jourdainne C. Cytokine gene expression during postnatal small intestinal
41. Suh E, Chen L, Taylor J, Traber PG. A homeodomain protein related to caudal
regulates intestine-specific gene transcription. Mol Cell Biol 14(11): 7340-51, 1994.
42. Suh E, Traber PG. An intestine-specific homeobox gene regulates proliferation and
differentiation. Mol Cell Biol 16(2): 619-25, 1996.
43. Trauth BC, Klas C, Peters AM, Matzku S, Moller P, Falk W, Debatin KM, Krammer
PH. Monoclonal antibody-mediated tumor regression by induction of apoptosis.
Table I:
Synthetic oligonucleotides and experimental conditions used in reverse transcription-polymerase chain reaction analysis
Gene Position Size
(bp) Sequence Cycling number Ribosomal phosphoprotein 340-360 847-828 486 5’-GTTCACCAAGGAGGACCTCA-3’ 3’-AGACACCTCTGCCTAATGTG-3’ 23-25 Cdx2 578-600 649-672 250 5’-CCCAGCGGCCAGCGGCGAAACCT-3’ 3’-TATTTGTCTTTTGTCCTGGTTTTC-5’ 28 TGFβ1 731-752 1415-1392 661 5’-GAAGTCACCCGCGTGCTAATGG-3’ 3’-GGATGTAAACCTCGGACCTGTGTG-5’ 28 TNFα 3033-3055 3178-3155 122 5’-TTCTGTGAAAACGGAGCTAAAC-3’ 3’-TTTATTACGACTAAACCACTGGT-5’ 37
Table II:
Plasma urea and corticosterone concentrations in control, fasted and refed rats
Urea g.LP -1 P Corticosterone 10P -9 P g.LP -1 P Ctrl 0.189 ± 0.007P a P 83.98 ± 61.06P a P P2r0 0.203 ± 0.011P a P 1077.42 ± 312.80P ab P P2r2 0.319 ± 0.025P ab P 51.90 ± 29.35P a P P2r6 0.282 ± 0.014P ab P 160.34 ± 72.61P a P P2r24 0.176 ± 0.015P a P 607.31 ± 243.19P ab P P3r0 0.708 ± 0.068P b P 31101.09 ± 6269.80P b P P3r2 0.598 ± 0.067P b P 708.24 ± 175.74P ab P P3r6 0.448 ± 0.009P ab P 1467.44 ± 523.99P ab P P3r24 0.243 ± 0.017P ab P 678.42 ± 384.57P ab P
Results are means ± SEM, n=6 rats per group. Within the same column, values with no letter in common are significantly different (P<0.05)
Figure legends
Figure 1: ESEM (a to i) and CSEM (j to l) observations of the morphological apoptotic
changes in the jejunal mucosa of control (a, j), phase II fasted (b, k), phase III fasted (c, l) rats
and in refed rats 2h (d), 6h (e), 24h (f) after a phase II fast and 2h (g), 6h (h), 24h (i) after a
phase III fast. V: villus, VT: villus tip, ZA: zone of apoptosis, MO: mucus orifice, VB: villus
base, M: mucus, AC: apoptotic cell, MV: microvilli.
Figure 2: Localization of TUNEL-positive cells in the jejunal mucosa of control (a), phase II
(b) and phase III fasted (c) rats, and in refed rats 2h (d), 6h (e), 24h (f) after a phase II fast and
2h (g), 6h (h), 24h (i) after a phase III fast. Bar=20µm. LP: lamina propria, E: epithelium,
VT: villus tip, TP: TUNEL-positive nucleus, NS: non-specific labeling corresponding to red
blood cells and immune cells. (j) Percentage of TUNEL-positive cells in intestinal villi. Mean
+/- SEM (n=5 animals per group). Values with different letters were significantly different (P≤ 0.05).
Figure 3: RT-PCR (A) and western blot (B) analysis of TNFα in Ctrl, P2r0 and P3r0 rats and after refeeding (P2r2, P2r6, P2r24, P3r2, P3r6, P3r24). Mean +/- SEM (n=5 per group). Values with no letters in common were significantly different (P≤ 0.05).
Figure 4: RT-PCR (A) and western blot (B) analysis of TGFβ1 in Ctrl, P2r0 and P3r0 rats and after refeeding (P2r2, P2r6, P2r24, P3r2, P3r6, P3r24). Mean +/- SEM (n=5 per group). (C) TGFβ1 immunohistochemical localization in Ctrl, P2r0, P3r0, P2r2 and P3r2 rats. TGFβ1 is localized in the cytoplasm of intestinal epithelial cells and is mainly observed in the intestinal
Figure 5: RT-PCR (A) and western blot (B) analysis of Cdx2 in Ctrl, P2r0 and P3r0 rats and
after refeeding (P2r2, P2r6, P2r24, P3r2, P3r6, P3r24). Mean +/- SEM (n=5 per group). (C)
Cdx2 immunohistochemical localization in Ctrl, P2r0, P3r0, P2r2 and P3r2 rats. Cdx2 is
Figure 2: