Publisher’s version / Version de l'éditeur:
ASTM Special Technical Publication, 670, pp. 153-180, 1979
READ THESE TERMS AND CONDITIONS CAREFULLY BEFORE USING THIS WEBSITE.
https://nrc-publications.canada.ca/eng/copyright
Vous avez des questions? Nous pouvons vous aider. Pour communiquer directement avec un auteur, consultez la
première page de la revue dans laquelle son article a été publié afin de trouver ses coordonnées. Si vous n’arrivez pas à les repérer, communiquez avec nous à PublicationsArchive-ArchivesPublications@nrc-cnrc.gc.ca.
Questions? Contact the NRC Publications Archive team at
PublicationsArchive-ArchivesPublications@nrc-cnrc.gc.ca. If you wish to email the authors directly, please see the first page of the publication for their contact information.
Archives des publications du CNRC
This publication could be one of several versions: author’s original, accepted manuscript or the publisher’s version. / La version de cette publication peut être l’une des suivantes : la version prépublication de l’auteur, la version acceptée du manuscrit ou la version de l’éditeur.
Access and use of this website and the material on it are subject to the Terms and Conditions set forth at
Analysis of load tests on instrumented steel test piles in compressible
silty soil
Bozozuk, M.; Keenan, G. H.; Pheeney, P. E.
https://publications-cnrc.canada.ca/fra/droits
L’accès à ce site Web et l’utilisation de son contenu sont assujettis aux conditions présentées dans le site LISEZ CES CONDITIONS ATTENTIVEMENT AVANT D’UTILISER CE SITE WEB.
NRC Publications Record / Notice d'Archives des publications de CNRC: https://nrc-publications.canada.ca/eng/view/object/?id=68ce6c19-3cbc-40af-b3ee-018a5b5dca80 https://publications-cnrc.canada.ca/fra/voir/objet/?id=68ce6c19-3cbc-40af-b3ee-018a5b5dca80
National Research Council of Canada Conseil national de recherches du Canada
Ser I
TH1
N21d no.879
COP..^
,,,ANALYSIS OF L O A D TESTS
Ftiil;.
ON INSTRUMENTED STEEL TEST PILES
Ls--'
IN COMPRESSIBLE SILTY SOIL
byM.
Bozozuk,6.
H.
Keenan andP. E.
PheeneyReprinted from
American Society for Testing and Materials Special Technical Publication 670, 1979
p. 153-180
DBR
Paper No. 879Division of Building Research
silts argileux compresribles. En analysant le cornportement des pieux, on a Blabor6 des Qquations sur le frottement IetQral bas6es sur les contraintes effectives d u sol. le coefficient de frottement sol-pieu e t le coefficient d e Poisson d u pieu. Ces Bquatiorrs Bvaiuent d e f a ~ o n satisiaisante Is repartition des charges de frotternent lateral n6getif rnobilis6es sur les pieux lo-squ'ils sont chargQs jusqu'h la rupture lors d e la compression e t de la tension axidles. Ces Qquations ont Qgalement 6t6 appliqu6es A plusieurs essais de pieux bien docurnent6s e t publiQs, e t ont d6montrQ que le frottement lateral pouvant Otre mobilis6 pour resister au chargement d e la compression axiale peut 6tre determinee d'aprds les essais d'arrachement. L'articie traite des mQthcdes d'essai des pieux, des mouvements observQs entre les p o ~ n t e s des pieux e t le sol sous diverses charges appliqu6es aux pieux, e i d6crit une methode d'essai en laboratoira pour mesurer I s coefficient de frottement entre le pieu e t le sol.
M.
Bozozuk, G.
H.
Keenan, and
P.
E.
PheeneyJ
Analysis of Load Tests on
Instrumented Steel Test Piles in
Compressible Silty Soil
REFERENCE: Bozozuk, M., Keenan, G. H., and Pheeney, P. E., "Aaalysls of Load Tests on l m h m e n t e d Steel Test Piles in Compressible Silty Soil," Behavior of Deep Foundations. ASTM STP 670, Raymond Lundgren, Ed., American Society for Testing and Materials, 1979, pp. 153-180.
ABSTRACT: Axial compression and tension tests were performed on two end-bearing piles (one pipe and one H-pile) and two friction piles (one pipe and one H-pile) 3 months after they were driven through a granular test fill into compressible clayey silts. In analyzing the behavior of the piles, skin friction equations were developed based upon effective stresses in the soil, the soil-pile friction factor and the Poisson's ratio of the pile. These equations satisfactorily estimated the distribution of negative skin friction loads mobilized on the piles before they were test loaded and the skin friction mobilized in the axial compression and tension pile tests at failure. The equations were also applied to some well-documented pile tests, and showed that the skin friction that can be mobilized to resist axial compression loading can be estimated from pullout tests. This paper discusses the pile test procedures and the observed relative movements between the pile tips and the surrounding soil at various loads applied to the piles and describes a laboratory test method for measuring the coefficient of friction between the pile and the soil.
KEY WORDS: test fill, pile tests, axial compression, axial tension or pullout, negative skin friction, positive skin friction, effective stress, coefficient of soil-pile friction, Poisson's ratio, relative pile tip settlement
A new bridge over the Saint John River at Fredericton, New Brunswick, will be constructed on concrete piers supported by steel end-bearing piles driven through compressible silts into a dense gravel formation. The south 'Senior research officer, Geotechnical Section, Division of Building Research, National Research Council of Canada, Ottawa, Ontario KIA OR6, Canada.
2Head, Geotechnical Section, New Brunswick Department of Transportation, New Bruns- wick, Canada.
3~eotechnical engineer, Geotechnical Section. New Brunswick Department of Transporta- tion, New Brunswick, Canada.
shore is being redeveloped and requires large volumes of fill for new roads and an interchange with the bridge. It was expected that the high approach embankments required at the south end of the bridge would cause signifi- cant settlements and generate large negative skin friction loads in the piles. To obtain design parameters for the foundatioes of the proposed bridge, the New Brunswick Department of Transportation, in cooperation with the Division of Building Research, National Research Council of Canada, embarked on an extensive full-scale field testing program. During the winter of 1977, an 11-m-high granular test embankment with a surface area of 25 by 40 m, was constructed and instrumented on the south bank of the river. In July 1977, seven steel instrumented test piles, consisting of two end-bearing and five friction piles, were driven through the test fill to study the development of negative skin friction loads. In October 1977, the two end-bearing and two friction piles were test loaded to failure in axial compression and pullout by means of a 500-ton hydraulic jack and a specially constructed steel reaction frame.
Description of the Fill and Subsoils
The 11-m-high granular test fill was constructed on the south shore of the river in line with the proposed bridge. The first stage was constructed in water to elevation + 3 m. This stage provided the working base for'the installation of most of the field instrumentation. The second stage, con- structed from 12 March to 7 April 1977, brought the surface elevation to + 9 m. Numerous in situ density tests performed during construction indicated an average density of 1825 kg/m3.
Dredged granular fill was placed around the test fill from 26 August to 19 October for the redevelopment of the south shore of the river. This dredged fill was placed over a very large area and imposed a relatively
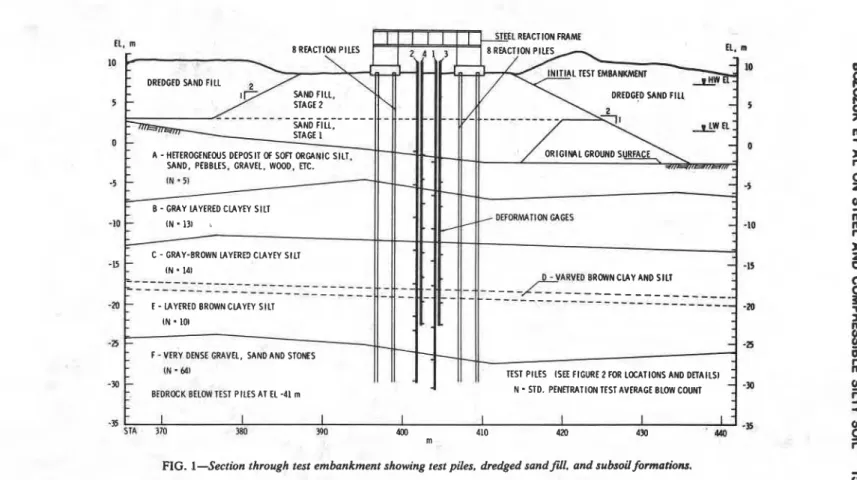
uniform distribution of vertical load on the subsoils (Fig. 1). The average 1
density of this fill was 1800 kg/m3.
The subsoils were divided into six distinct soil formations. The test fill I and dredged fill were placed directly upon layer A, a heterogeneous deposit
of soft organic silt, sand, pebbles, gravel, wood, etc. Although it varied
considerably in thickness, it was about 4 m thick beneath the center of I the test fill. It was not possible to obtain undisturbed samples of this I material for testing, but it was assumed to have a density of 1680 kg/m3.
I
Layer B was encountered from elevation -6 to - 12.5 m. This formation was a gray layered clayey silt with a water content varying from 23 to 38 percent, a liquid limit of 29 percent, and plasticity index of 9 percent. The average grain size distribution was 40 percent clay and 60 percent silt. Its average wet density was 1840 kg/m3. The maximum in-situ vane shear
i
strengths varied from 0.3 to 0.5 kg/cm2.
DREDGED SAND FILL
I II II / 5
1
E - LAYERED BROWNCLAYEY SILT I N 101
-a -.
- F - V m Y D M S E GRAVEL, SAND AND STONES
{N = MI
1
TEST PILES (SEE FIGURE 2 FOR LOCATIONS AND DETAILS)-30 - - N
-
STD. PENnRAT ION TEST AVERAGE BLOW COUNTBFOROCK BaOWTESl PILES AT EL -41 m
"-
brown layered clayey silt with properties similar to those of layer B. The water content varied from 29 to 37 percent; the average liquid limit was 34 percent. The plasticity index was 12 percent, the grain size distribution was 45 percent clay and 55 percent silt. The average wet density was 1840 kg/m3. The maximum in-situ vane shear strengths varied from 0.6 to 0.9 kg/cm2.
Layer D was a 1-m-thick varved brown clay and silt,
Layer E was a layered brown clayey silt that extended from elevation - 19 to -26 m below the center of the test fill. The water content varied from 35 to 45 percent, the average liquid limit was 40 percent and plasticity index was 20 percent. The average grain size distribution was 64 percent clay and 36 percent silt. The wet density was 1840 kg/m3. The maximum in-situ vane shear strength varied from 0.9 to 1.2 kg/cm2.
Layer F, a very dense gravel with sand and stones, was encountered at elevation -26 m. It was not possible to obtain undisturbed samples from this formation. Borings showed that it extended to an elevation -41 m, where bedrock was encountered.
Field Instrbmentation Test Fill
The test fill was designed to measure the consolidation properties of the subsoils and to verify the stability of the embankment constructed with various side slopes. Before construction started, settlement platforms were placed on the river bed to provide a complete settlement record from the start of construction. After stage one was completed, settlement gages and vibrating-wire piezometers were installed to measure the settlements and excess pore water pressures when the test fill was completed, These observations were also required when the test piles were installed 5 to 13 m (16 to 43 ft) from this instrumentation and test loaded.
The instrumentation of the test fill was completed with reference bench- marks and reference Geonor hydraulic piezometers installed outside of the construction area. Gloetzl earth pressure cells were installed to check the distribution of vertical and horizontal stresses, and slope indicator casings were installed to measure horizontal soil movements under and beyond the toe of the test fill.
Test Piles
The locations of the test piles are shown on the plan on Fig. 2. The two end-bearing piles (nos. 1 and 2) and the two friction piles (nos. 3 and 4) were driven along two lines 3.048 m apart. Piles 1 and 4 were HP 304.8 mm 132 kg/m (12 in. by 89 lb/ft); piles 2 and 3 were closed-end steel pipes
324 mm outside diameter by 7.92 mm wall (12% in. outside diameter by 0.312 in. wall). The center-to-center spacing between the piles was seven pile diameters (2.266 m) along each line.
Each pile was instrumented with eight deformation gages [114 or telltales. They consisted of two concentric steel pipes with the outer casing welded continuously to the outside of the pipe or to the inner web of the steel H-piles. The inner pipe formed the stress-free reference rod for the measure- ments. The upper 11 m of each pile was coated with asphalt to prevent the development of skin friction in the granular fill. Therefore the first gage extended to a depth of 11 m. The remaining uncoated length of pile was subdivided into equal lengths for the remaining seven gages, with one gage extending to the bottom of the pile. Steel saddles were mounted on the test piles about 25 mm (1 in.) above each deformation gage so that the relative movements between the pipes could be measured with a mi-
crometer or dial gage. These measurements were made to within 0.0025 mm (0.0001 in.).
The test piles were driven with a diesel pile driver using a 1360-kg (3000-lb) hammer, providing a driving energy of 4011 kg-m (29 000 ft-lb). When the piles passed through the granular fill, the driving resistance for all piles was about 66 blows/metre (20 blowdft). Piles 3 and 4 terminated in layer E at a driving resistance of 187 and 102 blowdm (57 and 31 blowdft), respectively. Piles 1 and 2 terminated in layer F at a driving resistance of 476 and 836 blowdm (145 and 255 blows/ft), respectively.
When piles are driven into the soils in the Fredericton area, the soil is usually squeezed out as a fluid along the pile shafts. This is due to the collapse of the soil structure and because the liquid limit of the soil is equal to or greater than the natural water content. Under these conditions,
it is improbable that substantial residual stresses could exist in the piles after they were driven.
The piles were installed during the period 14 to 21 July; on 7 September, test pile no. 2 was filled with concrete to strengthen it for load testing. This concrete had a 28-day strength of 359 kg/cm2 (5100 psi) and a 171-mm (6%-in.) slump, which varied significantly from that specified. At 41 days, its modulus of elasticity was measured to be 2.74 X 10⁵ kg/cm2 (3.9 X 10⁶ psi). This pile was test loaded in compression on 21 October,
Load Testing Equipment
In order to load the piles to failure in axial compression and pullout, a twin girder reaction frame was designed, constructed, and positioned over the piles as shown schematically in Fig. 1. Each steel girder, 10.46 m long by 0.61 m wide and 2.51 m deep, was positioned directly over each
BOZOZUK ET AL ON STEEL AND COMPRESSIBLE SILTY SOIL 159
row of test piles as shown in Fig. 2. They were supported at the ends by steel towers anchored to heavy reinforced concrete footings, which were in turn anchored to eight HP 304.8 mm by 79 kg/m (12 in. by 53 lb/ft) steel reaction piles driven to end bearing in the dense gravel formation. The girders were cross braced for added stiffness. The closest center-to- center distance between the reaction and test piles was nine pile diameters. Each test pile was fitted with a 76.2-mm (3-in.) thick steel bearing plate to provide a rigid, full-bearing surface for a 500-ton calibrated load cell and a 500-ton hydraulic jack. Steel reaction plates 50.8 mm (2 in.) thick were also welded to the top and bottom flanges of each girder directly above the test piles to distribute the reaction loads exerted during the test. To carry out the axial compression tests, the load cell was first carefully centered over the test pile. A 25.4-mm-thick flat steel plate was then placed over it and under the hydraulic jack, which was carefully centered over the load cell. A second 76.2-mm-thick flat steel plate was clamped above the jack to the underside of the reaction girder. This provided a sturdy reaction plate for the jack to push against (Fig. 3).
To monitor the deformation response of the test pile to the applied loads, the micrometer saddles were replaced by dial gage mounts, which supported the dial gages and electric linear variable displacement trans- ducers (LVDT). This double measuring system produced a continuous automatic recording of all the deformation gage movements as well as mechanical measurements while the pile was loaded. Two additional dial gages were fastened to each side of the pile head; each reacted against a steel beam reference bridge. They provided an independent measure of the vertical movement of the pile head relative to the surrounding ground and showed any tilting of the pile head during loading.
To perform the pullout tests, the load cell and the hydraulic jack were carefully positioned on top of the reaction girder directly over the test pile following the same procedure as for the compression tests. An upper pullout yoke was positioned over the jack and a bottom yoke securely bolted to the head of the test pile. The two were connected together with four 44.5-mm outside diameter steel rods, which thus allowed the jack load to pull upon the pile.
Effect of Changes in Pore Water Pressures on Negative Skin Friction Field observations on all the test piles showed that as excess pore pressures dissipated and the fill settled, they compressed axially due to negative skin friction, but when the pore pressures increased, the piles rebounded. This behavior is illustrated by the observations for test pile no. 4 (Fig. 4). The axial compressions on test pile no. 4 started immediately after it was installed in July and increased with time, reflecting the buildup of negative skin friction load as the pore pressures dissipated and the fill
FIG. 3-Setup for applying axial compression loads showing load cell. 500-ton-capacity hydraulic jack, and measuring gages.
settled. In late August, a 7460-kW (10 000 hp) dredge started pumping 1.15 X lo6 m3 of saturated clean sand and gravel around the test fill (Fig. 1) for the redevelopment of the south shore of the Saint John River. The
in-situ pore water pressures increased considerably and almost reached
their previous maximum values measured when the test fill was constructed. During this buildup of excess pore pressure, the pile compressions reduced markedly, falling to 25 percent of their previous maximum value when the excess pore pressures were at their highest on 7 October. After this date, the excess pore water pressures started dissipating and the axial compressions in the pile increased again.
BOZOZUK ET AL ON STEEL AND COMPRESSIBLE SILTY SOIL 161
19n
JUL AUC SEPl K T NOV
5 1 5 2 5 5 1 5 2 5 5 l 5 2 5 5 1 5 2 5 5 l 5 2 5
I I
--- ----
-,.
u
2 4.0
-
-?
-
SURFACE ELEVATION OF TEST FILL = +9.O rn -3 r - * o . o I I I I j I I I I I I I I I I I I I I I I 1 1 1 1 Z -
FIG. 4-Variations in compression of pile no. 4 caused by changes in negative skin fric- tion load due to changes in pore water pressures.
high, the test piles were subjected to axial compression and pullout loads. At the completion of these tests, the piles continued to compress axially as the negative skin friction loads developed with the dissipation of the excess pore water pressures.
These observations along with the work of many recent investigators
[2-7] show that negative skin friction is affected by changes in pore water pressures and consequently is related to the effective stresses in the soil around the pile.
Skin Friction Load on a Single Pie
Skin friction on the pile is directly proportional to the effective normal pressure of the soil
[a].
Consider a pile driven into a compressible soil and neither it nor the soil is loaded; that is, there are no relative movements between the pile and the soil. Then the potential skin friction that could be mobilized would be given bywhere
PO = potential skin friction,
ah' = total horizontal effective normal soil pressure acting on the pile, and
tan 6
'
= coefficient of friction between the pile and the soil, where 6'
is the angle of friction between the soil and the pile.The total horizontal effective normal soil pressure acting on the pile will consist of
ah' = ah;
+
Aa&+
A d 3 (2)ah; is the in-situ horizontal effective stress in the soil before the pile is driven. It is related to the vertical effective stress by
Unless
K O
is measured, it can be approximated for normally consolidated soils [9] fromwhere
+'
= coefficient of internal friction of the soil. Aoiz is due to any surcharge placed on the surface of the ground around the pile. For large uniformly loaded areas, it can be calculated fromKO
Aa,!, where Au,! is the applied effective vertical uniform surcharge pressure. For surcharges such as embankments, it can be calculated using normal engineering methods.Auk ' 3 is developed when the pile is driven into the ground. For an open- ended pipe that is cleaned as it is driven and for H-piles, the soil displaced will be negligible and this term can be neglected. For all other driven piles, the soil displaced will equal the volume of the pile. The fact that pore pres- sures are generated when the pile is being driven shows that horizontal stresses develop during driving.
Published literature tends to show that this increase in horizontal stress dissipates quickly with time for a single pile. Chandler [4] stated that the lateral stresses around bored piles in London clay gradually returned to the in-situ conditions. Yang [ l o ] reported that when steel piles were driven in sands and organic silts and redriven about 5 days later, the blow count was often reduced by as much as 50 percent due to soil relaxation around the pile. Furthermore, Baguelin and Jezequel [ I I ] measured the increase in horizontal stresses on an instrumented 1 m square closed-end large displacement steel test pile driven 4 m into soft silty clay. They reported that after 1 month, the horizontal effective stresses had reduced to the original in-situ values. Consequently, for long-term conditions, Auk can be
BOZOZUK ET AL ON STEEL AND COMPRESSIBLE SILTY SOIL 163
I
neglected for single piles driven in weak compressible silty clays. It should, I
I however, be considered for large groups of closely spaced piles.
I
in a laboratory test or estimated from The coefficient of friction between the pile and the soil can be measured tan 8' = M tan9'
( 5 )where
9'
is obtained from undrained triaxial strength tests with pore pressure measurements, and the ratio M [2,12] has the following range for steel and concrete pilesI
Assuming a circular pile of circumference (or perimeter) C installed to a depth L in a uniform soil deposit with the groundwater table at the surface, the axial load due to skin friction mobilized along the shaft will be given by
(6)
where y, ' is the submerged unit weight of the soil. Let
where
/3
is the soil-pile friction factor with units of kilograms per metre cubed.I Introducing
/3
into Eq 6 and simplifying,To calculate the skin friction resistance from any depth D to L, Eq 8 becomes
Similarly, negative skin friction is given by I
I
PN
= ?hCP(L2 -D 2 )
I
When the pile is loaded rapidly to failure in axial compression or tension,
1
the skin friction resistance mobilized in the compression test is usuallyI much greater than in the tension test [13]. In the rapid compression test,
contact pressure increases. The pile also expands under the applied axial load, increasing the contact pressure and the skin friction resistance along the shaft of the pile, thus raising the axial compression load at failure. In the tension test, the reverse takes place; the horizontal pressure between the shaft of the pile and the soil decreases and the pullout load is reduced. The incremental increase or decrease in axial load due to skin friction mobilized along the shaft of the pile at failure was found to be related to Poisson's ratio Y of the pile material. Hence, for axial compression loads
due to positive skin friction, Eq 9 was modified to
Similarly, the skin friction for axial tensile loads applied to the pile is given by
These equations can be used to estimate skin friction loads on piles driven into layered soil formations.
Pie Load Tests
Test Procedure
The test piles were subjected to a constant rate of loading, applied in increments of 10 tons every 10 min. During the test, each load was main- tained for 9 min, allowing 1 min to increase the load to the next level. Readings were made on all the deformation gages (dials, LVDTs) and settlement dial gages on the pile head at 0, 3, 6, and 9 min. It was therefore possible to observe the load transferred to the soil by positive skin friction as the applied loads increased until the pile failed. The sequence of pile testing was 3, 4, 2, and 1; that is, the friction piles were loaded before the end-bearing piles. Thus, the loading equipment was checked out before the higher-capacity end-bearing piles were tested.
The compression loads were removed from the friction and end-bearing piles in five and ten increments, respectively, whereas the tension loads were removed in about half the number. Engineering level surveys were performed during the loading tests to obtain a secondary set of pile head movements to check those made with the dial gage and steel beam reference bridge.
Axial Compression Tests
BOZOZUK ET AL ON STEEL AND COMPRESSIBLE SILTY SOIL 165
friction loads. The measured axial deformations (settlement) due to the "prestress" from negative skin friction was used as the starting point of the test curves for the four piles in Fig. 5. Upon loading, the initial pile settlements reflected this "prestress" until it was exceeded by the applied axial load, after which the piles performed normally until failure occurred. The friction piles nos. 3 and 4 performed about the same. Pile head settlements were small until the ultimate load was reached, when the piles "plunged" into the ground. The bearing capacity of the pipe pile no. 3 was 159 tonnes (175 tons) and that of the H-pile, no. 4, 141 tonnes (155 tons). The difference was attributed to the greater end-bearing load developed by the pipe pile.
The end-bearing piles had similar load settlement curves, except that the H-pile (no. I), settled more than the concrete-filled pipe pile (no. 2) during the test for the same loads. Using Davisson's failure criteria [14], the ultimate bearing capacity of the pipe pile was 372 tonnes (410 tons), which was greater than the 350 tonnes (385 tons) obtained for the deeper (by 1 m) H-pile.
Not only did the H-pile heads settle more than the pipe pile heads but, from the elastic compression measurements, the H-pile tips also settled more as will be shown later. The same observations applied to the friction piles.
During unloading all the piles easily supported the initial estimated shaft friction load overnight (Fig. 5). With the exception of pile 4, which settled slightly, the other three piles showed a slight rebound. When the loads were reduced to about 200 tonnes (220 tons) on piles 1 and 2, the rebound after 1 day was even greater. These observations show that the test piles easily supported axial compression loads smaller than the estimated I maximum skin friction load.
When the piles were completely unloaded, they rebounded to within
I
0.3 mm (0.01 in.) of the lengths they had before the loads were applied. This indicates that the only significant residual stresses at the beginningI
and end of the tests were due to negative skin friction.I Axial Tension Loads
The pullout load-deformation behavior of the test piles is shown in Fig. 6. For friction piles 3 and 4, the curves are similar to the axial compression curves (Fig. 5), except that the failure loads were considerably less. The curves for bearing piles 1 and 2 resemble those obtained for the friction piles. It was observed from the deformation gage measurements that as soon as the pile tips started to move upward relative to the soil, the pile started slipping out of the ground at constant load. The ultimate pullout failure loads in order of magnitude were 59, 68, 127, and 150 tonnes (66, 76, 140, and 165 tons) for test piles 4, 3, 1, and 2 respectively. Note that
ESTIMATED MAXIMUM Y a
-
W C Y V) 1 END BEARING H 2 END BEARING 2 . 5 - 3 FRICTION 0 4 FRICTION H P i l e D e t a i l s on f l g . 2the pullout loads for the H piles were smaller than for the corresponding pipe piles.
Because the piles were prestressed with negative skin friction loads, the elongation of the piles would be somewhat greater in the pullout tests. However, the magnitude of the failure loads given above would not be affected.
Friction Load Estimates for Test Piles Determination of Soil Parameters
To estimate the skin friction loads that can be mobilized along the shaft of a pile subject to axial tension or compression loads, the soil-pile friction factor /3 given in Eq 7 must be evaluated. The horizontal effective stresses are related to the vertical effective stress by Eq 3. From the measured densities of the various soil formations and the in-situ pore pressures measured at the time the piles were test loaded, the distribution of vertical total and effective stresses shown in Fig. 7 were obtained. The coefficient of internal friction of the soil 6 ' was measured at five elevations within
V E R T I C A L S T R E S S , ~ g l c r n '
BOZOZUK ET AL ON STEEL AND COMPRESSIBLE SILTY SOIL 169
soil formations B, C, and E (Fig. 1) by performing isotropically consolidated undrained triaxial shear strength tests with pore pressure measurements. The range of +' was 30 to 32 deg, with an average of 31 deg. Using Eq 4,
K O
= 0.48 was obtained, which was assumed to apply to the whole soil profile except for layer F.A soil-pile friction test apparatus was designed and constructed to evaluate the coefficient of friction tan 6' between the steel pile and the surrounding soil. The design was based on the fact that a driven pile disturbs the soil and that the stress transfer between the pile and the soil must be through the disturbed soil. Consequently, the test apparatus measures the coefficient of friction between remolded and reconsolidated soil and a steel cylindrical model pile in terms of effective stress.
A schematic diagram of the apparatus is shown in Fig. 8. It consists of a heavy bronze cubical chamber with outside dimensions of 152 mm on each side. The three interior vertical walls and the front cover are fitted with expandable rubber diaphragms, which are used to consolidate the soil against the model pile. Drainage occurs through the top and bottom of the cell. The steel cylinder or model pile (51 mm outside diameter by 102 mm long) is fitted with three pore pressure sensors. Relative movements between the pile and the soil are obtained by applying a torque through the torque transducer mounted on the shaft connected to the top of the cylinder.
In operation, the cell containing the pile is filled with soil remolded at a water content exceeding its liquid limit. A consolidation pressure at, is applied to the soil by inflating the diaphragms with water under pressure. When consolidation is complete, the st& cylinder is rotated through the torque transducer at the rate of 2 deg per hour. The torque and the applied consolidation pressure corrected for the excess pore pressure define an effective stress soil-pile friction test curve shown in Fig. 9. At the end of the test, the soil is consolidated to a higher pressure, the direction of rotation reversed, and another test curve obtained. This procedure is repeated for four or five consolidation pressures until the friction envelope is defined (Fig. 9).
The soil-pile friction angle for the clayey silt at the test site was measured to be 6' = 24 deg, and tan 6 ' = 0.445. The ratio M for this silty clay on a normal steel surface is
M=--
- 0.74tan
+
'Axial Tension and Compression Loads
With this information and assigning a Poisson's ratio v = 0.29 for the steel piles, the skin friction resistance to pullout was determined from
TRANSDUCER
BOZOZUK ET AL ON STEEL AND COMPRESSIBLE SILTY SOIL 171 S A M P L E N O . 1 5 4 - 3 8 N A T U R A L WATER CONTENT: 4 1 % S I L T : 60% C L A Y : 40% D E N S I T Y : 1 8 2 6 k g l m 3 a,,' kglcm 2
FIG. 9-Soil-pile friction tests.
Eq 12. The contact perimeter C for the pipe piles was corrected for the additional area of the deformation gages welded to the outside of the pile. For the H-piles, C was assumed to be a square section equal to the flange width. The asphalt coating in the upper part of the piles was assumed to be 50 percent effective in reducing friction. The weights of the piles were not considered.
The estimated pullout loads are compared with the measured values in Table 1. The comparisons are very good for the friction piles. It was not possible to predict the friction resistance for the end-bearing piles in the dense gravel, as no samples were tested from this layer. The 50 tons entered in the table for pile 2 was taken as the difference between the measured load and the value estimated for the clayey silt formation and allowing for the weight of the concrete filled pile. It was then possible to calculate the pullout resistance for pile no. 1, which overestimated the measured load by about 20 tons or 14 percent.
The axial compression loads estimated with Eq 11 are compared with the field test values in Table 2 and in Fig. 5. The point resistance for the friction piles was estimated from Meyerhof [ I S ] . The comparisons are again very good for the friction piles.
The point resistance for the end-bearing piles was estimated from Stan- dard Penetration Tests after VesiC. [23]. The estimate of skin friction load
TABLE 1-Comparison of estimated and measured axial pullout loads. Estimated Side Friction, tons Measured
Depth of Pen- Load at
Pile No. Pile Type etration, m Clayey Silt Dense Gravel Sum Failure, tons
3 pipe 31.7 80
. . .
80 764 H 31.5 80
.
. .
80 662 pipe 38.8 105 50 155 165
1 H 39.6 105 55 160 140
Conversion factor--1 ton = 0.908 metric tonne.
TABLE 2-Comparison of estimated and measured axial compression loads. Estimated load, tons
Side Friction Measured
Depth of Load at
Penetra- Clayey Dense Point Failure, Pile No. Pile Type tion, m Silt Gravel Resistance Total tons
3 pipe 31.7 150
...
20 1 70 1754 H 31.5 150
...
5 155 1552 vioe 38.8 190 90 140' 420 410
1 - H 39.6 195 100 30" 325 385 195 100 8Sb 380 385 Conversion factor-1 ton = 0.908 metric tonne.
a Estimated from Vesif (1977) using Standard Penetration Test and actual area of tip of pile.
Estimated from VesiC (1977) assuming effective end area equals 50 percent of box enclosing tip of H pile.
in the dense gravel, however, was based on the pullout resistance of 50 tons (pile 2, Table 1). The comparison between the estimated and the measured ultimate bearing capacity was again quite satisfactory.
If the estimated maximum friction resistance is realistic, then the tip of the pile loaded in axial compression should move down relative to the soil just enough to mobilize the full skin friction on the whole length of the pile. Selecting load test values that were close to the estimated maximum friction loads the corresponding vertical pile movements were plotted as curve 2 for each pile in Fig. 10. In each case, the tip movements were about equal to or less than 4 mm; the amount specified by Davisson [14] and Vesii
[ A
required to mobilize full skin friction. At the smaller loads (curve 1). the pile tips showed very little movement. At loads close to the ultimate failure load (curve 3), the piles moved bodily downward but remained essentially parallel to curve 2, indicating that no additional friction resistance was mobilized. The pile movements due to negative skin friction loads up to the time of the field tests are indicated on the figure as curve N.Downdrag Loads
Since the negative skin friction loads were known from the pile compres- sions measured prior to the field tests, it was possible to compare the
BOZOZUK ET AL ON STEEL AND COMPRESSIBLE SILTY SOIL 173
VFRTICAL MWEMENT OF PILE, in.
ao a4 as 1.2 1.6 D a.4 as
0 10 20 U) 40 0 10 20
VERTICAL MQVEMENT OF PILE, mm
FIG. 10-Effect of axial comhression loads on pile movements.
distribution of these loads along the1 piles with those estimated with Eqs 9 and 10 for the effective stress conditions that existed in the soil at that time. The downdrag loads in the upper part of the friction piles 3 and 4 would be resisted by positive skin friction developed at the lower end. The downdrag loads on the end-bearing piles 1 and 2 would develop to layer C (Fig. I), as no settlements were m$asured in this layer. It was assumed that these piles (1 and 2) would bd unloaded by positive skin friction to the bottom of layer E (Fig. 1). The rbsults are compared in Fig. 11.
The field measurements (curves A) showed that the friction piles had from 60 to 70 tons of downdrag load, whereas the end-bearing piles had from 70 to 100 tons. It is expected that these values will increase when all the excess pore pressures have dissipated.
I ton (US) = 0.- Ionno
BOZOZUK ET AL ON STEEL AND COMPRESSIBLE SILTY SOIL 175
coating eliminated skin friction (curves B) and assuming the coating did not exist, that is, was not effective (curves C). The unloading due to positive skin friction is given by curves D. End bearing was not considered, but it appears that some end bearing was mobilized. The figure shows a reasonably good correlation between the field and estimated load distribution for all piles except no. 2. This pile was filled with poor-quality, very wet concrete and it is certain that the field loads were overestimated from the measured pile deformations. The figure also shows that the asphalt coating did not eliminate negative skin friction.
Case Records
The results of the pile test program on the Fredericton test piles indicate that pullout tests may be used to estimate the skin friction loads for axial compression. When different piles are used, the calculations would be based on Eqs 11 and 12. If, however, both tests are performed on the same pile as was done in Fredericton, the soil-pile friction factor 0 does not change. Consequently the axial compression and axial tension friction loads on the pile are related through the Poisson's ratio of the pile material
From various handbooks [16-181, Poisson's ratio for various pile materials are
Cold rolled steel v = 0.29
High strength concrete v = 0.24 Timber loaded parallel to grain v = 0.37
Friels [19] conducted a number of these tests in Tennessee on various lengths of HP 10 X 42 piles driven into alluvial silt and sandy silt. The measured pullout and axial compression failure loads are summarized in Table 3. The estimated positive skin friction loads for three of the H-piles (nos. 46, 48, and 49) is about the same as the axial compression failure load, indicating no mobilization of point resistance or that the piles were not loaded to ultimate failure. The estimated value for pile 47 exceeds the load test value by about 16 percent.
D'Appolonia [20] conducted push and pull tests on concrete-filled pipe, of 12% in. outside diameter, and 14BP89 steel piles instrumented with telltale gages at two different sites along the southern shore of Lake Mich- igan. The test results for four of the piles are given in Table 3.
Penetraiion Soil Profile
Pile h p t h , from Ground
No. Description ft Surface
Ultimate tons Failure m
Pullout Load in Axial
Load, Positive Point omp press ion.
$
tons Friction Resistance tons-
0Y
Friels [I93
46 steeI, HP 10 X 42 39.5 29 ft silt 23 40
...
38R
47 steel. HP 10 X 42 55.2 9 ft silty sand 68 120
-..
103 m 1348 steel, RP 10 X 42 45.5 5 ft sandy clayey silt 52 95
. . .
90 rn49 stel, H P 10 X 42 27 8 ft silty sand 18 30
.. .
27 vD'Appolonia
[a
?2L
A-1 12% in. OD pipe 94 32 A slag and sand fill: 53 ft stiff 149 270
..,
360 Zand concrete silty clay 0
A-3 12% in. OD pipe 80-93 "hardpan" 140 255
. . .
3505
and m a t e
B-4 steel 14BF89 111.9-128.9 35 ft sand; 7 ft lake clay 160 290
...
3104
cnB-5 steel 14BP89 44.6 65 ft lake till: glacial till 175 320
...
300Fellenins and Samson 1131
9 precast m a e t c
H800.30 cm OD 55 marine clay
Mansur and Hunter I211
2 l K i . p i p 52.8 Relatively dense; medium to 100 180
. . .
1954 l i m . concrete 40.2 fine sands, with some 85 140
.
,.
1707 steel 14EP73 52.1 layers of silt and clay 70 130
...
1908 timber (class A) 38.6 30 65
. . .
80Conversion factors-
1 ft = 0.305 m, and
BOZOZUK ET AL ON STEEL AND COMPRESSIBLE SILTY S ~ I L 177
about the same depth into "hardpan." Pile A-1 was driven as a normal pile, but pile A-3 was cased to 24.4 m (80 ft). The difference between the
estimated positive friction loads and the measured compression load at failure gave about the same end-bearing resistance for both piles showing consistency in the field tests and estimates. Furthermore, the estimated 270-ton friction load for A-1 coincided with the sharp break in the field loading curve (Fig. 12).
At site B, the two steel H piles were driven through sand, lake clay, lake till, and glacial till. Pile B-5 terminated in the lake till, and the estimated friction load exceeded the ultimate failure load by 7 percent. Pile B-4 was driven through a casing extending to the glacial till. The estimated friction load was less than the compression failure load by 6 percent.
Fellenius and Samson [13] performed a pullout load test on an 18.6-m (61-ft) long precast concrete H 800 pile driven in sensitive marine clay in Quebec. An axial compression test was performed on another similar pile (no. 9, Table 3), 180 m away, driven to a depth of 16.8 m (55 ft). The estimated combined friction and end-bearing load of 80 tons was 11 percent below the measured test value but coincided with the minimum postpeak value of 80 tons shown in Fig. 12.
Mansur and Hunter [21] performed numerous pullout and axial com- pression pile load tests on concrete, steel, and timber piles driven into the alluvial sediments along the Arkansas River below Pine Bluff. The alluvial sediments were composed of relatively dense medium to fine sands with seams or layers of silt and clay.
The four test piles reported in Table 3 were subjected to several cycles of pullout and axial compression loads. The pullout load used to estimate the positive friction load was determined from the last load cycle of each test and consequently differ from the values reported by the authors. The estimated positive friction loads for the 40.6-cm (16-in.) pipe (no. 2), 40.6-cm (16-in.) concrete (no. 4), 14BP73 steel (no. 7), and timber (no. 8) piles were, respectively, 180, 140, 130, and 65 tons, which were less than the measured failure loads reported in Table 3. These friction loads generally coincided with the start of the rapid change in slope of the load settlement curves shown on Figs. 12C-F, indicating that the estimates reasonably defined the actual skin friction loads mobilized on the steel, concrete, and timber piles. '
Considering the above cases, it appears that the skin friction resistance that is mobilized to carry axial compression loads can be estimated from the axial pullout failure load and the Poisson's ratio of the pile material. Vesic' [22], however, reports results where pullout and compression skin friction loads are about the same. Consequently, the proposed relation requires further study.
l l d 4 0 1 d d d d l S l H 3 N I - . . . w e -d d d d S3HJNI
BOZOZUK ET AL ON STEEL AND COMPRESSIBLE SILTY SOIL 179
Two friction and two end-bearing pipe and steel H-piles driven through a granular test fill constructed on compressible clayey silts were field loaded to failure in axial compression and tension three months after they were installed. During this time, the instrumented piles compressed axially due to negative skin friction, then rebounded as the excess in-situ pore water pressure increased when additional fill was placed around the test embankment. This phenomenon was attributed to changes in effective stresses around the pile.
Relating skin friction to the horizontal effective stresses acting on the pile, equations were developed to estimate negative skin friction and skin friction due to axial compression and tension loads on single piles. The friction loads that can be mobilized under rapid loading conditions in compression or tension are related to the Poisson's ratio of the pile material. A soil-pile friction apparatus was described that was used to measure the coefficient of friction tan 6 ' =
M
tan 4 '.
Conclusions
1. Effective stress equations were developed to estimate the magnitude and distribution of negative skin friction and the skin friction mobilized on test piles loaded rapidly to failure in axial tension and compression.
2. The coefficient of friction tan 6 ' between the steel pile and the silty soil measured on remolded soil with the soil-pile friction apparatus was 0.445.
3. The soil-pile friction factor /3 can be evaluated from the properties of the soils or from field pullout load tests on piles.
4. An analysis of the pile tests and other published data indicates that positive friction mobilized to resist axial compression loads may be related to the skin friction mobilized in the axial tension test through the Poisson's ratio of the pile material.
5. The pile tip movement required to mobilize the maximum skin friction to resist axial compression loads is about 4 mm.
6. The asphalt coating applied to the upper part of the test piles did not eliminate skin friction.
Acknowledgments
This project was financed by the New Brunswick Department of Trans- portation, but the study was a cooperative effort with the Division of Building Research of the National Research Council of Canada. The authors are indebted to W. J. Oudemans, who initiated the project, and to D. Smith, who designed the test facilities for loading the piles. The assistance of the technical staff from both departments is gratefully acknowl-
Deputy Minister of the New Brunswick Department of Transportation, and of C. B. Crawford, Director of the Division of Building Research.
[ I ] Bozozuk, M. and Jarrett, P. M., "Instrumentation for N e g a h Skin Friction Studies on Long Piles in Marine Clay on the Autoroute du Quebec," presented at the vorkshop Meeting of the International Bridge, Tunnel and Turnpike Association, Montreal, Nov. 1966, (reprint available-NRC 10046).
[2] Bozozuk, M., Canadian Geotechnical Journal, Vol. 9, No. 2, 1972, pp. 127-136.
[3] Burland, J. B., Ground Engineering, Vol. 6, No. 3, 1973, pp. 30-42.
141 Chandler, R. J. CiGl Engineering and Public Works Review, Vol. 63, No. 738, 1968, pp. 48-51.
[5] Esrig, M. I., Kirby, R. C., and Bea, R. G., "Initial Development of a General Effective Stress Method for the Prediction of Axial Capacity for Driven Piles in Clay," presented at 9th OTC (Offshore Technology Conference) Houston, Texas, 2-5 May 1977.
[61 Parry, R. H. G. and Swain, C. W., Ground Engineering, Vol. 10, No. 3, 1977, pp. 24-26.
[ A VesiC, A. S., "Design of Pile Foundations," National Cooperative Highway Research Program Synthesis of Highway Practice No. 42, Transportation Research Board, National Research Council, Washington, D.C., 1977.
[81 Bakholdin, B. V. and Bol'shakov, N. M., "Investigation of the State of Stress of Clays During Pile Driving," Scientific-Research Institute of Bases and Underground Structures, translated from Osnovaniya, Fundamentij i Mekhanika Gruntov. No. 5, 1973, pp. 7-9.
[9] Jaky, J., Proceedings, Second International Conference on Soil Mechanics and Foundation Engineering, Vol. 1, 1948, pp. 103-107.
[I01 Yang, N. C., Journal of the Soil Mechanics and Foundations Dcvision, Proceedinzs. American Society of Civil Engineers, Vo!. 96, No. SM2, 1970, pp. 395-409.
[ I l l Baguelin, F. and Jezequel, J. F., "Etude Experimentale de Fondations Profondes Rigides Sollicitks Horizontalement," Laboratoire Central des Ponts et ChaussCes, DCpartement des Sols, Paris, Rapport No. 71-B-687, mai 1971.
[12] Potyondy, J. G., G6otechnique. Vol. 1 1 , No. 4,1961, pp. 339-353.
[I31 Fellenius, B. H. and Samson, L., Canadian Geotechnical Journal, Vol. 13, No. 2, 1976, pp. 139-160.
[ l 4 ] Davisson, M. T., "High Capacity Piles," Proceedings, American Society of Civil Engi- neers, Lecture Series, Innovations in Foundation Construction, Illinois Section, 1972, also in Foundation Engineering, 2nd ed. Peck, Hanson, and Thornburn, Eds., Wiley, New York, 1974.
[IS] Meyerhof, G . G . , G6otechnique. Vol. 3, No. 7, 1953, pp. 267-282.
[I61 Baumeister, T., Avallone, E. A., and Baumeister 111, T., Eds., Standard Handbook
for Mechanical Engineers, 8th ed., McGraw-Hill, New York, 1978.
[17] Urquhart, L. C., Ed., Civil Engineering Handbook. 4th ed., McGraw-Hill, New York, 1959.
1181 Wood Structures, A Design Guide and Commentary, Compiled by Task Committee on Status-of-the-Art: Wood, Committee on Wood, ASCE Structural Division, American Society of Civil Engineers, New York, 1975.
[I91 Friels, D. R., "Axial Load and Uplift Resistance of Steel H-Piles," Piletips, Piling and Foundation News, Associated Pile and Fitting Corporation, July-Aug. 1977, pp. 5-7.
[20] D'Appolonia, E., "Load Transfer-Bearing Capacity for Single Piles and Pile Clusters," Lecture presented to the Illinois Section, Soil Mechanics and Foundations Division, American Society of Civil Engineers, April 1968.
[21] Mansur, C. I. and Hunter, A. H., Journal of the Soil Mechanics and Foundations
Division, Proceedings. American Society of Civil Engineers, Vol. 96, No. SMS, 1970, pp. 1545-1582.
[22] Vesib, A. S . , Journal of the Soil Mechanics and Foundations Division, Proceedings.
American Society of Civil Engineers, Vol. 96, No. SM2, 1970, pp. 561-584.
[23] VesiC, A. S., "Design of Pile Foundations," National Cooperative Highway Research Pro- gram Synthesis of Highway Practice No. 42, Transportation Research Board, National Research Council, Washington, D. C., 1977.
This publication is being distributed by the Division o f Building Research o f the National Research Council of Canada. It should not be reproduced in whole or in part without permission of the original publisher. The Division would be glad t o be of assistance in obtaining such permission.
Publications of the Division may be obtained by mailing the appropriate remittance (a Bank, Express, or Post Office Money Order, or a cheque, made payable t o the Receiver General of Canada, credit NRC) t o the National Research Council of Canada. Ottawa. KI'AOR6. Stamp* re not acceptable.
A list of all publicatians of the Division is available and may be obteined from the Publications Section, Division o f Building Research, National Research Council of Canada, Wawa. K I AOR6.