THE EFFECT OF OXYGEN ON THE MECHANICAL PROPERTIES OF A B.C.C. TITANIUM ALLOY
by
WILLIAM DAVID ROSENBERG
Rensselaer Polytechnic Institute M.S. Syracuse University 1966
Submitted in Partial Fulfillment of the Requirement for
Degree of DOCTOR OF SCIENCE
at the
MASSACHUSETTS INSTITUTE OF TECHNOLOGY 1972 Signature Certified of Author Department of Metallurgy SiencTq May 5, 197 1 t;nd Materials T~"s S u pervisor 's
Cha i rn $n 1Defe jtle-al mmi trt on Graduate Students Accepted by
Archives
JUL 5 1972
1bRARIES B.Met. E. 1963 the2
THE EFFECT OF OXYGEN ON THE MECHANICAL PROPERTIES OF A B.C.C. TITANIUM ALLOY
by
WILLIAM DAVID ROSENBERG
Submitted to the Science on May 5 requirements for Department of 1972 in parti the degree of Metal 1 al ful Doctor
urgy and Materials fillment of the of Science ABSTRACT The in of a body-cent atom percent) Three levels o percent, were constant was s oxygen. The r shown to be at 770 to 5380K. electron micro of strength up strengthening oxygen content level of strai size in the fo oxygen content strengthening. flow stresses equal in this function of gr work hardening strength and d dependences on developed in a of screw dislo plane and Burg be (211), and significant gr oxygen content relative stren solutes with d
fluence of oxygen on the mechanical properties ered-cubic titanium-30 weight percent (17.7 molybdenum-oxygen alloy has been investigated.
f oxygen equivalents, 0.16, 0.81 and 2.07 atom considered in this study. The lattice
hown to increase by 0.0063 A per atom percent ole of oxygen in strengthening these alloys was
hermal in nature over a temperature range of Mechanica scopy, wer on grain s was found Further, 1 te e em ize. for sts, augmented ployed to study Negligible gr the two alloys the dislocation
by transmission the dependence ain boundary having the lowest ensity, at a given n, was also found to be insensitive to grain renamed alloys. On the other hand, the highest
alloy exhibited significant grain boundary The Hall-Petch slope, k, for yielding and up to 10 percent strain were finite and nearly alloy. Further, the dislocation density was a ain size for this alloy. As predicted by a
model for grain boundary strengthening, the islocation density should exhibit parallel
grain size. The dislocation substructure
11 alloys was identical in nature and consisted cations arranged in slip bands. The slip
ers vector were shown in all alloys studied to 1/2 a <111>, respectively. The absence of ain boundary strengthening in the two lower
alloys is rationalized in terms of the gth of the interaction between interstitial islocations and the applied stress. The
interstitial solute-dislocation interaction forms a barrier which reduces the average slip distance, X, of a dislocation. The mechanical properties are controlled by interaction with
this barrier and grain boundaries have minimal influence. The dislocation-interstitial interaction is surmounted at
higher stress levels, as in the highest oxygen content alloy, and the slip distance is then controlled not by the solute separation but by the grain diameter. Mechanical behavior is then controlled by the grain boundary with a resulting dependence of both strength and dislocation density on grain size.
Thesis Supervisor: John F. Breedis
TABLE OF CONTENTS ABSTRACT ... LIST OF FIGURES ... LIST OF TABLES ... ACKNOWLEDGEMENTS ... INTRODUCTION ... LITERATURE REVIEW ...
A. Mechanical Properties of Tit Molybdenum ... B. Deformation of B.C.C. Metals C. Interstitial Strengthening o
Metals ... D. Grain Boundary Strengthening
3 EX A. B. C. D. E. 4 RE A. B. C. D. E. 5 DI A. B. C. D. PERIMENTAL PROCEDURE .. Material Preparation Lattice Constant Dete Mechanical Test Speci Mechanical Tests .... Electron Microscopy . SULTS ...
Lattice Constant Dete Comparison of Tension Tests
Yield Strength Versus Compression Strength Electron Microscopy SCUSSION ... Lattic Compar Tests Yield Grain f B.C.... anium-f B.C. ... ... rmination ... men Preparati ... ... rmination ... and Compress ... Temperature Versus Grain ... e Constant Determination ... ison of Tension and Compress Strength Versus Temperature Size Effects ... Chapter Number 1 2 Page Number 2 6 8 9 10 13 13 15 17 21 29 29 30 32 33 34 38 38 38 40 43 52 61 61 61 62 67
CONCLUSIONS SUGGESTIONS REFERENCES BIOGRAPHICAL Page Number 79 80 81 85 FOR FURTHER WORK
NOTE ... Chapter Number 6 7 . . . . . . . . . . . . . . . o o o e e o o ... ...
LIST OF FIGURES Figure
Number
1 The effect of oxygen on a portion 'of the
percent molybdenum phase diagram ... 2 The effect of oxygen on the titanium-30
weight percent molybdenum lattice constant 3 The effect of temperature on the yield
strength on alloys A, B and C ...
4 Typical true stress-true strain curves for alloys A , B and C ...
5 A plot of the yield strength of the alloys A, B and C, at various temperature versus the oxygen equivalent ...
6 A plot of the yield strength of alloys A, B and C at various temperatures versus the
square root of the oxygen equivalent ... 7 Typical percent grain si 8 The yiel size for 9 The yiel size for 10 The yiel size for 11 Typical alloy A 12 Typical alloy B 13 Typical alloy C 14 The effe density
microstructures of titanium-30 weight molybdenum depicting the range of zes studied. Magnification, 300X ... d and flow stress dependence on grain
alloy A ...
d and flow stress dependence on grain alloy B ...
d and flow stress dependence on grain alloy C ...
dislocation structures observed in at 0.5 strain ...
dislocation structures observed in at 2.0 strain ...
dislocation structures observed in at 4.0 strain ... ct of strain on the dislocation
for alloys A and B ... 15 The effect of strain
density for alloy C
on the dislocation ... Page Number 12 39 41 42 44 45
7
Figure Page
Number Number
16 Flow stress versus the square of dislocation
density for alloy C ... 59 17 Schematic diagram of the effect of an
internal barrier on the grain size versus
LIST OF TABLES
Table Page
Number Number
1 Values of the Strengthening Effect of
Interstitials Aa/Ac, Expressed in Terms of
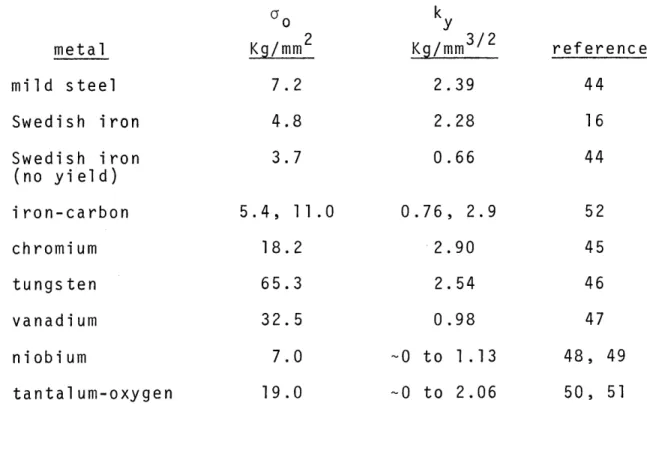
the Metals Shear Modulus, G ... 20 2 Values of oo , the Function Stress and k
-the Hall-Petch Slope for Yielding, for some
B.C.C. Metals ... 28 3 Interstitial Content of the Three
Titanium-30 Weight Percent Molybdenum Alloys ... 30 4 Comparison of Tensile and Compressive Yield
Strengths ... 40 5 Values of k, the Hall-Petch Slope, for
Alloys A, B and C at Various Strains.
Recrystallization Temperature Was 11000C 50 6 Values of k, the Hall-Petch Slope, for
Alloy A at Various Strains.
Recrystalliza-tion Temperature Was 9000C ... 51 7 Dislocation Densities of Alloys A, B and C
at Various Strains ... 58 8 Strengthening, Expressed as A&/Ac, and the
ACKNOWLEDGEMENTS
The author is most grateful to Professor John F. Breedis for his patient guidance throughout this the
completion of this work. He also wishes to thank Professor John Vander Sande and Robin
discussions concerning this In addition, thanks for the several tasks she p electron microscopy sample micrographs necessary for t measurements and the printi
photomicrographs included i Finally, special tha author's wife, Rachel, who
Stevenson for helpful work.
are given to Miss Miriam Yoffa erformed including optical and preparation, printing the many he dislocation density
ng and mounting of the n this work.
nks are in order for the
was willing to endure the life of a graduate student to make this work possible.
This work was sponsored by Air Force Contract
AF-33/615/-3866. The author gratefully acknowledges this financial support throughout this work.
I. INTRODUCTION
Titanium and its alloys have been utilized in high performance applications where a high strength-to-weight ratio and excellent corrosion resistance are important. Much work has been devoted in the past to studying the effects of alloying additions to further improve strength. One of the most successful means of strengthening titanium has been through alloying to suppress the beta-to-alpha
(body-centered cubic to hexagonal-close-packed)
transformation. The b.c.c. phase in pure titanium is less dense than the h.c.p., but the amount of alloying element needed to suppress the beta-to-alpha transformation usually raises the density of the b.c.c. phase above the h.c.p. phase. As a result, the strengthening, when measured in terms of the strength-to-weight ratio, is not as great as when measured in terms of the yield strengths. For
example, for a beta-phase alloy, titanium-3 weight percent aluminum-13 weight percent vanadium-ll weight percent
chromium is 30 percent stronger than commercially pure alpha-phase titanium when measured in terms of yield
strengths but only 24 percent stronger when measured in terms of strength-to-weight ratios.
Molybdenum was the beta stabilizing alloying element chosen in this work because of its potency in solid solution strengthening. The alloy used in this investigation
Another method of solid solution strengthening is by addition of an interstitial solute. The effect of interstitial atoms on body-centered-cubic metals can be particularly marked. Substantial increases in
strength, the development of a yield point and a reduction in ductility are commonly observed as interstitial solutes are added. In titanium containing greater than 20 weight percent molybdenum, it is possible to dissolve one weight percent (3.4 atomic percent) oxygen at 11000C(1). Figure 1 shows the effect of oxygen on titanium-30 molybdenum(l). Oxygen is an alpha stabilizer but the beta-phase can be retained by quenching even with one weight percent oxygen. This is due to the sluggish rate of transformation from beta to alpha. The relatively large solubility of oxygen led to its selection as the interstitial strengthener in this work.
The intent of this research is to investigate the effect of oxygen on the mechanical properties of a
beta-titanium alloy. The effect of oxygen on several parameters were investigated, including the variation of the lattice constant with composition, the yield strength as a function of temperature, and the yield and flow
L
wo 0 -- -- -&o -- -.Ola +
/
0.5
1.0
1.5
Oxygen,
Weight
%
The effect of oxygen on a portion of the titanium-30 weight percent molybdenum phase diagram.
2500
2000
0 0 Q)E
1500
1000
500
FigureII. LITERATURE REVIEW
A. Mechanical Properties of Titanium-Molybdenum
Holden et al.(2) investigated titanium-molybdenum alloys over a range of composition from pure titanium to 24.5 weight percent molybdenum. They found that the yield strength in tension increased in other than a monatomic fashion over this range from 23 Kg/mm2 to 70 Kg/mm2. The yield strength increased over the range 0 to 5 weight
percent molybdenum to 63 Kg/mm2 , then dropped to 32 Kg/mm2 at 8 weight percent, and subsequently rose to its final value of 70 Kg/mm 2 at 24.5 weight percent molybdenum. The
low yield strength in the 8-16 weight percent molybdenum region resulted from the low shear stresses required to
initiate the transformation to martensite. As the
molybdenum content increases, the stress required for this transformation increases to a point where it is greater than the critical shear stress for slip.
Stress-strain curves from the work of Holden et al show no yield drop for the b.c.c. alloys and the 24.5 weight
percent molybdenum alloy exhibited linear work hardening up to fracture which occurred at 10 percent true strain.
Recently, Zeyfang and Conrad(3) investigated a titanium-26.4 weight percent molybdenum alloy with 0.5 atomic percent oxygen equivalent. Oxygen equivalents were calculated by taking nitrogen equals 2 oxygen and carbon equals 3/4 oxygen based on Conrad's earlier work(4).
Adding the nitrogen and carbon equivalents to the oxygen content then yielded an oxygen equivalent. They examined the effects of temperature and strain-rate on the flow behavior. The mechanical behavior of the alloy was
generally similar to other interstitially strengthened b.c.c. metals except for the lack of an initial yield point. The
strong effect of temperature on the yield stress at low temperatures was noted. Stress-strain curves similar to Holden's were also observed. The strain-rate sensitivity of the material was very low, and at 6730K, serrated
yielding was noted.
Using thermal activation analysis, Zeyfang and Conrad concluded that the rate controlling process was one of mobile dislocations overcoming interstitials. The
dislocation-interstitial interaction was consisting of two parts: (1) a chemical titanium-interstitial bonds and (2) an e describing overcoming the interstitial's field. Tyson(5,6) first proposed this c after calculating the interaction energy Cochardt et al.(7) and found the results explain the observed interaction energy. was that the breaking of chemical bonds core may be a significant source of stre
interstitial titanium-oxygen alloys.
described as type of breaking lastic part
elastic stress
hemical contribution using the method of insufficient to
Tyson's conclusion in the dislocation ngthening in
Deformation of B.C.C. Metals
The deformation of b.c.c. metals has been a much-phenomenon. A recent extensive review by
an(8) covers the scope of this area. The object 11 be to review those areas which are pertinent to this work rather than revi
One area of great the dependence of the flow low temperature low temperature resistance, the interstitial so and Gibala(9) h niobium-oxygen strength is due a value for the extrapolation o concentration. Christian(8). obtained by Rav w n s region. The strength is Pe ierls-Nabar lutes is stil ave concluded alloys that a to interstit yield stress f their curve This method Christian poi i and Gibala the enti terest in tress on controve due to an ro force, 1 not ful from the 11 of the ial harde at fo has nts at re field. b.c.c. metals is temperature in the rsy over whether the
intrinsic lattice or to dispersed ly resolved. Ravi ir results on
low temperature ning. They obtained zero oxygen content through r stress versus
been criticized by out that the stress
770 K with their technique is about one-half that obtained by two other independent measurements on presumably interstitial-free crystals. In order to resolve the question of inherent lattice hardening
or interstitial strengthening, purer metals and alloys are needed.
studied Chri sti here wi
B.C.C. metals can
Burgers vector most often observed i However, evidence for some slip on a been reported(10,ll). The densities of dislocations are usually very low from 1/2 a <111> reactions. The plan included {110}, {112}, {123}, as wel The two planes most often observed a For titanium-vanadium alloys contain atom percent vanadium, Paton and Wil plane between (312) and (211) poles.
s 1/2 a <111>. <110> and <100> h of the two latter and thought to res es observed have 1 as irrational pl re the {110} and { ing between 20 and liams(12) noted a
Koul(13) noted s
in titanium-26 weight percent molybdenum on what appeared to be {112} planes.
Like the yield stress, the dislocation structure of b.c.c. metals is dependent on temperature and alloy content. Foxall and Statham(14) made a detailed study of the effect of temperature and molybdenum content on the dislocation structure in niobium single crystals. They found that increasing the yield stress by lowering the
temperature or increasing the molybdenum content (up to 16 atom percent molybdenum) increased the proportion of
observed screw dislocations. The screw dislocations at high yield stresses were straight and very long. As the stress was lowered, the screw dislocations became wavy with more
"debris". Edge dipoles formed at even lower stresses.
Paton and Williams(12) and Gelles(15) studied polycrystalline s types It nes. 12}. 50 lip ip slip on several systems. The
titanium-vanadium dislocation structures. At low temperatures, between 770K and room temperature, both observed screw
dislocations in bands. As the temperature was raised up to 4400K, the screw dislocations became wavy in appearance and the dislocation density decreased for the same level of strain. Koul(13) also observed bands of straight screw
dislocations in titanium-26 weight percent molybdenum strained at room temperature.
Interstitial Strengthening of B.C.C. Metals
One of the most important characteristics of b.c.c. metals is their ability to be substantially strengthened by interstitial solutes. Two types of models have been proposed to explain such strengthening. One type involves a Cottrell
interaction between a dislocation and an interstitial atom (such as the theories of Petch(16,17), Friedel(18,19) and Fleischer(20)) while the other type involves the concept of
Snoek ordering(21) (such as the theory of Schoek and Seeger(22)). The Petch model predicts a linear relationship
between yield stress and interstitial concentration. The linear relationship is, however, only valid for very low concentrations (0.005 - 0.025 weight percent).
The Friedel theory predicts a C1/ 3 relationship with yield stress. This model assumes an elastic interaction even at small separations between interstitial and
dislocation, and assumes isotropic elasticity. calculated is assumed to be that necessary to
The unpin
stress
dislocation from the interstiti Fleischer's model uses interstitial and dislocation ca Cochardt et al(7). This theory
al atoms.
the interaction of
lculations proposed by
is based on short range
interactions between dislocations and the tetragonal strain fields of interstitials. It predicts a temperature
dependent strengthening that is proportional to C1/ 2
According to the Schoek and Seeger theory, large, elastic, long range interactions occur in b.c.c. crystals between dislocations and point defects. These defects characteristically possess asymmetrical strain fields in such metals. This interaction is the same as used by the Fleischer model above and is according to Cochardt et al. Due to these interactions, the interstitials,which are considered as elastic dipoles, become oriented in the energetically most favorable positions relative to the
stress fields of the dislocations. These ordered atmospheres are referred to as Snoek atmospheres and are frozen-in at sufficiently low temperatures, such as room temperature. The stress necessary to drag the dislocations away from
the atmosphere is linearly proportional to the concentration of interstitials and is independent of temperature with this approach.
The data in the literature has not resolved the issue of which theory is correct. Petch's model seems most invalid since in the low concentration regions it predicts a linear dependence whereas C1/2 or C1 / 3 dependences
19
are usually observed. The linear dependence between the solute concentration and yield stress is generally observed when a wide range of interstitial content (up to 1 atom
percent) is investigated. Some systems exhibit different rela-tionships between concentration and yield strength, dependent upon the concentration. The C1/ 2 dependence is observed for
low concentrations while a C dependence is observed for higher concentrations. The data for tantalum-nitrogen(23), tantalum-oxygen(24), oxygen(25,26) and niobium-nitrogen(25) all exhibit this dual dependence. Werts(27) data for carbon in iron shows a C1 / 2 dependence but here the range of carbon concentration is only up to 0.0002 atom fraction. One notable instance of data showing a C1/2
dependence is that of Owen and Roberts(28) where the range of dissolved carbon in martensitic iron-21 percent nickel is up to 0.08 atom fraction. In addition to the tantalum and niobium data mentioned above, the data for carbon and nitrogen combined in iron(30) and oxygen or nitrogen in
vanadium(31) exhibit a linear dependence between strength and interstitial concentration.
Another important point to note is that even though the Cottrell interaction theories are short range in nature and, therefore, subject to thermal activation, a temperature dependent interaction has not been observed in any of the alloys mentioned above. The Schoek and Seeger theory,
however, correctly predicts that the interstitial-dislocation interaction is unaffected by temperature.
The amount of strengthening, measured in terms of the shear modulus, G, appears to be related to whether C
or C1/2 dependence is observed. Values for the strengthening when C and C1 / 2 dependences are observed, are shown below. There is an obvious difference then between the two
dependences.
Tabl Values of the Strengthening
Expressed in Terms of the
concentration dependence C1/2 alloy system Fe-C Nb-N e I
Affect of Interstitials, Aa/AC,
Metals Shear Modulus, G.
strengthening
in terms of the
metal's shear modulus
5 G 2 G Nb-N Nb-O Ta-N Ta-O
The question of the sit solute atom resides has not bee the literature. The interstiti to be in the octahedral site.
the tetrahedral position. In b solutes in either site develop distortion. The tetrahedral si large as the octahedral site.
e in which the interstitial n discussed extensively in al solute is usually assumed The other site available is
.c.c. metals interstitial an asymmetrical lattice te is, however, twice as Expressed in terms of the
lattice constant, a spherical atom whose radius 0.126a can just be accomodated in the tetrahedral site while a smaller
radius of 0.067a will just fit in the octahedral site.
Beshers(29) has questioned the validity of the assumption that the octahedral site is the main occupation site for inter-stitials in some b.c.c. metals. Based on his calculations, Beshers has concluded that while carbon should occupy the
octahedral site in iron, oxygen occupies the tetrahedral
position in tantalum and niobium. Tetrahedral site occupation would produce less lattice distortion and would account for the lower values of strengthening observed in tantalum and niobium strengthened with oxygen versus carbon in iron. It must also be remembered however, that the lattice constants
for niobium and tantalum are larger in comparison with that of iron and that this fact alone could account for the
observed difference in strengthening.
D. Grain-Boundary Strengthening
Since the work of Hall(30) and Petch(31), much work has been undertaken to understand the linear relationship between the stress and the reciprocal square root of the grain size. The form of the equation is:
S= a + kd-1 /2 (1)
with a the yield, flow or fracture stress; oo, a form of friction stress; k, the Hall-Petch slope designated ky, for
yield, kf This area papers(32)
for flow or fracture stress and; d of research has been reviewed in a . Much of this review is based on
the grain size. series of one of those papers (33). The th grain boundari theories, (2) were proposed the lower yiel calculated usi theories, it i size. The Hal One distinctio one predicts a a k value for
respectively. evolved from tl They gave exac
layer, single the tip of the tho cri a, ught tical on a nuc eories exp es fall in non-pile-to account d stress i ng these t s the flow l-Petch sl n between k value f the flow s The origi he work by t solu ended pile-leate tress, ac slocation laining to two up theo for th n ferri heories stress ope for the two or yiel tress, nal pil Eshelb t ca he strengthening tegories: (1) pi effect of le-up
ries. The pile-up theories e grain size dependence of te(32,33). A k value is then
y
For the non-pile-up
that is related to the grain non-pile-up theories is kf. types of theories is that ding while the other predicts i.e., a k and kf value,
e-up theory of Petch(31) y, Frank and Nabarro(34). tions for the stress ahead of a single pile-up of dislocations. The stress at up on one side of a grain boundary was slip in the adjacent grain at some
Eshelby et al. showed that the force, due to a pile-up is given by:
2nA
z
where n is the number a numerical constant
of dislocations which for screw
in the pile-up, A is Gb dislocations = 2 Tr
(G is the shear modulus and b is the Burgers vector), k is the length of the pile-up. At equilibrium;
(atip - a)b = (n - 1)ob (3)
and, therefore,
-tip
= na (4)
Petch used these results and equated atip to c and assumed that the length of the pile-up was equivalent to the grain diameter. Using the fact that n = o / and solving for a with a friction stress, ao , included to account for a resistance to dislocation motion within the grain, results in the Hall-Petch relationship;
a = 0 + V2A c d- 1 2 (5)
Later modifications have been made to include the fact that the pinned dislocation might have a different Burgers vector(35). Another approach has been to consider the pile-up as a continuous distribution of
dislocations(36,37). Other types of pile-ups have also been considered. The main result has been, however, an equation of the form of the Hall-Petch equation with different
numerical parameters included in the calculation of k, the Hall-Petch slope.
One type of non-pile-up theory proposed is based upon a work hardening model(38,39). The hardening
The strength is related to the square root of the dislocation density through the equation;
a = + a Gbp 1 2, (6)
where a is a numerical constant and p is the average dislocation density. This approach predicts that at a
constant stress, all grain sizes will have the same disloca-tion density. This implies that the role of grain boundaries is to change the dislocation density. The dislocation
density is then the controlling factor over the stress
level. This argument is developed as follows: The average slip distance a dislocation moves, X, is proportional to the grain size,
X = d (7)
and the plastic strain is given by,
= pbX (8)
combining equation (7) and (8) yields,
0 + b d (9)
where po is the initial dislocation density. Substituting for p in equation (6) yields;
If the initial density, po << b/id then equation (10) reduces to:
a = + aG - d-1/2 (11)
which is equivalent to equation (1) with
k = aG (b1-)/2 (12)
Another non-pile-up theory was pr.oposed by Li(40). In his approach, grain boundaries are assumed to act as sources of dislocations. The role of the grain boundary is important in this instance since with increasing grain
boundary area, i.e. finer grain size, more dislocations will be emitted and hence the level of stress will be higher. Assuming m is the length of dislocation emitted per unit area of grain boundary, the density of dislocations is, for a spherical grain,
1 2
_ (ird m) 3m
P 3 m (13)
- wd
where all terms have the aforementioned meaning and the factor of 1/2 arises due to the fact that the boundary is shared by two grains. Substituting equation (10) into equation (3) yields,
which is the same as the Hall-Petch relation with a slope,
k = aGb(3m)11/2 (15)
The pile-strengthening is thing, the lack o whereas a Hall-Petch A second point is th Smith(41) found disl without the assistan and Smith found that dislocations were not dislocations can be and at stresses belo of a model based on
induce yielding is o The work har
up model for explaining grain-boundary now questioned as to its validity. For one f observation of pile-ups in pure metals
relation exists is a serious shortcoming. at in iron-3% silicon Worthington and
ocations emitted from grain boundaries ce of pile-ups. In addition, Worthington
the stresses necessary to generate these a function of grain size. If
generated without the aid of a pile-up w
pi f de dependence on a materi whereas not all materi behavior. Another pro
that wher it eas pre thi
the yield stres le-ups generati questionable va ning theory has al which shows als possess thi blem with this cts a strain i stress factor ndependent has been o s, the applicability ng dislocations which lidity.
been criticized for i parabolic hardening s characteristic particular approach is friction stress, o5 bserved to increase in ts
most metals investigated.
The main deterrent to acceptance of the Li theory has been the lack of abundant physical evidence to support it. Only a few instances of grain boundaries acting as sources of dislocations have been noted.
One important fact that average s prior to, their sour replacing the grain defined qu typically proportion nickel (43) each theory lip dis or at y ce to g the sli diamete anti ty. varying al to s showed is obvious then t
with the grain diameter yield strengths than 30
point with respect to this work includes in its development the tance in some form. It
ielding, dislocations h rain boundaries. This p distance with some di r. This average slip d
Kocks(42) states that from 10 to 100p and is tress. Measurements of it to be as small as 6 hat replacement of the
is not
Kg/mm2
is the
is assumed that ave moved from
is the basis for stance related to
istance is not a well it is a quantity inversely
this quantity in 2
p at 30 Kg/mm . It mean slip distance valid for cases
and grain sizes
of higher greater than 6-p.
The value of k, the Ha be a constant in all the above This, however, is not the case values of k are listed below
y
shown, the value for k genera y
For f.c.c. and h.c.p., the val
ll-Petch slope, theories for a for all metals for some b.c.c. lly varies from ues are from 0
would given Typi metals 0 to to 1 an appear to metal. cal . As 3 Kg/mm3 / 2 d 0 to 1.5 Kg/mm3/2, respectively. As shown, the value of k can change for one metal. The variation in the ky value for niobium will be discussed later in the discussion.
Tantalum-oxygen and iron-carbon alloys have a variable k which is dependent upon the heat treatment. Quenching
Table II Values of o , the Friction the Hall-Petch Slope,for Yielding
Stress, and k ,
for Some B.C.C. Metals
metal mild steel Swedish iron Swedish iron (no yield) iron-carbon chromium tungsten vanadium niobium tantal um-oxygen o Kg/mm2 7.2 4.8 3.7 5.4, 18 65 32 7 19 11.0 2 3 5 0 0 k y Kg/mm3 / 2 2.39 2.28 0.66 0.76 2 2 0 0 to 0 to , 2.9 .90 .54 .98 1.13 2.06 reference 44 16 44 52 45 46 47 48, 50,
results in a lower ky compared with samples t quenched from lower temperatures or quenched Formby and Owen(51) rationalized this change formation of atmospheres around dislocations
hat have been and aged. as due to the in the metal.
III. EXPERIMENTAL PROCEDURE
A. Material Preparation
Three alloys of titanium-30 wt. % molybdenum of differing oxygen content were prepared by the Battelle Memorial Institute. Electrolytic grades of titanium and a CMK-WB-2 grade of molybdenum were used in preparing the alloys. A master alloy was made first by a multiple arc-melting technique. The alloy was then homogenized and later diluted with oxygen and titanium to achieve the compositions desired.
The final ingot form was finger shaped having a length of 100 mm. and a diameter of roughly 20 mm. After grinding and/or machining, the alloys were rolled and hot swaged to reduce the diameter approximately 10 mm. The
temperature for these operations was about 10000C. The rods were subsequently machined to 6.3 mm. (0.25 in.) in diameter. Final preparation of the rod was carried out at M.I.T.
Examination of the alloys by optical microscopy revealed they were single phased with a grain size of 501p. Chemical analyses of the alloys studied is shown in Table III. The oxygen content was determined by neutron
activation while the carbon content and nitrogen content were evaluated spectrographically. Oxygen equivalents were
values for the relative strengthening effect of carbon and nitrogen.
Table III
Interstitial Content of the Three
Titanium-30 Weight Percent Molybdenum Alloys
oxygen
oxygen nitrogen carbon equivalent -2 alloy (ppm) (ppm) (ppm) atom fraction x 10
A 344 37 92 0.16
B 1600 252 170 0.81
C 5000 347 170 2.07
B. Lattice Constant Determination
The change in lattice constant of the titanium-30 wt.% molybdenum alloy was measured as a function of oxygen
content. The Debye-Scherrer technique was employed using both powder and solid specimens.
Initial measurements were made from powders. After filing, a magnet was used to separate the iron contamination introduced by the file from the alloy. After passing the filings through a 325 mesh screen, they were wrapped in titanium sheet several mils in thickness. The filings were annealed by encapsulating them in quartz which was
evacuated to 3x10 - 5 torr and back filled with ultra-pure
argon after purging three times. After the heat treatment of 30 minutes at 11000C, the capsules were quenched in cold water. In addition to annealing, the high temperature
treatment served to insure that oxygen was completely in solution.
Solid specimens were used when it was found that oxygen was lost from powders during heat treatment. The solid specimens were prepared from heat treated 63 mm. rods which were then machined to 1 mm. in diameter, taking care
to introduce as little strain as possible. These rods then were electropolished to 0.5 mm. in diameter or less.
Diffraction patterns were obtained using a 114.6 mm. in diameter camera. Both copper and cobalt radiation were employed in each exposure to increase the number of lines obtained. The double exposure introduced the problem of resolving the high angle lines from th
of a copper filter for the copper radi filter for the cobalt radiation result reduction in background intensity whil lines of both radiations. Using this or solid sample yielded as many as 26 32 lines (including doublets).
The lattice constant for each through the use of a computer program( a least-squares technique with correct compensate for: (1) film shrinkage, ( and (3) camera eccentricity. Reproduc
e back ation ed in e stil techni lines spe 54) ion 2) ibi ground. and a n a signi 1 retai que wit of the The use ickel fi cant ning beta h a powder possible
cimen was determined The program used terms included to specimen absorption, lity was
demonstrated both by remeasuring the lines and by several exposures.
C. Mechanical Test Specimen Preparation
Three series of mechanical tests were performed. The specimen for each was prepared in a slightly different manner. Tensile-type specimens were prepared for the
tension versus compression tests while compression specimens were prepared for the tests at various temperatures and of various grain sizes.
The tensile-type specimens were 42 mm. long with a 3.5 mm. diameter. They were machined from the 6.3 mm. in diameter rods. Heat treatment was done for 30 minutes at 11000C in a quartz capsule that had been evacuated to 3x10- 4
torr and backfilled with ultra-pure argon at least three times. The gauge section of the tensile samples was then electropolished in a solution of 150 ml. methanol, 90 ml. n-butyl alcohol, and 15 ml. perchloric acid at less than -400C.
Compression specimens for testing at various temperatures were 6.30 mm. in length and 3.15 mm. in
diameter (height to diameter ratio = 2). The specimen ends were cut perpendicular to the compression axis through the use of a spark cutter. A right angle gauge showed that
less than a degree error was possible when care was exercised. The heat treatment and encapsulation procedure were as
described for the tensile specimens.
Samples of all three alloys were prepared with grain sizes of 5 to 100p, measured using the linear intercept
method. For alloys A and B, the 6.3 mm. in diameter rod was cold swaged to 4.8 mm. in order to introduce cold work.
Samples were recrystallized at 900 and 11000C. Alloy C could
not be cold worked satisfactorily; a reduction of less than 1 percent produced severe cracking. Cold work was introduced into this alloy by compressing 12.5 mm. long and 6.3 mm. in diameter samples to 2/3 of their original height. 950 and 11000C were the recrystallization temperatures used for alloy C. The encapsulation procedure was identical to that described above. Subsequent to recrystallization, the
samples were machined, electropolished and spark cut into samples. A 2 (6.3 mm. height-to-d diameter). Som recrystalli capsule in procedure, sample had aged for 30 the capsule lloys long, iamete and B .15 mm ratio had in of a height-to-diameter ra diameter) while alloy C 1.5 (4.77 mm. long, 3.15
tio o had mm.
e samples of alloys A and C were aged after
zation. Instead of breaking the argon backfilled water after recrystallization as had been the the capsule was immersed in cold water until the cooled to room temperature. The capsule was then
minutes at 4500C. A quench produced by breaking under water followed the aging treatment.
Mechanical Tests
1. Tensile-Compression Test.
These tests were performed in an Instron machine using an apparatus designed to test the sample in tension
or compression. A ball and socket arrangement, designed by Stevenson(55), facilitated alignment so as to prevent
buckling in compression. All tests were performed at a strain rate of 3x10 sec
-2. Compression Testing at Various Temperatures. Compression tests were conducted in an Instron machine at various temperatures. The apparatus has been described previously by Gelles(15). The temperature range was 770K to 5380K. The strain rate was 3x10- 4 sec-1 The temperatures below 2980K were established by immersing the sample and testing rig in a suitable liquid bath;
temperatures above room temperature were achieved through the use of a radiant heater in an enclosed environment.
3. Compression Testing of Various Grain Sizes. A Tinius Olsen machine was used for compressing all the samples of alloys A, B and C recrystallized at 11000C. An Instron machine was used for the alloys A and B which had been recrystallized at 9000C. The strain rate for all
-4 -1
samples was 3x10 sec . Samples were strained various amounts up to 15 percent. Two layers of 0.025 mm. thick teflon were used for lubricating the ends of the specimen. The load was measured on the recorder in each of the
machines.
E. Electron Microscopy
1. Preparation of Thin Foils.
C that were tested as a funct and finest grain size samples 2.0, 4.0, 6.0 and 10.0 were i cut perpendicular to the comp
ion of grain size. The coarsest were used and strains of 0.5, nvestigated. The sections were ression axis.
Thin foils were prepared from these of electropol developed by acid, 20 mil. The solution in the soluti sample at its the tweezers, only the cent solution. Po
blanks by means ishing. The electrolyte used was that
Gelles(15) and is composed of 100 mil. 1 hydroflouric acid, and 10 mil. sulfuric was maintained at 200C. The blanks were on by a pair of tweezers which gripped t
edge. The edge of the foil blanks, as were masked with "Microstop" so as to e er of the top and bottom of both faces t lishing at 5 volts with rapid stirring c
acti aci hel he well as xpose o the lose to these blanks was continued until perforation occurred.
After perforation, the foil was washed in methanol. The lacquer was then stripped from the foil and repeated
washings were done, first in methanol and distilled water
and then in distilled water and "Crystal Kleen". The "Crystal Kleen" was washed from the foil with methanol and the foil was dried. Foils were stored under vacuum in a desiccator.
2. Dislocation Density Measurements.
Dislocation density measurements were made A, B and C recrystallized at 11000C. Pictures wer dislocation structures using a (200) reflection. reflection images all dislocations with 1 a <111>
on all e taken This Burgers oys of
vectors. For each measurement, pictures from at least two foils and from at least two grains in each foil were used. A total of ten pictures for each condition were measured. The technique used was that described by Steeds(56). Ten circles of equal radius were randomly placed on the
pictures. Intersections with the circles were then counted. A total of 100 measurements per condition was recorded. The foil thickness could not be measured directly in this
material, but was estimated from observed transmitted
intensity. All micrographs were taken at approximately the same estimated foil thickness of 2000 A. For the 0.5 percent strains, a magnification of 33,000X was employed while a magnification of 64,000X was used for larger strains.
From the pictures it was obvious that the distribution was non-random and, therefore, the dislocation density is given by NM 3 p = 2tD in cm/cm (16) where p is centimeters dislocation diameter of of the foil the , N and the 3. Slip The slip alloys at various dislocation densi is the number of test line, M is test circle and
ty in centimeters per cubic intersections between
the magnification, D is the t is the assumed thickness
Plane Determination.
plane was determined for both the strains. The technique involved
A and C finding a
major orientation when the foil had zero tilt. The
assumption made then was that the foil area observed had its top and bottom surface perpendicular to the beam. Therefore, any intersection of the slip plane with the surface could be related to the orientation of the foil.
Pictures were taken of dislocations and of the
corresponding diffraction patterns. Since the dislocations occurred in bands, a line drawn through their intersection with the surface defined a line in the slip plane. This line was projected onto the diffraction pattern after
appropriate rotation to account for the difference in
intermediate lens current. The angle between the trace of the slip place and known planes was then measured from the plate. The slip plane was then determined with the aid of a stereographic projection.
4. Burgers Vector Determinati The Burgers vector was determi no-contrast, g-b = 0 criterion. This generally only when working with screw with edge dislocations residual contra Various reflections were used until a image the dislocations. The diffracti bright field images were photographed superimposed. The Burgers vector was respect to the dislocation image.
on.
ned using the
condition is valid dislocations since st may be observed(57).
reflection did not
on patterns and and these were
IV. RESULTS
Lattice Constant Determination
The results are shown in Figure plotted versus the o
of the lattice 2 where values xygen content, constant determi of this constant given in atomic The lattice constant increase is linea
oxygen concentration with a slope of 0 percent oxygen. The lattice constants and 1.74 atomic percent oxygen are the measurements from solid specimens whil determined at near zero oxygen content sample. As described earlier, powder from all three alloys. The lattice co from the powders was approximately the in the figure for zero oxygen content. the center of a large amount of powder a lattice constant of similar magnitud determinations. It was concluded that
r with respect to .006 A per atomic
determined at 0.68 result of
e the constant was from a powder samples were made nstant determined
same value as shown Even sampling from (one gram) produced e to the other powder
the titanium sheet encasing the powder was
sample.
gettering the oxygen from the
Comparison of Tension and Compression Tests
The results of mechanical tests are shown below in Table IV. Normally, the yield strength in tension is the
same as in compression. Within experimental error, the nation
are percent.
1 1.#
-I
-r
3 1.0 2.0 OxygenAtomic %Figure 2: The effect of oxygen on the titanium-30 weight percent molybdenum
lattice constant. 3.255 o,<[ -3. 25C E a_ C-. 3.245 3.24C -F I
40
results here are the same also, except for alloy C, where brittle fracture occurred in tension. The limited tensile elongation in alloy C indicated further testing would
necessarily be done in compression.
Comparison
Table IV
of Tensile and Compression Yield Strengths type of test compression tensile compression tensile compression tensile yield strength 2 0.2% offset Kg/mm 63 70 88 90 114 6 0a
(a) brittle fracture
C. Yield Strength Versus Temperature
Figure 3 shows the yield strength of the three alloys plotted versus testing temperature. All three curves show the same dependence of yield strength on temperature. The three oxygen levels affect only the athermal behavior of alloy. The true stress-true strain curves typical of the three alloys are illustrated in
Figure 4. These curves were drawn from the room temperature test results but represent the character of the curves
obtained throughout the temperature range investigated. No alloy
A
, * 4e , p. 250 300 200- Alloy C E Y E 150 - Alloy B -200 0O Alloy A 100 100 50 -50 100 200 300 400 500 Temperature ,OK
temperature on the yield strength
140 C E E , 120 u, I-100 80 70 0 Figure 4: 5 10 15 True Strain, %
Typical true stress-tru alloys A, B and C.
e strain curves for
200
175
150
125
yield drop was noted for any of the alloys at any temperature and the rate of linear work hardening was the same for all temperatures at 1.4x10- 3 G (68 Kg/mm2 or 9.7x10⁴ Ksi).
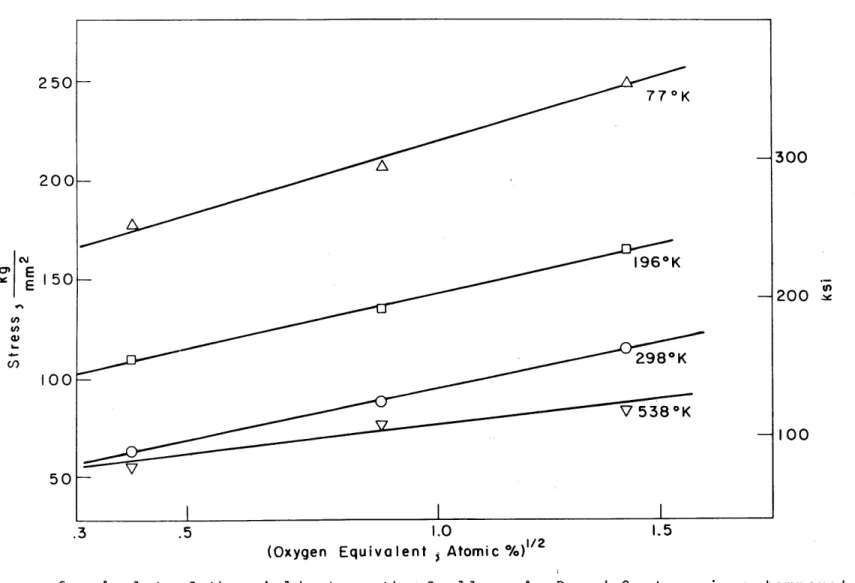
Figures 5 and 6 show the yield strength plotted as functions of oxygen equivalent to the first and one-half power,
respectively. It is obvious one could claim a fit to either composition dependence. At 298 0K, the slope, Au/Ac, is
24 Kg/mm2 per atomic percent oxygen equivalent for Figure 5.
D. Compressive Strength Versus Grain Size
The range of grain sizes investigated is shown in Figure 7 where micrographs of the finest and coarsest grain sizes are shown. The microstructures consisted of equiaxed
grains with average linear intercepts ranging from 7 to 100p.lOO. Initially sections were taken transverse and longitudinally
to determine whether there was a difference in grain shape or size. No difference was found between sections and, as a result, further samples were taken perpendicular to the
compressive axis.
Figures 8, 9 and 10 summarize the results of room temperature tests performed on various grain sizes of alloys A, B and C. These results are from the alloys recrystallized at 11000C. Listed below in Table V are the k (Hall-Petch slope) values calculated from the data. A linear regression
analysis was used for analyzing the data. Two conclusions are immediately obvious: first, there is a large difference in k between alloys A and B and alloy C; second, the k values
* 0 1 A
1.0
Oxygen Equivalent, Atomic %
Figure 5: A plot of the yield strength of the alloys temperature versus the oxygen equivalent.
A, B and C at various 250 200 E Cto (, I, 00 50 -1300 -200 -/ 770K
n--f ... 1960K
o
S298K -O 5380K . . . 2.0 41 j I 1% 0 V 100 50"0 * I , 250 300 200 50 I00o 1.5 1.0
(Oxygen Equivalent , Atomic%) 1/2
50 bm 770K -- 1960K 298*K
I
I
I
100Figure 6: A plot of the yield strength of alloys A, B and C at various versus the square root of the oxygen equivalent.
temperatures cJ E U, U) G) c 200 -*1- 0 V -%
(a) Grain size, 7p.
(b) Grain size, 100p.lOO Figure 7: Typical microstructu
molybdenum-oxygen al grain size studied.
res of the three titanium-loys depicting the range of
Mag'nification, 300X. ~
160 110-S A A 10% Strain 100 -1 0 A 14 0 5% 90 - 0 0 0 80 -7
0
I
I
I
I
I 0 2 4 6 -/2 8 10 12 14 1202 d (m80m) ) ( mm)flow stress dependence on grain size for alloy A. Figure 8: The yield and
A - -A 10% Strain 190 -- 170 u m U5% VV 00 0 -00.2%O 90 2 4 6 8 10 12 14 d - V2 (mm)3
and flow stress dependence on grain
140 130 20 110 N inE E (n Cn, 150 130 I I I .
175 C) 125 100 0 2 4 6 8 10 12 14 -1/2 ,/2 d (mm)
Figure 10: The yield and flow
250
200 t
160
,a a s
Table V
Values of k, the Hall-Petch Slope, for Alloys A, B and C at Various Strains. Recrystallization Temperature was 11000C.
alloy strain k, Kg/mm3/ 2 A 0.2 -a 2.0 0.03 5.0 0.14 10.0 0.13 B 0.2 2.0 5.0 10.0 0.2 2.0 5.0 10.0
(a) Data too scattered for linear analysis.
change in a one alloy is range of gra determinatio differences however, is positive slo size. random probab in size n do no in k's that al pe indi
way with strain. The change in k within ly not statistically meaningful. The
covered and the accuracy of the stress t lend themselves to distinguishing
of 0.03 and 0.41. One important point, 1 the curves for alloys A and B do show cating a small but finite effect of grai
The results been recrystallized
testing samples 900 0C are shown
of alloy A that had in Table VI below.
a n
Table VI
Values of k for Alloy A at Various Strains. Recrystallization Temperature was 9000C.
k strain Kg/mm3 /2 0.2 0.05 2.0 0.01 5.0 0.09 10.0 0.08
Alloy A again showed a small but measurable effect of grain size. A similar trend was noted for samples of alloy B that had been recrystallized at 900 0C. It was therefore concluded that the effect of recrystallization temperature was insignificant.
Aging samples of alloys A and C for 30 minutes at 4500C also had no effect on the relative slopes of these
alloys. The k value for alloy A at 0.2% offset was
3/2 0.0 Kg/mm sizes. The alloy C results yielded a k of 2.3 Kg/mmbased on three tests at each of three grain3 / 2
These values compare favorably with those given in Tables V and VI.
The tests performed at 770K on alloy A also showed little effect of grain size on strength yielding a k value of slightly less than zero at 0.2% offset from limited data. This negative value is deemed not meaningful and is the
Electron Microscopy
1. Dislocation Structure.
Examination of foils from the three alloys revealed that the dislocation structure was
the oxygen content. At low strain of dislocations were noted with th usually quite closely spaced. The depend on the alloy since as shown function of the oxygen content. A micrographs are shown in Figures 1 strain was increased the number of the density within a band did not. percent,foils showed long straight evidence of cell formation. Gener
orientations was visible. dislocations of Us of dis ing <11I
the same irrespective 0.5 percent, a few b e dislocations in them
number of bands did later the density was series of typical 1, 12 and 13. As the
bands increased while At strains of 10 and dislocations with no ally three different locations were observed, rarely
a <200> reflection would image 1> Burgers vectors. of ands a 15 fourth 1
2. Dislocation Density Measurements.
The table below lists the dislocation densities measured for alloys A, B and C at various strains. The dislocation density data is plotted as a function of strain in Figure 14 for alloys A and B, and Figure 15 for alloy C. The accuracy of the measurements was demonstrated by noting the variation in density from foil to foil. The densities at approximately four percent strain varied up to ten percent between foils with most of the variations under five percent.
~1
Figure 11: Two exa at 0.5 oxygen
mples of dislocation percent strain in the alloys.
structures observed
Figure 12: Two examples at 2.0 percen oxygen alloy's.
of dislocation structures observed t strain in the
titanium-molybdenum-Figure 13: Typical dislocation structure observed at 4.0 percent strain in the titanium-molybdenum-oxygen alloys.
I 2 3 4
Strain %
Figure 14: The effect of strain on the dislocation
0 Ir) E c, E 0 0.) 0Cr 0 0 C, 0
for alloys A and B. density
15
o
Alloy C Grain Size
0
a
17
-
2 5
1
o
8 4
-
9 0
1
E
C-E
1O
00o
O0
01
I
I
I
0
1
2
3
4
Strain,
%
58 Table VII
Dislocation Densities of Alloys A, B and C at Various Strains grain size, 7 100 7 101 25 17 22 90 88 84 strain, 0.6 2.0 4.0 0.6 2.2 3.7 2.2 3.8 2.0 4.2 0.9 2.1 3.8 0.8 2.0 3.4 dislocation cm/cm3 x 1.1 6.2 9.6 1.1 5.9 9.7 12.3 13.9 11.6 14.6 1.8 6.4 13.9 0.5 4.8 8.3 density, 10-9
As the amount of strain decr variation increased. At 0.5 from foil-to-foil was as muc for the 2 percent strained s 21 percent from foil-to-foil data for 2 and 4 percent str representing + two standard the figures to note is that density as a function of str size for alloys A and B. Al show a dependence on grain s
eased the foil-to-foil
percent strain, the variation h as 50 to 100 percent while amples the variation averaged
In addition, the alloy C ain is shown with error limits deviations. The first point i there is no difference in ain between 7 and 100p grain loy C on the other hand does ize as well as strain
alloy A
160 140- 120-100 0 200 140
Flow stress versus the square of dislocation density for alloy C.
(1 E E U) U) 5 10 15 (Dislocation Density)/2 x 10- 4 (cm/cm3 )1/2 Figure 16:
for dislocation density. The other point to note is that the density of alloy B is greater than that of alloy C at comparable strains and that at low strains the density of alloy A is greater than either grain size of alloy C.
Figure 16 shows the data for both grain sizes plotted as a function of stress versus the (dislocation density)1 / 2. The equation associated with this type of
plot is: a = 0 + aGbp 1/2 where 0 is termed the friction
stress, a a numerical factor, G the shear modulus and b the Burgers vector. The factor a was found to have a value of 0.57.
3. Slip P Slip plane strains revealed t along which the sl and (110) planes. was perpendicular (110) and yielded (123) plane which was only near the direction again el
lane Determinations.
determinations done on the alloys at all he (211). In at least two cases the line ip plane pole lay intersected both (211)
Using the fact that the <111> direction to the direction always eliminated the the (211) plane 900 from the <111>. The is sometimes observed in b.c.c. metals
trace once and in that case the <111> iminated it.
4. Burgers Vector Determination.
The Burgers vector was assumed to be <111> at the outset. The use of the g.b = 0 criterion proved this assumption to be correct and also showed that the dislocations in the bands were of screw type.
V. DISCUSSION
A. Lattice Constant Determination
The lattice constant increase measured for titanium-30 weight percent molybdenum was 0.0063 A per atom percent
oxygen. This increase is nearly comparable with the value of 0.0045 A per atom percent oxygen found for tantalum(58). The titanium-molybdenum lattice constant increase is of the right magnitude relative to tantalum if one assumes that in both metals the oxygen tetravalent radius is the same and the octahedral position is the site occupied. Further, tantalum has the larger lattice constant and hence would suffer less lattice distortion when oxygen is added. An observed linear increase in the lattice constant shows that oxygen is in solution up to the highest amount studied, approximately 2 atom percent. Further, the solubility of oxygen in titanium-30 molybdenum has been shown to be 3.5 atom percent at 11000C(1), the solution annealing
temperature in this work.
B. Comparison of Tension and Compression Tests
Previous work on martensitic ferrous alloys(59) found that the yield strength measured in compression was
significantly greater than that found in tension. One rationalization of this effect had been in terms of non-linear elastic interactions between dislocations and
involve microstructural of the original aims of
acteristics of martensite. One present work was to investigate the
strength-where the res of residual s typically fou to explain th are: (1) the of martensiti interstitial is much less dislocation i sensitivity o differential e ults would not tresses, micro nd in quenched e absence of a strength-diff c alloys only strengthening than found for nteraction is
f the present
ffect in titanium-molybdenum be complicated by the influence cracks, and retained austenite
martensite. Two possibilities strength-differential (Table IV) erential effect is characteristic or, (2) since the amount of
observed in titanium-molybdenum carbon in iron and the solute-correspond
experiment
ingly was detect this effect. One cannot differenti two possibilities from the results of the investigation.
weaker, the
not sufficient ti ate between these present
C. Yield Strength Versus Temperature
As noted earlier in the literature review, the effect of interstitial solute above a concentration in excess of 500 parts per million is athermal in nature. The observed variation of yield strength with temperature for the three beta phase alloys studied in this work (Figure 3) indicates that the effect of oxygen on titanium-30 molybdenum is indeed athermal in nature. The range of interstitial
content studied included 320 to 5000 ppm. The increase in yield strength with temperature is typical of b.c.c. metals
and is equal in magnitude to the observations of Zeyfang and Conrad for a titanium-26.4 molybdenum alloy containing 0.5 atom percent oxygen equivalent(3).
The general shape of the stress-strain curves shown in Figure 4 is similar to those reported by Pugh for
molybdenum(61), Conrad for titanium-26 molybdenum(3) and other b.c.c. metals. The rate of work hardening for the present alloys is also similar to that found in the
forenamed molybdenum and titanium-26 molybdenum.
One characteristic of flow curves from interstitially strengthened b.c.c. metals lacking in the alloys studied in this work is a yield point. As noted earlier, even aging treatments failed to produce a noticeable yield point in both alloys A and C. A theory for the yield point was developed by Hahn(62) utilizing the dislocation dynamics of Johnston and Gilman(63). According to this approach, the dislocation velocity is stress dependent or,
v = ( ) m (16)
where v is the dislocation velocity, a is the applied stress, a is the stress for unit dislocation velocity, and m is a
numerical constant. The value of m must be small for a large yield drop to be observed. Values of m over 100 result in imperceptible yield drops. Iron, on the other hand, has an m-value of 35 and exhibits a yield point. An even greater yield point is shown by lithium fluoride where the value of
this exponent is 16.5. Another criterion for the occurrence of a yield point is a low initial mobile dislocation density.
In interstitially strengthened b.c.c. metals, this
requirement is easily satisfied when the interstitials form anchoring atmospheres around grown-in dislocations to lower the initial mobile dislocation density. Formby and Owen(51) showed that for tantalum-oxygen, the yield point could be eliminated by quenching from a temperature where interstitial atoms presumably did not form atmospheres around dislocations. Two possibilities exist for the lack of a yield point in
b.c.c. titanium-molybdenum: (1) the dislocation velocity is very stress dependent (a high m value) and (2), dissolved oxygen is randomly distributed in the lattice and not at dislocations. The first possibility is unlikely since there is no reason to expect that titanium-molybdenum is an
anomaly among b.c.c. metals. The second possibility means that strong binding exists between oxygen and titanium and/or molybdenum atoms, and that such binding forces are greater than those between oxygen and dislocations and other oxygen atoms. The fact that an ageing treatment could not induce a yield point supports the later proposal. Thus, it appears
that the initial mobile density is high since the grown-in dislocations are not effectively pinned.
Data depicting the strengthening effect of oxygen in Figures 5 and 6 leave unanswered the question of a linear or square root dependence of strength upon oxygen