HAL Id: hal-03119661
https://hal.archives-ouvertes.fr/hal-03119661
Submitted on 25 Jan 2021
HAL is a multi-disciplinary open access
archive for the deposit and dissemination of
sci-entific research documents, whether they are
pub-lished or not. The documents may come from
teaching and research institutions in France or
abroad, or from public or private research centers.
L’archive ouverte pluridisciplinaire HAL, est
destinée au dépôt et à la diffusion de documents
scientifiques de niveau recherche, publiés ou non,
émanant des établissements d’enseignement et de
recherche français ou étrangers, des laboratoires
publics ou privés.
Effects of black carbon content, particle size, and mixing
on light absorption by aerosols from biomass burning in
Brazil
J. Vanderlei Martins, Paulo Artaxo, Catherine Liousse, Jeffrey Reid, Peter
Hobbs, Yoram Kaufman
To cite this version:
J. Vanderlei Martins, Paulo Artaxo, Catherine Liousse, Jeffrey Reid, Peter Hobbs, et al.. Effects of
black carbon content, particle size, and mixing on light absorption by aerosols from biomass burning
in Brazil. Journal of Geophysical Research: Atmospheres, American Geophysical Union, 1998, 103
(D24), pp.32041-32050. �10.1029/98JD02593�. �hal-03119661�
JOURNAL OF GEOPHYSICAL RESEARCH, VOL. 103, NO. D4, PAGES 32,041-32,050, DECEMBER 27, 1998
Effects of black carbon content, particle size, and mixing
on light absorption by aerosols from biomass burning in Brazil
J. Vanderlei Martins, •,2,3
Paulo Artaxo, • Catherine Liousse,
4 Jeffrey S. Reid, 2
Peter V. Hobbs, 2 and Yoram J. Kaufman 3
Abstract. Black carbon mass absorption efficiencies of smoke particles were measured
for various types of biomass fires during the Smoke, Clouds, and Radiation-Brazil
(SCAR-B) experiment using thermal evolution measurements for black carbon and optical
absorption
methods.
The obtained
results
range
between
5.2 and 19.3 m 2 g-1 with an
average
value
of 12.1 + 4.0 m
2 g-1. Particle
size
distributions
and optical
properties
were
also measured to provide a full set of physical parameters for modeling calculations. Mie
theory was used to model the optical properties of the particles assuming both internal
and external mixtures coupling the modeling calculations with the experimental results
obtained during the campaign. For internal mixing, a particle model with a layered
structure consisting of an absorbing black carbon core, surrounded by a nonabsorbing
shell, was assumed. Also, for internal mixing, a discrete dipole approximation code was
used to simulate packed soot clusters commonly found in electron microscopy
photographs of filters collected during the experiment. The modeled results for layered
spheres and packed clusters explain black carbon mass absorption coefficients up to values
of about
25 m 2 g-l, but measurements
show
even
higher
values
which
were correlated
with the chemical composition and characteristics of the structure of the particles.
Unrealistic high values of black carbon absorption efficiencies were linked to high
concentrations of K, which influence the volatilization of black carbon (BC) at lower
temperatures than usual, possibly causing artifacts in the determination of BC by thermal
technique. The modeling results are compared with nephelometer and light absorption
measurements.
1. Introduction
Light absorption by aerosol particles has a heating effect in
the atmosphere, which contrasts with the cooling effect by
nonabsorptive particles. The balance between the cooling and
the heating effects depends on the absorption and scattering
properties of the particles. Smoke particles produced by bio-
mass burning have a significant fraction of light-absorbing ma-
terial composed by black carbon particles. Black carbon is the
only important absorber to be taken into account in radiative
transfer calculations of smoke aerosols. The same amount of
BC for different types of mixing may result in fairly different absorption properties. The efficiency with which a certain
amount of BC will absorb light is expressed by a BC mass
absorption efficiency (OZaBC). This coefficient relates the
amount of BC in the particle with the light absorption cross
section and depends on the size of particles and on the type of
mixing between BC and nonabsorbing components (such as
organic matter and sulfates). In external mixtures consisting of
individual pure BC particles in parallel with nonabsorbing par-
ticles, the BC mass absorption efficiency is, in general, about
•Instituto de Ffsica, Universidade de S•o Paulo, S•o Paulo, Brazil.
2Department of Atmospheric Sciences, University of Washington,
Seattle.
3NASA Goddard Space Flight Center, Greenbelt, Maryland.
4Centre de Faibles Radioactivites, CNRS-CEA, Gif sur Yvette,
France.
Copyright 1998 by the American Geophysical Union. Paper number 98JD02593.
0148-0227/98/98 JD-02593509.00
the same as for pure BC particles. However, for smoke aerosol,
it is likely that BC particles that form at relatively high tem-
peratures will be coated by a nonabsorbing shell (to form an
internal mixture). The external shell is likely formed by gas- to-particle conversion and condensation of volatile com-
pounds. Thus a reasonable model for biomass burning parti-
cles is a layered sphere, with a highly absorbing BC core
surrounded by a nonabsorbing shell.
Ackerman and Toon [1981] explored the optical properties of internal and external mixtures using the layered-sphere
model and volume-homogeneous mixtures, where the absorb-
ing material is homogeneously mixed with nonabsorbing com-
pounds. Another type of internal mixture commonly found in
smoke aerosols are long-chain aggregates of BC particles formed at high temperatures close to the fire. These chain
aggregates can also be coated with nonabsorbing materials to
form an internally mixed heterogeneous structure. After aging
and interactions with water vapor and clouds, these opened
clusters usually collapse to form closely packed spherical-like
structures [Hallet et al., 1989]. These packed structures are
likely to be externally coated and also have nonabsorbing ma-
terial in its internal structure. Figure 1 shows examples of some
possible internal and external mixtures of BC particles and
nonabsorbing materials in smoke from biomass fires.
In the present study, we use Mie theory to estimate the mass
absorption efficiency of BC particles internally and externally
mixed with nonabsorbing materials. Calculations for particles
with a layered structure were performed using a Mie code
developed by/lckerman and Toon [1981], as further developed
and made available by W. Wiscombe. Closely packed BC clus-
32,042 MARTINS ET AL.: LIGHT ABSORPTION BY BC PARTICLES
Internal mixing with layered structure:
External mixing:
Black carbon
Non-absorbing
shell
)•//U
• (organics,
Black carbonsulfates,
coreetc.)
O
Non-absorbingO O
particlesInternal mixing in soot aggregates
Open soot cluster Closed soot cluster
Figure 1. Examples of some possible mixtures between black
carbon (BC) and nonabsorbing materials in smoke particles.
ters were simulated by a three-dimensional mathematical structure with thousands of dipoles, the optical properties of
which were calculated using the discrete dipole approximation
[Draine and Flatau, 1994; Purcell and Pennypacker, 1973]. Di-
pole calculations were performed using the code DDSCAT,
made available by B. Draine and P. Flatau. Results from closed clusters are compared with those from the layered-sphere model and with the Maxwell-Garnett average field theory for
homogeneous internally mixed materials [Bohren and Huff-
man, 1983]. The modeling results are compared with measure- ments of BC mass absorption efficiency obtained during the SCAR-B field project in Brazil.
2. Theoretical Modeling
The mass absorption efficiency of an aerosol particle (aa) is
defined
as the absorption
coefficient
of the particles
(m -•)
divided
by the particle
mass
concentration
(g m-3). Similarly,
the BC mass absorption efficiency (aaBc) is defined as the absorption coefficient of the particles (m -l) divided by the
mass
concentration
of black
carbon
(g m--•) in the aerosol.
The
BC mass absorption efficiency indicates how efficiently acer-
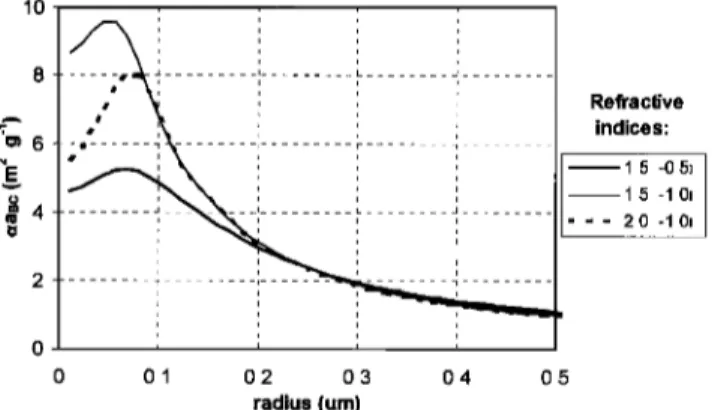
10 Refractive indices: 1.5 -0.5i 1.5 -1.0• 2.0 -10i 0 0.1 0.2 0.3 0.4 0.5 radius (um)
Figure 2. Calculated values of black carbon mass absorption efficiency (aaBc) for pure BC spherical particles (density
1.85 g cm
-3) at a wavelength
of 0.55 /•m. Three complex
refractive indices (n), spanning values commonly found in the
literature, were used in these calculations (n = 1.5-0.5i, n -
1.5-1.0i, and n = 2.0-1.0i).
tain amount of BC absorbs light for different types of particle
mixing and sizes. Figure 2 shows Mie calculations of the BC
mass absorption efficiency for pure BC spheres (at ,k = 0.55 tzm) as a function of the particle radius. The BC mass absorp-
tion efficiency
for pure BC particles
(9 = 1.85
g cm
-3) remains
below 10 m 2 g- ], regardless of particle size and for three values of the complex refractive index covering the range commonly
found in the literature [Horvath, 1993a]. Calculations of the BC
mass absorption efficiencies over a realistic accumulation
mode biomass burning particle size distribution [e.g., Reid et
al., this issue (b)] produces values much lower than 10 m 2 g-•
Internally mixed particles composed of an absorbing core sur-
rounded by a nonabsorbing shell have, in general, a greater BC
mass absorption efficiency than pure BC particles. This is be-
cause the nonabsorbing shell increases the total cross-sectional
area of the particle and focuses light toward the absorbing
core, causing the same amount of BC in the mixed structure to absorb more than pure BC particles.
Figure 3 shows calculated BC mass absorption efficiency for
particles with a BC core surrounded by a nonabsorbing shell.
Along the text, shell radius is defined as equal to the particle radius. It can be seen that for particles with a layered structure the value of aaBc depends on the fraction of BC in each particle and on the size of the particles, but it can be much larger than that for pure BC particles. For the studied param-
eters, the larger the particle radius the larger the effect of the
nonabsorbing coating in aaBo up to a maximum aaBc value
for a particle radius of about 0.25 /zm. For a BC fraction of
0.5%, and monodispersed particles with an external radius of
0.25 /zm, aaBc can reach values as high as 30 m 2 g-•. The
different behavior as a function of the shell radius can be
explained by the relative size of the BC core, which is deter- mined by the fraction BC/TPM (black carbon divided by total particle mass), the external particle radius, and the density of each component. The shell radius is also important in deter- mining the value of the mass absorption coefficient. For a
particle radius about 0.05 /zm, the BC mass absorotion effi-
25 •15 10 0 0.1 0.2 0.3 0.4 0 5 Shell radius (•m) Percentage of BC ... 0.5% • 1% ... 2_% -- 5% • 20% 75%
Figure 3. Calculated values of black carbon mass absorption
efficiency (c•a ]•c) at ,k = 0.55/•m for an internal mixture of BC
and nonabsorbing material in a layered structure. The particle
structure consists of an absorbing BC core with a surrounding nonabsorbing shell. The refractive index of the BC was as-
sumed to be 2.0-1.0i, the density 1.85 g cm-3; for the non-
absorbing shell, the refractive index was assumed to be 1.5- 10-6i and the density 1.5 g cm -3. The amount of BC and the
radius of the shell determine the radius of the BC core. The
radius of the shell is defined in this work as equal to the radius
MARTINS ET AL.: LIGHT ABSORPTION BY BC PARTICLES 32,043 30 - •E 20 10 -
i
,
0.2 0.4 0.6 0.8 wavelength (p rn) Shell radius (tam) ... 0.5O -- 0.35 -- -- - O.25 0.15 0.10 0.05Figure 4. Calculated values of black carbon mass absorption
efficiency (aa Be) as a function of the wavelength for several
particle radii based on Mie calculations for the layered-sphere
model. Particle structure is an absorbing BC core (5% in mass)
and a nonabsorbing external shell. Optical parameters are the same as for Figure 3.
ciency is around 10 m 2 g-1 and is almost independent of the ratio BC/TPM. Several authors obtained values around 10 m 2 g-• for •a [•c of aerosol particles [Clarke et al., 1987; Japar et
al., 1986; Roessler a•d Faxvog, 1980]. The value of •a [•c is also
dependent on the real part of the refractive index of the non-
absorbing shell. For a range of real refractive indices around
values reported in the literature for organic materials and sulfatc, higher refractive indices will produce higher values of •a m-(at/X = 0.55 /•m).
Spectral measurements of light absorption associated with
measurements of the particle size distributions can be useful in
determining the type of mixing between BC and nonabsorbing particlcs. The wavelength dependence of the light absorption
depends on the sizes of the absorbing particles. Figure 4 shows
an example of the spectral dependence of the BC mass absorp-
tion efficiency for several particle sizes based on the layered-
sphere model with an absorbing core and a nonabsorbing shell
with 5% BC in mass. The results show that smaller particles (0.05 to 0.15 /•m) have stronger wavelength dependence for
light absorption than larger particles. This suggests that spec-
tral measurements of light absorption by aerosol particles can
provide information on the type of mixing and on the size of
the absorbers.
Other factors, such as the shape and structure of the parti-
cles, can affect the BC mass absorption efficiency. Black car- bon is commonly found in large chain aggregates close to the
fires. The optical properties of these fresh aggregates have been estimated to be equivalent to individual pure BC parti-
cles. These aggregates can also have a nonabsorbing external layer, and after interacting with water vapor and clouds, they
can collapse to form more closely packed structures [Hallet et
al., 1989]. Scanning electron microscopy (SEM) photographs
show that in some cases, most of the particles in regional hazes in Brazil are composed of compact closed clusters, with the particle radius varying over the whole size distribution [Martins et al., this issue]. These closed structures have different optical properties from the initial fresh chain aggregates. Depending
on size ranges and structures, the BC mass absorption effi-
ciency for these packed clusters with a nonabsorbing layer will be larger than those of pure BC particles.
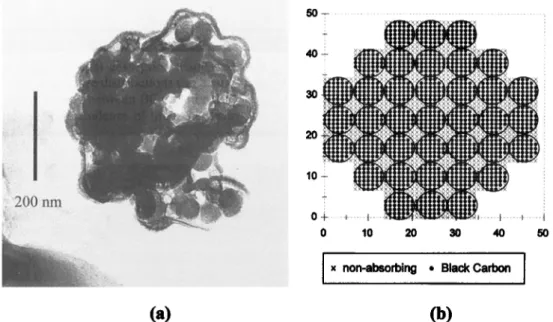
Figure 5a shows a transmission electron microscope (TEM)
photograph of a smoke particle composed of a closed cluster
aggregate and, apparently, a coating of lower density material. Figure 5b illustrates the mathematical model we used to cal- culate the optical properties of such closed clusters using the
discrete dipole approximation code (DDSCAT). Each dot in
Figure 5b represents a single dipole, with different symbols for
x non-absorbing * Black Carbon
(a)
(b)
Figure 5. (a) Transmission electron microscopy photograph of a closely packed BC cluster from biomass
burning. ]'he structure shows evidences of a particle coating with a different material from that of the isolated
spheres. Photograph courtesy of F. Echalar, Institute of Physics, University of S•o Paulo. (b) Three-
dimensional mathematical structure used for simulating internal mixtures of a closely packed cluster using the
discrete dipole approximation. Each dot in the figure represents a single dipole; the large circles composed of
32,044 MARTINS ET AL.: LIGHT ABSORPTION BY BC PARTICLES
BC and nonabsorbing materials. The black dots represent di-
poles with the dielectric properties of BC, the x symbols are
dipoles with dielectric properties of nonabsorbing materials. A
complex refractive index of 2.0-1.0i was assumed for BC and
1.5-1.0 x 10⁻⁶i for nonabsorbing particles, with densities of 1.85 and 1.5 g cm -3, respectively. The modeled structure is three dimensional with BC particles in touch with each other
and all the free spaces filled with nonabsorbing material. This
mixture results in a volume ratio ([7BC/[7tot) of 0.52, which
means that BC corresponds to 64% of the particle mass. It is
important to recall that even if the bulk BC/TPM fraction in
aerosols are of the order of 5-15 %, isolated particles may have
a higher BC fraction depending on the particular mixture for
each case (e.g., Figure 5a: particle is likely composed predom-
inantly by BC). The BC mass absorption efficiency (aa BC) for
this structure was calculated using the DDSCAT code.
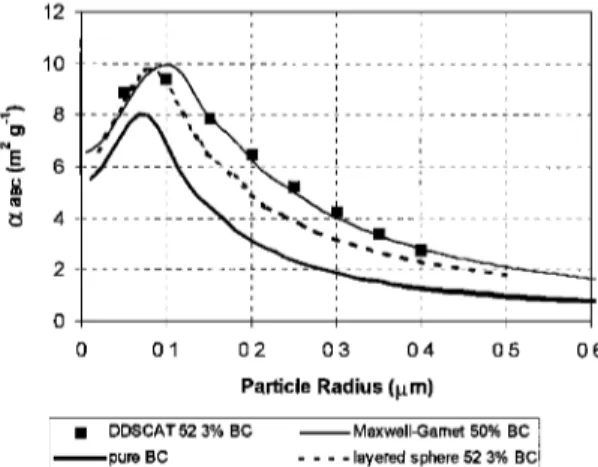
Figure 6 compares results from the packed cluster structure
with aaBc for pure BC particles and for the layered-sphere model. For all particle radius, aaBc for the closed cluster is
larger
than for pure BC particles,
with a peak of 10 m: g-• at
a particle radius about 0.1 rim for the given BC/TPM ratio. The closed cluster also showed aa BC values up to 35% higher than results for the layered sphere model for particle radius larger than 0.1 rim. Moreover, also in Figure 6 these results are compared with results from the Maxwell-Garnett mean field
theory. In this theory, one determines average dielectric func-
tions for the composed material, which are then used in a Mie
code for estimating optical properties. The mixing rule used for
this calculation considers a two component mixture with a
nonabsorbing matrix containing spherical absorbing inclusions
pondered by volume. The Maxwell-Garnet theory and the mix-
ing rule used in this work is described in details by Bohren and
Huffman [1983]. Despite problems in determining average ef- fective refractive indices for mixed materials, we present an
intercomparison of the DDSCAT results and the mean field
theory as an example of a simple model for a complex struc- ture. Good agreement was found between the DDSCAT re-
sults and the Maxwell-Garnet theory combine_d with Mie cal-
culations in estimating aaBc over a large range of particle sizes. There was also good agreement for the particle mass scattering coefficient, although this does not assure that the mean field theory will reproduce all the optical properties of
closed clusters at any wavelength, mixing ratio, or particle size.
By analogy with the layered-sphere model, a smaller mixing
ratio will provide a large aa BC value. Extrapolations using the
mean field theory suggest that these packed clusters should not
reach aa BC values larger than 20 m 2 g-l for realistic particle sizes and mixing ratios. Therefore the obtained results are in the same range as those obtained with the layered-sphere
model.
3. Measurements
3.1. Techniques
Black carbon mass absorption efficiencies for aerosol parti-
cles were obtained for all samples collected simultaneously in
Nuclepore and Quartz filters during the Smoke, Clouds, and Radiation-Brazil (SCAR-B) experiment. The determination
of ozaBc depends on measurements of the absorption coeffi-
cient and BC mass concentration. Measurements of light ab-
sorption by aerosols have been discussed by many authors [e.g.,
Horvath, 1993a, b; Clarke, 1982a, b; Clarke et al., 1987, 1996; Campbell et al., 1995; Campbell and Cahill, 1996; Hanel et al.,
12 10 d 4 2 0 0.1 0.2 0.3 0 4 0.5 0 6 Particle Radius (gm)
ß DDSCAT
52.3%
BC
Maxwell-Garnet
50%
BC
l pure BC .... ayered sphere 52 3% BC
Figure 6. Calculated values of black carbon mass absorption
efficiency for a BC cluster (at ,k = 0.55 rim) with a nonabsorb-
ing coating around individual particles versus the particle ra-
dius using the discrete dipole approximation (DDSCAT). Re-
sults from DDSSCAT are compared with pure BC particles
(solid curve), layered-sphere model, and calculations using the
Maxwell-Garnett theory considering a volume ratio of about
52 or 64% in mass.
1982; Delumyea et al., 1980]. Most of the methods applied on filters produce artifacts that depend on particle loading, type of filter, and type of particles but, on the other hand, have the
advantage of concentrating the particles in a small volume for
further analysis. The aethalometer technique combines auto-
mated optical attenuation measurements in filters with good
time resolution depending on mass concentrations [Hansen et
al., 1982; Ruoss et al., 1993]. Light absorption techniques re-
quire empirical calibrations and intercomparisons with differ-
ent methods for quality assurance. During SCAR-B, light ab-
sorption was measured simultaneously by several techniques
(optical extinction cell, integrating plate technique on Teflon filters, optical reflectance on Nuclepore filters, and absorption
photometry or aethalometer technique) aboard the University
of Washington (UW) C131-A aircraft; Reid et al. [this issue (a)]
present an intercomparison of these techniques for the
SCAR-B data set, considering a combination of the UW ex- tinction cell plus a nephelometer as a reference methodology
[Weiss and Hobbs, 1992]. Reid et al. [this issue (a)] concluded
that for the various techniques used on the C-131A, optical
reflectance (OR) provided the best correlation (r = 0.9) with
light absorption measurements from the Weiss-Hobbs optical
extinction cell (OEC) over several orders of magnitude. Re- flectance techniques have been applied by other authors to obtain optical properties of aerosol particles [Lindberg and
Laude, 1977; Patterson and Marshall, 1982]. Hanel [1988] dis-
cusses a photometric methodology for measuring light absorp-
tion by aerosol particles and concludes that its results are equivalent to a diffuse reflectance technique and to calorimet-
ric measurements [Hanel and Hillenbrand, 1989].
Particulate carbon concentrations in the aerosol were deter-
mined by thermal analysis [Cachier et al., 1989] of quartz filters
at the Centre de Faibles Radioactivites, CNRS-CEA, Gif sur
Ivette, France. The exposed filters were subjected to HC1 va-
pors for 24 hours in order to remove carbonates. The carbon
remaining on the filters after this treatment is referred to as total atmospheric particulate carbon (TC). Both total and
MARTINS ET AL.: LIGHT ABSORPTION BY BC PARTICLES 32,045
by coulometric titration with a Str6hlein Coulomat©702C. The
black carbon fraction (BCTh) is analyzed after the thermal
removal of the organic compounds at 340øC during 120 min
under pure oxygen. OC is assumed to be the difference be-
tween TC and BC. It must be recalled, however, that the BC
and OC separation is method dependent [Reid et al., this issue
(a); Petzold and Niessner, 1995]. The published uncertainty in
the BC content is of the order of 10% when BC/TC ratio is in
the 10-35% range, which corresponds to 70% of samples for
the SCAR-B campaign. It must be noted that following Reid et
al. [this issue (a)] and for the SCAR-B data set, BC concen-
trations could be increased by 25%, due to thermal method
sensitivity to catalytic reactions with K and Na [Novakov and
Corrigan, 1995]. The Nuclepore, Quartz, and Teflon filters
were collected in parallel in a grab-bag sampling system aboard
the UW C131-A aircraft using the same inlet. Therefore be- cause of sampling similarity with the quartz filters and good
correlation with the OEC results (r = 0.9), absorption mea-
surements from Nuclepore filters were considered in this work
to calculate the absorption coefficients.
Several other aerosol properties were measured simulta-
neously, including particle size distributions, light scattering,
and humidification factors [Hobbs, 1996; Reid et al., this issue
(b); Reid and Hobbs, this issue]. Samples were collected in different conditions and environments, including smoke
plumes, regional hazes, background air, and clouds. Nuclepore
filters were also subjected to PIXE (proton-induced X-ray
emission), SEM (scanning electron microscopy), and gravimet-
ric analysis. The Teflon filters were analyzed gravimetrically
and by ion chromatography. The elemental and ionic compo-
sitions provided information on the dependence of qaBc on the chemical composition of the particle, and the electron microscopy results provided information on the micromor- phology and structure of the particles.
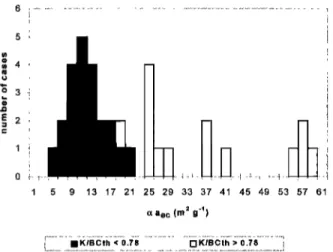
3.2. Results
Figure 7 shows a histogram of the measured BC mass ab- sorption efficiencies for all the Nuclepore filters collected in parallel with quartz filters. The distribution of BC mass ab-
13 t7 2t 25 29 33 37 4t 45 49 53 57 61
q,a•c (m = g"•)
Figure 7. Histogram of measured BC mass absorption effi- ciencies obtained during SCAR-B. Results are separated in two groups with K/BCTh < 0.78 and K/BCTh > 0.78. As dis-
cussed in the text, estimates of c•a uc were obtained based on
the group with K/BCTh < 0.78 producing an average c•a uc = 12.1 _+ 4.0 m 2 g-i.
sorption efficiencies shows c•aBc values between 5.2 and 58.2
m 2 g-• separated
in two groups
with distinct
chemical
signa-
tures. The first group has a K/BCTh ratio smaller than 0.78 and
c•anc values between 5.2 and 19.3 m 2 g-J, with an average
value of 12.1 _+ 4.0 m 2 g-•. The second group for K/BCTh
larger than 0.78 shows very scattered results for c•anc with values between 18.0 and 58.2 m 2 g-• and an average value of 37 _+ 14 m 2 g-•. This separation is strongly observed in the
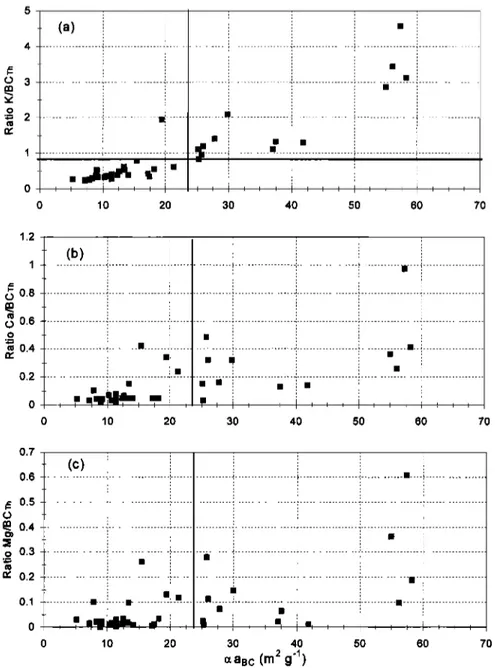
relationship of c•a uc and the concentrations of K, Ca, and Mg
for each sample, as it can be seen in Figures 8a-8c. High values of c•a nc correlate well with high K, Ca, and Mg concentrations. According to Novakov and Corrigan [1995], K has a catalytic effect on BC, lowering its volatilization temperature and caus-
ing artifacts on BC measurements obtained by thermal evolu-
tion techniques. This effect can explain the separation of c•a nc
in two different groups and suggests an upper limit value of
K/BCTh -- 0.78, under which BCTh presented reasonable val-
ues. The authors also suggest a similar effect associated with
Na, but we did not find any association between the ratio
Na/BCTh and c•aBc. Thus samples with K/BCTh < 0.78 were selected for the measurement of c•anc in this data set. This
procedure needs to be studied and generalized for other data
sets, suggesting a quality assurance protocol for thermal BC
data.
The K/BCTh = 0.78 upper limit is also in accordance with
the optical modeling calculations presented in section 2. As
showed in Figure 3, the maximum value for a monodispersed particle size distribution using the layered-sphere model is
about 30 m 2 g-• Integrating over a realistic accumulation-
mode size distribution for biomass burning particles [e.g., Reid
et al., this issue (b)], this value reaches a maximum of about 25
m 2 g i. Similar values were found for a packed cluster of BC
particles embedded in a nonabsorbing matrix. Also, c•a uc val-
ues commonly reported in the literature are generally below 25 m 2 g-l [e.g., Liousse et al., 1993; Horvath, 1993a; Roessler and
Faxvog, 1980]. However, Chylek et al. [1995] discuss the possi-
bility of BC mass absorption efficiency reaching values up to 100 m 2 g-• in special circumstances (e.g., water droplets with a small BC core out of center).
Using the layered-sphere model described in section 2, the
optical properties of the aerosol particles were estimated on
the basis of the parameters measured on the UW C131-A aircraft, namely, simultaneous measurements of light absorp-
tion and mass concentrations (Nuclepore and Teflon filters),
BCTh (quartz filters), particle size distribution with a passive
cavity aerosol spectrometer probe (PCASP) and a differential
mobility particle sizer (DMPS), and total light scattering and
backscattering at three wavelengths. The PCASP measures particles with diameter between 0.1 and 3.0 /•m, while the DMPS measures particles diameter in the range of 0.01-0.6
/•m. Five cases were modeled assuming a constant fraction of
BC for all the particles in the size distribution. For the BC core, a complex refractive index of 2.0-1.0i at 0.55 /•m was assumed, with a density of 1.85 gcm -3. Particle size distribu- tions were considered to be lognormal. Figure 9 shows a com-
parison between the measured values of c•a uc versus the rel- ative amount of thermal BC in each sample separating cases with K/BCTh < 0.78. Calculated results using the layered- sphere model with three measured particle size distributions
are superimposed on the experimental values, as well as the
asymptotic c•a uc value for pure BC particles with similar par-
ticle size distributions. In this case, the c•auc values for pure BC particles represent external mixing between BC and non-
32,046 MARTINS ET AL.: LIGHT ABSORPTION BY BC PARTICLES 0 10 20 30 40 50 60 70 1.2 0.8 0.6 0.4 0.2 0.7 0.6 ,- 0.5 • 0.4 o 0.3 ... ' it: 0.2 o.1 ... m--:- ß ... : m I 0 10 20 30 40 50 60 70
(xasc
(m
2 g-l)
Figure 8. Ratios (a) K/BGrh, (b) Ca/BCTh, and (c) Mg/BCTh versus oza Bc for all the analyzed samples. The
upper limit K/BCrh = 0.78 is pointed in the figure showing the separation for reliable aaBc values.
absorbing particles. The modeled results can account for aa Bc
values between 5 and 25 m: g-l, which explains about 70% of the data set and all aanc values for K/BCTh < 0.78. Table 1
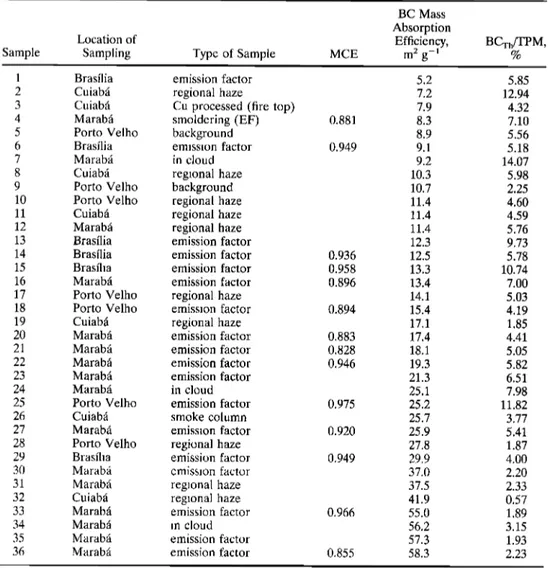
shows general characteristics of the studied samples. There is
no clear correlation between aanc and location, type of com-
bustion, or type of sample. On the other hand, SEM pictures of
the samples also suggest a separation in two groups of particles
with distinct micromorphology. The first group, which has low
aa Bc values, has spherical-like shape and relatively homoge-
neous particles (Figure 10a). The second group, which has high
aa nc values, shows a large concentration of nonspherical par-
ticles and compact clusters of small particles (Figure 10b), similar to the one shown in Figure 5.
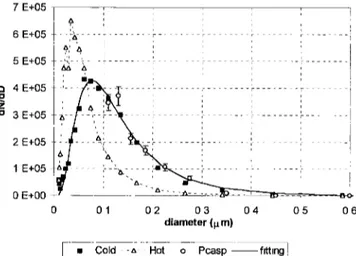
Figure 11 shows an example of the particle size distribution,
and the DMPS "hot" size distribution, which corresponds to
the size distribution of the same sample after heating the
aerosol to 340øC (which causes most volatile compounds to
evaporate; for example, organics, ammonium sulfate, etc.).
The comparison between the "hot" and the "cold" size distri-
butions suggested a predominance of internal mixing between
volatile and nonvolatile particles. Despite the large difference
in the size distributions for the "hot" and "cold" samples, the
total number of particles was reduced by only 15% by heating,
showing that most of the particles were not completely volatile
and suggesting internal mixing. Figure 11 shows good agree-
ment between particle count distribution measured with the
DMPS and PCASP, despite the fact that the DMPS measures particle sizes on the basis of the electrical mobility of the
particles, and the PCASP measurements are derived from light
scattering. Volume size distributions calculated from the mea-
sured number size distributions, in combination with mass con-
centration measurements, were used to estimate particle den-
sity. Backscattering measurements from the nephelometer
MARTINS ET AL.: LIGHT ABSORPTION BY BC PARTICLES 32,047
Table 1. Characteristics
of SCAR-B
Samples
Listed
in Order of BC Mass
Absorption
Efficiency
BC Mass
Absorption
Location of Efficiency, BCTh/TPM ,
Sample Sampling Type of Sample MCE m 2 g-1 %
1 Brasilia 2 Cuiabfi 3 Cuiabfi 4 Marabfi 5 Porto Velho 6 Brasfiia 7 Marabfi 8 Cuiabfi 9 Porto Velho 10 Porto Velho 11 Cuiabfi 12 Marabfi 13 Brasfiia 14 Brasfiia 15 Brasfiia 16 Marabfi 17 Porto Velho 18 Porto Velho 19 Cuiabfi 20 Marabfi 21 Marabfi 22 Marabfi 23 Marabfi 24 Marabfi 25 Porto Velho 26 Cuiabfi 27 Marabfi 28 Porto Velho 29 Brasfiia 30 Marabfi 31 Marabfi 32 Cuiabfi 33 Marabfi 34 Marabfi 35 Marabfi 36 Marabfi emission factor regional haze
Cu processed (fire top) smoldering (EF) background emission factor in cloud regional haze background regional haze regional haze regional haze emission factor emission factor emission factor emission factor regional haze emission factor regional haze emission factor emission factor emission factor emission factor in cloud emission factor smoke column emission factor regional haze emission factor emission factor regional haze regional haze emission factor in cloud emission factor emission factor 5.2 5.85 7.2 12.94 7.9 4.32 0.881 8.3 7.10 8.9 5.56 0.949 9.1 5.18 9.2 14.07 10.3 5.98 10.7 2.25 11.4 4.60 11.4 4.59 11.4 5.76 12.3 9.73 0.936 12.5 5.78 0.958 13.3 10.74 0.896 13.4 7.00 14.1 5.03 0.894 15.4 4.19 17.1 1.85 0.883 17.4 4.41 0.828 18.1 5.05 0.946 19.3 5.82 21.3 6.51 25.1 7.98 0.975 25.2 11.82 25.7 3.77 0.920 25.9 5.41 27.8 1.87 0.949 29.9 4.00 37.0 2.20 37.5 2.33 41.9 0.57 0.966 55.0 1.89 56.2 3.15 57.3 1.93 0.855 58.3 2.23
Sample numbers are the same as in Table 2. Note that MCE corresponds to modified combustion
efficiency.
of the particle geometric standard deviation, using the expres-
sion proposed by Marshall et al. [1995]. The real refractive
indices of the nonabsorbing shells were estimated in an itera-
tive process to fit the scattering coefficient (o-,) measured by
the nephelometer at a wavelength of 0.55/xm. The amount of
BC was allowed to vary until it fitted the absorption coefficient (o-,) estimated from the Nuclepore filters. After convergence, o-,, o¾, the BC content, g, and c•a BC were compared with the
measured values.
Table 2 shows comparisons between some of the modeling
results and the measurements. The average real refractive in- dex obtained from the model was 1.48 + 0.08 (varying between 1.37 and 1.59). A real refractive index as small as 1.37 can be explained by possible underestimates of o- x by the nephelom-
eter, uncertainties in the particle size distribution, or inconsis-
tencies between the modeled particle structure and shape (lay-
ered sphere) and the actual particles. However, the single-
scattering albedo (tOo) and the asymmetry factor are relatively well produced by the model. The BC content estimated from
the model showed poor agreement with the measured BCTh.
Large uncertainties in the BC determination from the model
are associated to some extent with large values of aaBc de-
7O 6O 5O 'm 40 •ø30 2O 10 5 10 15 AmountofthermalBC (%) .... external mixing o K/BCth > 0.78 • internal mixing ß K/BCth < 0.78
Figure 9. Measured and modeled BC mass absorption effi-
ciencies (aa Bc) at A -- 0.55/am versus the amount of BC in the
sample. Solid curves represent the modeled aauc for three
particle size distributions given in Table 1. The dashed line is
the asymptotic limit for aa uc assuming external mixing and for the measured particle size distributions.
32,048 MARTINS ET AL.: LIGHT ABSORPTION BY BC PARTICLES
!'%.•.•;•.,.½•.
--,.%?•?....,,•-.,-,,..,
,
6.
E+05
t -'"
....
,..i.::.;.:(..'.'.;'::
...
•5•
' •1 i
'•;i:..:.,.,'. -.:;t½':;':*'x•!•;:: 5. E+05 • -•-- '& ....
...,
:,...
,....:;,;.
.... 7%; •?:.:;...:.:,-....% "• .... "-.**?'" .:'•" ":':'"'•:½5:-5 .... ,.• ""'" .,.. ... . .... .. :•-•':;..•,.-;•' .... •'•;-'.". .•., :.'3: '½ ?-" .•...; ' '"'ß
;,;;•;•..•;,
?•-'..
...
.:.'•,.•:e.-.':
...:f";•:".•,'
?%?' .'.•
Figure 10. (a) Typical scanning electron rnicroscopy (SEM)
photograph of aerosol particles with low c•a •(, w•lucs. Most of
the particles have spherical-like shape. (b) Typical SEM pho-
tograph of smoke particles with high •a Be-valucs. The photo-
graph shows a large concentration of nonspherical particles
and compact clusters of small particles similar to the one shown in Figure 5. , i , -' -'C ... 'F ... •- - ;• - _ 2. E+05
1
.E+05
- - - '-•.
',,,_
0. E+00 , , A _ _ _ •X- - I - - 0 0.1 0.2 0.3 0.4 0.5 0.6 diameter (pro)I I Cold--• Hot o Pcasp
-- fitting
1
Figure 11. Measured particle size distributions from the
DMPS (differential mobility particle sizer) and from the
PCASP (passive cavity aerosol spectrometer probe). DMPS cold corresponds to measurements at ambient temperature
and hot to measurements at 340øC. The solid cu•e represents
a lognormal fit to the combined DMPS "cold" plus PCASP data. The difference between DMPS results cold and hot sug- gests predominance of internal mixing.
rived from the combination of the thermal technique and op- tical absorption measurements (e.g., sample 27). Recall that the model cannot explain values of o•a Bc larger than 25 m 2 for the particle size distributions considered. Even for mono- disperse particles an optimized particle size would provide a
maximum value of c•aBc around 30 m 2 g , as shown in
Figure 3.
4. Conclusions
Black carbon mass absorption efficiency (-auc-) depends strongly on particle mixing, size distribution, and morphology of the particles. in agreement with the literature, results show
Table 2. Optical and Physical Properties of Aerosol Particles Measured and Calculated Using Mie Theory in Actual
Samples Collccted During SCAR-B Aboard the UW C13 I-A Aircraft
Results
Sample 4 Sample 27 Sample 10 Sample 7 Sample 20
Measured Calculated Measured Calculated Measured Calculated Measured Calculated Measured Calculated
Type D# erg DgV erg V p, gcm Rind shell 1 ers, m 1 era, m 600 %BCTh g oza eo m2 g - •
smoldering, Marabfi flaming, Marabfi haze, Porto Velho in cloud, Marabfi smoldering, Marabfi
0.12 0.087 0.19 0.12 0.11 1.89 1.87 1.78 1.79 1.89 0.27 0.25 0.52 0.25 0.27 1.63 1.62 1.78 1.62 1.67 1.21 1.00 1.20 1.28 1.04 1.440 1.525 1.370 1.587 1.460
6.4E-4 6.4E-4 1.11E-3 1.11E-3 4.72E-4 4.72E-4 4.9E-4 4.9E-4 8.70E-4 8.66E-4
1.30E-4 1.30E-4 3.79E-4 3.80E-4 6.75E-5 7.05E-5 1.54E-4 1.54E-4 1.84E-4 1.84E-4
0.83 0.83 0.74 0.74 0.87 0.87 0.76 0.76 0.83 0.83
7.1 4.1 5.41 9.6 4.60 4.3 14.07 7.8 4.41 5.3
0.533 0.550 0.485 0.490 0.617 0.689 0.52 0.50 0.534 0.55
8.3 15.3 25.9 15.2 11.4 12.5 9.2 16.6 17.4 15.3
The Mie calculations were performed for layered-sphere particles using the code developed by Ackerman and Toon, further improved and made available by W. Wiscombe. NASA GSFC. Size distributions were measured by the PCASP and DMPS instruments, ers and g was obtained by a onboard nephelometer (• = 0.55/xm), and era was obtained by a reflectance technique applied to Nuclepore filters intercalibrated with an optical extinction cell. All measurements were taken in parallel. Sample numbers are the same as presented in Table 1. Read 6.4E-4 as 6.4 x
10-4. Dg and erg, DgV, and ergV, correspond to the geometric mean diameter and standard deviation of the number and volume size
MARTINS ET AL.' LIGHT ABSORPTION BY BC PARTICLES 32,049
that the mass of BC was underestimated for samples with
high-K content producing unrealistic high values for BC mass
absorption efficiencies. An empirical upper limit K/BCTh =
0.78 has been defined in this paper to select reliable results for mass absorption efficiencies. Below this value the measured mass of BCTh provided good results for aa Bc. Similar behav-
iors were found for concentrations of Ca and Mg.
The BC mass absorption efficiency (aa Bc) for particles from
biomass burning in Brazil ranged from 5.2 to 19.3 m 2 g-• with
an average
value of 12.1 _+ 4.0 m 2 g-•. In addition
to the
layered sphere model for internal mixtures, a packed cluster model was proposed for biomass burning particles from re- gional haze. For a particular case with BC/TPM -- 0.64, the
packed cluster structure presented ozaBc values up to 35%
higher than results obtained for the layered sphere model for particles with radius above 0.1 /•m. Modeled results using cluster and layered sphere models plus Mie theory accounted
for aaBc values between 5 and 25 m 2 g-• depending on the
size distribution and BC fraction. The modeled results pro-
vided good estimates for the optical properties of the biomass
burning aerosol collected in Brazil. The large range of aaBc measured for biomass burning particles must be taken into
account when using optical measurements to determine the
mass of BC. An accurate determination of the mass of BC
through optical methods depends on knowing the value of
c•a Bc very well for each particular type of particles. Estimates
of aa nc are also important to connect BC emissions with light
absorption by particles in the atmosphere.
There was no clear correlation between aanc and location,
type of combustion, or type of sample. Samples with low aa nc
values contained mostly homogeneous particles with spherical-
like shape. Samples containing asymmetrical particles and clus-
ter-like structures showed higher aa nc values. This character-
istic was attributed either to the particular internal mixing contributing to enhance the light absorption properties or to earlier volatilization of BC particles during the thermal mea-
surements also enhanced by the particular internal mixing.
Acknowledgments. J. V. Martins thanks the Brazilian agencies
FAPESP (project 93/5017-3 and 96/2672-9) and CAPES (project 437/ 95) for financial support. The University of Washington's participation
in SCAR-B was supported by the following grants: NASA NAGW- 3750 and NAG 11709; NSF ATM-9400760, ATM-9412082, and ATM- 9408941; NOAA NA37RJ0198AM09; and EPA CR822077. We thank Alcides C. Ribeiro, Ana L. Loureiro, and Tarsis Germano for assis- tance during sampling and analysis. We are very grateful to H61ane
Cachier for her careful review and important discussions improving the
contents of the paper.
References
Ackerman, P. T., and O. B. Toon, Absorption of visible radiation in the
atmosphere containing mixtures of absorbing and nonabsorbing par-
ticles, Appl. Opt., 20, 3661-3667, 1981.
Bohren, C. F., and D. R. Huffman, Absorption and Scattering of Light
by Small Particles, pp. 213-219, Wiley Intersci., New York, 1983.
Cachier, H., M.P. Brdmond, and P. Buat-Mdnard, Determination of
atmospheric soot carbon with a simple thermal method, Tellus, Ser.
B, 41, 379-390, 1989.
Campbell, D., and T. Cahill, Response to "Comment on 'Measure-
ment of aerosol absorption coefficient from Teflon filters using the integrating plate and integrating sphere techniques' by D. Campbell, S. Copeland, and T. Cahill" by A. Clarke, J. Ogren, and R. Charlson,
Aerosol Sci. Technol., 24, 225-229, 1996.
Campbell, D., S. Copeland, and T. Cahill, Measurements of aerosol
coefficient from Teflon filters using integrating plate and integrating
sphere techniques, Aerosol Sci. Technol., 22, 287-292, 1995.
Chylek, P., G. Videen, D. Ngo, R. G. Pinnick, and J. D. Klett, Effect of black carbon on the optical properties and climate forcing of sulfate aerosols, J. Geophys. Res., 100, 16,325-16,332, 1995. Clarke, A.D., Integrating sandwich' A new method of measurement of
the light absorption coefficient of atmospheric particles, Appl. Opt.,
21, 3011-3021, 1982a.
Clarke, A.D., Effects of filter internal reflection coefficient on light absorption measurements made using the integrating plate method, Appl. Opt., 21, 3021-3031, 1982b.
Clarke, A.D., K. J. Noone, J. Heintzenberg, S. G. Warren, and D. S. Covert, Aerosol light absorption measurement techniques: Analysis and intercomparisons, Atmos. Environ., 21, 1455-1465, 1987. Clarke, A.D., J. Ogren, and R. Charlson, Comment on "Measurement
of aerosol absorption coefficient from Teflon filters using the inte- grating plate and integrating sphere techniques" by D. Campbell, S. Copeland, and T. Cahill, Aerosol Sci. Technol., 24, 221-224, 1996. Delumyea, R. G., L. C. Chu, and E. Macias, Determination of ele-
mental carbon component of soot in ambient aerosol samples, At- mos. Environ., 14, 647-652, 1980.
Draine, B. T., and P. J. Flatau, Discrete dipole approximation for scattering calculations, J. Opt. Soc. Am. A., 11, 1491-1499, 1994. Hallet, J., J. G. Hudson, and C. F. Rogers, Characterization of com-
bustion aerosols for haze and cloud formation, Aerosol Sci. Technol., 10, 70-83, 1989.
Hanel, G., Single scattering albedo, asymmetry parameter, apparent refractive index, and apparent soot content of dry atmospheric par- ticles, Appl. Opt., 27, 2287-2294, 1988.
Hanel, G., and C. Hillenbrand, Calorimetric measurements of optical absorption, Appl. Opt., 28, 510-516, 1989.
Hanel, G., R. Busen, C. Hillenbrand, and R. Schloss, Light absorption measurements: New techniques, Appl. Opt., 21,382-386, 1982. Hansen, A.D. A., H. Rosen, and T. Novakov, Real time measurement
of the aerosol particles, Appl. Opt., 21, 3060-3062, 1982.
Hobbs, P. V., Summary of types of data collected on the University of
Washington's Convair C-131A aircraft in the Smoke, Clouds and Radiation-Brazil (SCAR-B) field study from 17 August-20 Septem-
ber 1995, Cloud and Aerosol Res. Group, Dep. of Atmos. Sci., Univ. of Washington, Seattle, March 1996. (Also available on http:// cargsun2.atmos.washington.edu/.)
Horvath, H., Atmospheric light absorption--A review, Atmos. Envi- ron., Set. A, 27(3), 293-317, 1993a.
Horvath, H., Comparison of measurements of aerosol optical absorp- tion by filter collection and a transmissometric method, Atmos. En- viron., Ser. A, 27, 319-325, 1993b.
Japar, S. M., W. W. Brachaczek, R. A. Gorse, J. M. Norbeck, and
W. R. Pierson, The contribution of elemental carbon into the optical
properties of rural atmospheric aerosols, Atmos. Environ., 20, 1281-
1289, 1986.
Lindberg, J. D., and L. S. Laude, Measurement of the absorption coefficient of atmospheric dust, Appl. Opt., 13, 1923-1927, 1977. Liousse, C., H. Cachier, and S. G. Jennings, Optical and thermal
measurements of black carbon aerosols content in different envi-
ronments: Variations of the specific attenuation cross section, sigma
(o-), Atmos. Environ., Ser. A, 27, 1203-1211, 1993.
Marshall, S. F., D. S. Covert, and R. J. Charlson, Relationship between
asymmetry parameter and hemispheric backscatter ratio' Implica-
tions for climate forcing by aerosols. Appl. Opt.. 34. 6306-6311,
1995.
Martins, J. V., P. V. Hobbs, R. E. Weiss, and P. Artaxo, Sphericity and
morphology of smoke particles from biomass burning in Brazil, J.
Geophys. Res., this issue.
Novakov, T., and C. E. Corrigan, Thermal characterization of biomass smoke particles, Mikrochim. Acta, 119, 157-166, 1995.
Patterson, E. M., and B. T. Marshall, Diffuse reflectance and trans- mission measurements of aerosol absorption, in Light Absorption by Aerosol Particles, edited by H. E. Gerger and E. E. Hindman, Spec-
trum, Hampton, Va., 1982.
Petzold, A., and R. Niessner, Method comparison study on soot- selective techniques, Mikrochim. Acta, 117, 215-237, 1995.
Purcell, E. M., and C. R. Pennypacker, Scattering and absorption of light by nonspherical dielectric grains, Astrophys. J., 186, 705-714,
1973.
Reid, J. S., and P. V. Hobbs, Physical and optical properties of young
smoke from individual biomass fires in Brazil, J. Geophys. Res., this
issue.
32,050 MARTINS ET AL.: LIGHT ABSORPTION BY BC PARTICLES
T. F. Eck, Comparisons of techniques for measuring shortwave absorption and the black carbon content of aerosols from biomass burning in Brazil, J. Geol)hys. Res., this issue (a).
Reid, J. S., P. V. Hobbs, R. J. Ferek, D. R. Blake, J. V. Martins, M. R. Dunlap, and C. Liousse, Physical, chemical, and optical properties of regional hazes dominated by smoke in Brazil, J. Geophys. Res., this
issue (b).
Roessler, D. M., and F. R. Faxvog, Optical properties of agglomerated acetylene smoke particles at 0.5145/xm and 10.6/xm wavelengths, J. Opt. Soc. Am., 70, 230-235, 1980.
Ruoss, K., R. Dlugi, C. Weigl, and G. H/finel, Intercomparison of different Aethalometers with an absorption technique: Laboratory calibrations and field measurements, Atmos. Environ., 27A(8), 1221- 1228, 1993.
Weiss, R. E., and P. V. Hobbs, Optical extinction properties of smoke from the Kuwait oil fires, J. Geophys. Res., 97, 14,537-14,540, 1992.
P. Artaxo and J. V. Martins, Instituto de Ffsica, Universidade de S•o
Paulo, C.P. 66318, CEP 05315-970, S•o Paulo, Brazil. (e-mail: v an derlei @ if. usp. br)
P. V. Hobbs and J. S. Reid, Department of Atmospheric Sciences, University of Washington, Seattle, WA 98195-1640.
Y. Kaufman, NASA Goddard Space Flight Center, Code 913, Greenbelt, Maryland 20771.
C. Liousse, Centre de Faibles Radioactivites, CNRS-CEA, Av de la Terrasse, 91198 Gif sur Yvette, France.
(Received October 6, 1997; revised July 1, 1998; accepted August 3, 1998.)