HAL Id: dumas-01663901
https://dumas.ccsd.cnrs.fr/dumas-01663901
Submitted on 14 Dec 2017HAL is a multi-disciplinary open access
archive for the deposit and dissemination of sci-entific research documents, whether they are pub-lished or not. The documents may come from teaching and research institutions in France or abroad, or from public or private research centers.
L’archive ouverte pluridisciplinaire HAL, est destinée au dépôt et à la diffusion de documents scientifiques de niveau recherche, publiés ou non, émanant des établissements d’enseignement et de recherche français ou étrangers, des laboratoires publics ou privés.
La variabilite glycemique : un facteur de risque
cardiovasculaire?
Romain Darier
To cite this version:
Romain Darier. La variabilite glycemique : un facteur de risque cardiovasculaire?. Médecine humaine et pathologie. 2017. �dumas-01663901�
UNIVERSITÉ DE BORDEAUX
U.F.R DES SCIENCES MÉDICALES
Année 2017
THÈSE POUR LE DIPLÔME D’ÉTAT DE DOCTEUR EN MÉDECINE
Glycemic variability: a cardiovascular risk factor?
La variabilité glycémique: un facteur de risque cardiovasculaire?
Présenté et soutenu publiquement le 6 décembre 2017 à 18h30 en salle de conférence
de l'Hôpital Cardiologique du Haut Lévêque
Par ROMAIN DARIER
né le 8 septembre 1989 à Poissy
JURY:
Directeur de thèse:
Monsieur le Dr GERBAUD Edouard
Président:
Monsieur le Pr DOUARD Hervé
Rapporteur:
Monsieur le Pr NICOLESCU-CATARGI Bogdan
Assesseurs:
Madame le Dr COFFIN Christine
Monsieur le Pr COSTE Pierre
Abstract
Objective
Glycemic variability (GV) seems to be related to the occurrence of complications in patients with diabetes. However, the relationship between GV level and the occurrence of mid-term major cardiovascular event in patients with diabetes remains unclear. We evaluated the association between GV and the mid-term occurrence of major adverse cardiac event (MACE) in diabetic patients presenting with acute coronary syndrome (ACS).
Research design and Methods
This retrospective analysis included a cohort of 339 consecutive diabetic patients presenting with ACS between January 2015 and November 2016. A discontinuous glucose monitoring was performed during the hospital stay. GV was assessed by using standard deviation (SD). Two analysis were carried out, one using a cut-off of 50mg/dl (SD) to determine two groups: high GV [>50mg/dl(SD)] and low GV [<50mg/dl(SD)], and the other one using three groups per tertile of GV.
Results
Type 2 diabetes was largely predominant (93.5%). There was 8 (2.7%) newly diagnosed diabetes. Mean HbA1C measured during hospitalization was 7.55%. With a mean follow-up of 16.1 months, 87 patients (29.6%) presented at least one MACE. Female gender, age, known cardiovascular risk factors (smoking status, LDL-C value), previous coronary artery disease (CAD), a three-vessel disease, Killip class ≥ 2, left ventricular ejection fraction (LVEF), BNP value, the occurrence of acute kidney failure, vasopressor/inotropic agents use, insulin therapy at hospital discharge, high level of hyperglycemia during hospitalization and elevation of GV [>50mg/dl(SD) and 3rd tertile]
were associated with the occurrence of MACE (p < 0.05) in the univariate analysis. Multivariate analysis, including variables with a significance level of p < 0.2 in univariate analysis, showed that Killip class ≥ 2, high GV by using the cut-off of 50 mg/dl(SD) and the 3rd GV tertile were strongly
associated with the occurrence of MACE (p = 0,006, p = 0.014 and p = 0.04 respectively).
Conclusions
GV in diabetic patients presenting with ACS is a powerful independent predictive factor of mid-term MACE.
Keywords
Résumé
But
La variabilité glycémique (VG) semble être associée à la survenue de complications chez le patient diabétique. Cependant, la relation entre VG et survenue d'événements cardiovasculaires majeurs (ECVM) chez les patients diabétiques reste incertaine. Nous avons donc évalué l'association entre VG et survenue d'ECVM à moyen terme chez une population de patients diabétiques ayant présenté un syndrome coronarien aigu.
Design de l'étude et Méthodes
Cette étude rétrospective a concerné une cohorte de 339 patients diabétiques ayant présenté un syndrome coronarien aigu. Ceux-ci ont été inclus consécutivement entre Janvier 2015 et Novembre 2016. Un monitorage discontinu de la glycémie a été réalisé durant l'hospitalisation pour l'infarctus du myocarde. La VG a été évaluée en utilisant la déviation standard (DS). Ensuite, deux analyses ont été réalisées, l'une utilisant un cut-off de 50mg/dl(DS) pour déterminer deux groupes : haute VG [>50mg/dl(DS)] et faible VG [<50mg/dl(DS)] et l'autre établissant trois groupes par tertile de VG.
Résultats
Le diabète de type 2 était largement prédominant (93.5%). Il y a eu 8 (2.7%) découvertes de diabète. L'HbA1C moyenne mesurée pendant l'hospitalisation était de 7.55%. Avec un suivi moyen de 16,1 mois, 87 patients (29.6%) ont présenté au moins un ECVM. Le sexe féminin, l'âge, les facteurs de risque cardiovasculaire connus (tabagisme, taux de LDL-C), un antécédent coronarien, une coronaropathie tritronculaire, un score Killip ≥ 2, la fraction d'éjection ventriculaire gauche, le taux de BNP, la survenue d'une insuffisance rénale aiguë durant l'hospitalisation, l'utilisation d'amines, une insulinothérapie à la sortie d'hospitalisation, un nombre élevé d'hyperglycémies durant le séjour et une importante VG [>50mg/dl(DS) et le 3ème tertile] étaient associés à la survenue
d'ECVM (p < 0.05) en analyse univariée. L'analyse multivariée incluant les variables avec un niveau de significativité p < 0.2 en analyse univariée montrait qu'un score Killip ≥ 2, une VG importante en utilisant le cut-off de 50mg/dl(DS) et le 3ème tertile étaient fortement associés à la
survenue d'ECVM (respectivement p = 0.006, p = 0.014 et p = 0.04).
Conclusions
La VG chez des patients diabétiques présentant un syndrome coronarien aigu est un puissant facteur prédictif indépendant de survenue d'ECVM à moyen terme.
Mots-clés
diabète - syndrome coronarien aigu - variabilité glycémique - monitorage glycémique - événement cardiovasculaire majeur
Abbreviations and acronyms
ACS: acute coronary syndrome AMI: acute myocardial infarction APT: antiplatelet therapy
BMI: body mass index
BNP: brain natriuretic peptide
CABG: coronary artery bypass grafting CAD: coronary artery disease
CKD: chronic kidney disease
CKD-EPI: chronic kidney disease-epidemiology collaboration DAT: dual antiplatelet therapy
GV: glycemic variability
HbA1C: glycosylated hemoglobin
HDL-C: high-density lipoprotein cholesterol ICCU: intensive cardiovascular care unit ICU: intensive care unit
KDIGO: kidney disease improving global outcomes LDL-C: low-density lipoprotein cholesterol
LVEF: left ventricular ejection fraction OAC: oral anticoagulant
OAD: oral antidiabetic drug
PCI: primary coronary intervention
RAASI: renin-angiotensin-aldosterone system inhibitor RRT: renal replacement therapy
STEMI: ST-segment elevation myocardial infarction TC: total cholesterol
TG: triglyceride
Introduction
Diabetes mellitus has long been known as one of the major cardiovascular risk factors (1–4). Among patients with type 1 and type 2 diabetes, cardiovascular disease remains the most common cause of death (3,5,6). Many previous studies demonstrated an association between coronary artery disease, cardiovascular mortality (3), and hyperglycemia (1,7), long term glycemic level by using HbA1C (2,8,9), hypoglycemia (10,11). In the same way, effective diabetes control dramatically reduces cardiovascular complications (2,8,9) and mortality (9). However too strict control does not reduce macrovascular complications (seems to be effective on microvascular ones) (12–14) and may even lead to hypoglycemia and be deleterious (13–15).
Those complications can be explained at the cellular scale by multiple and complex mechanisms at the origin of an endothelial dysfunction, inflammation, thrombosis, oxidative stress (10,18) which promote atherosclerosis (19), coronary plaque vulnerability, the occurrence of no-reflow phenomenon (20), might increase myocardial infarction size (21,22) induce arrhythmias (23,24). In the setting of acute myocardial infarction (AMI), many factors related to diabetes such as admission blood glucose (25,26), fasting blood glucose, hyperglycemia (27,28), HbA1C are associated with adverse cardiovascular event or mortality (29). At the opposite, prognostic implications of hypoglycemic episodes still debated (29,30). Thus, previous studies are often struggling to prove that correcting these factors in the acute phase improves the prognosis of patients with diabetes (31,32). Kosiborod et al.(33) is one of the few to report (31) that glucose normalization after an AMI was associated with better survival in hyperglycemic patients.
An other marker reflecting diabetes instability appears more and more in the literature: the glycemic variability (GV). GV (34) seems to be related to the occurrence of complications in patients with diabetes (35–37). This is explained by the impact of GV on the previously mentioned pathophysiological mechanisms: oxidative stress (38), endothelial dysfunction (39), inflammation (40), fibrosis (41), atherogenesis (42). Furthermore the development and the availability of continuous glucose monitoring systems encourage its evaluation (43).
To quantify GV, lots of methods are available but there is no universally accepted "gold standard" (41). Mean amplitude glycemic excursion (MAGE) and standard deviation (SD) are among the most used and seem to be relevant (41,44).
In the face of the growing interest aroused by this variable, some authors raise the question of the impact of this factor on the prognosis of diabetic patients and the expected benefit of orienting therapeutics on the reduction of GV. Some studies report a connection between GV and microvascular diabetes complications (45), predictive cardiovascular risk (46), but also
macrovascular complications such as coronary artery disease (47).Several Japanese teams found an interesting association with the coronary plaque progression (48) and vulnerability (49,50), left ventricular remodeling (51).
At the opposite, previous studies did not find a significant association between GV and the occurrence of MACE (52–55).
In the context of AMI, Su et al. describe an association between an important GV (measured by continuous glucose monitoring) and 1-year MACE in patients with or without diabetes (56,57). Other studies reported similar results (58–60).
However, the association between GV level and the occurrence of mid-term major cardiac event in patients with diabetes remains unclear (35). Thus, the aim of this study was to evaluate the association between GV and the mid-term occurrence of major adverse cardiac event (MACE) in diabetic patients presenting with acute coronary syndrome (ACS).
Research Design and Methods
Study population
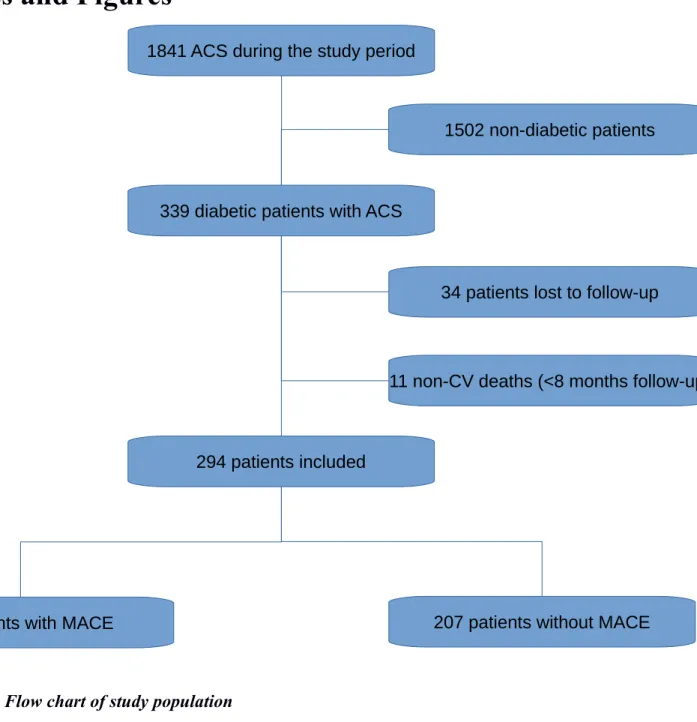
1841 patients presenting with ACS were hospitalized in the intensive cardiovascular care unit (ICCU) of the Bordeaux University Hospital between January 2015 and November 2016. This retrospective analysis of a cohort of 339 consecutive diabetic patients presenting with ACS was conducted between January 2015 and August 2017. Clinical data of all these diabetic patients were collected.
First 339 patients were eligible. Among those patients, 45 patients (13.3%) were excluded from the analysis because they died of a non-CV cause before the point date (n=11) or their date of last view was anterior to the minimum follow-up of 8 months (n=34) (Figure 1).
Despite the patients excluded from the analysis the initial and the final cohorts remain comparable (Table 1).
Inclusion criteria
A patient was considered diabetic if he was known diabetic and/or if he received an antidiabetic treatment and/or if his HbA1C at admission was ≥6.5% (61,62). We did not use venous glucose level to exclude patients with stress hyperglycemia.
ACS was defined according the European Society of Cardiology Guidelines (63,64).
Measurement of glycemia
All blood glucose measurements were collected by using the ACCU-CHEK Inform II® system allowing the point-of-care measurement of all the glycemia values. They were collected during the all stay in our hospital including the ICCU and the conventional cardiology unit stay.
Measurement of glycemic variability
Because of the discontinuous monitoring of glycemia and the possible application of this method to everyday life, we arbitrarily chose to use SD of glycemia instead of MAGE or coefficient of variation to evaluate the glycemic variability of each patient (41,44,65,66). In a first analysis two groups were obtained according to the degree of GV (< or > 50mg/dl). Then three groups per tertile of GV were defined.
Management of diabetes during the hospitalization
During the ICCU stay, intravenous insulin therapy was used if necessary to achieve the glycemic target according to the ESC guidelines (62). Diabetes during traditional cardiology unit stay was medically managed following ESC guidelines (62) with the possibility of specialized advice if necessary.
Outcomes
The follow-up period was defined as the time elapsed between May and August 2017.The primary endpoint and health status of all the patients were collected by using all medical reviews available in our center or by contacting general practitioners, patients' cardiologists or peripheral hospitals. In some rare cases, we needed to contact patients themselves.
Primary outcome was defined as MACE including myocardial infarction, hospitalization for acute heart failure and cardiovascular death.
Statistical analysis
Data are presented as frequencies and percentages for categorical variables, median for abnormal
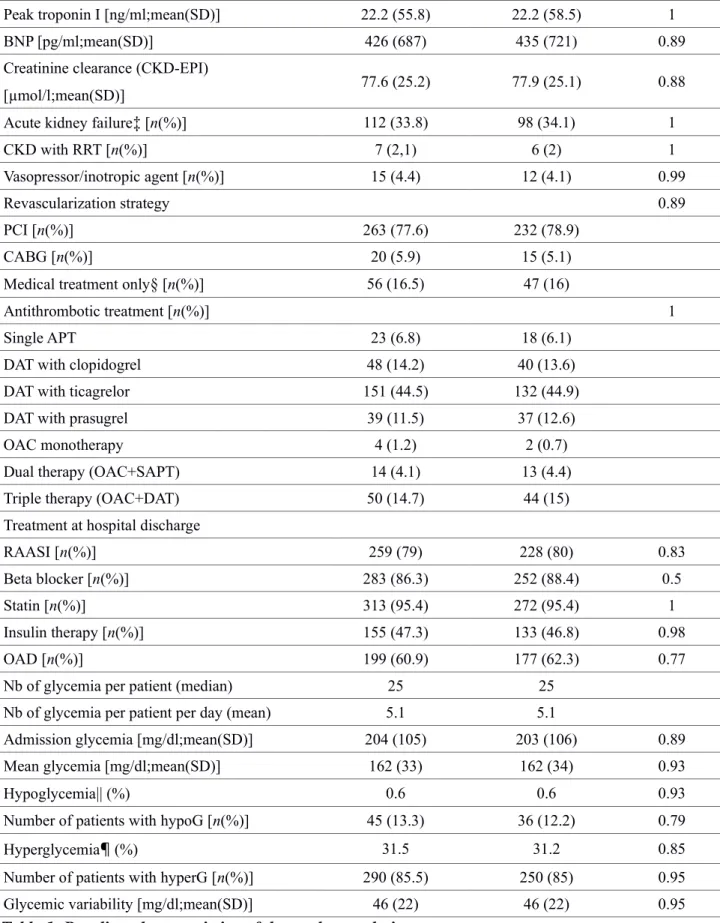
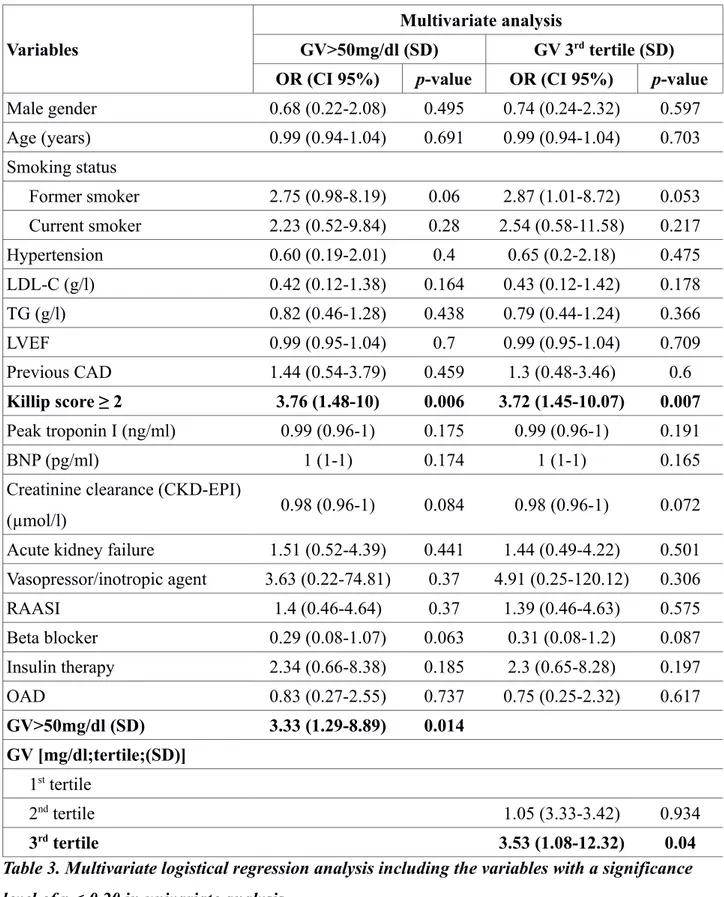
distributed parameters and mean ± SD for continuous distributed variables, unless otherwise indicated. Continuous variables were expressed as mean ± SD or median (25th, 75th percentiles), while categorical variables were compared using a Chi² test with a Yates correction. Differences between two groups were assessed by using the Chi square, Mann-Whitney rank analysis and unpaired t-tests. First, a univariate analysis was performed. To ascertain the independent contribution of GV to MACE, a multivariate logistical regression analysis was carried out including the variables with a significance level of p < 0.20 in univariate analysis. Variables adjusted in the model were: female gender, age, smoking status, LDL-C value, a previous coronary artery disease (CAD), a three-vessel disease, left ventricular ejection fraction (LVEF), a Killip stage ≥ 2, elevation of cardiac biomarkers (BNP, troponin I), the occurrence of acute kidney failure during hospitalization, elevation of creatinine clearance level (CKD-EPI), the use of vasopressor/inotropic agents, presence of an insulin therapy, a renin-angiotensin-aldosterone system inhibitor (RAASI), a beta-blocker and an oral antidiabetic drug (OAD) at hospital discharge and elevation of GV (group with GV>50mg/dl, 3rd tertile). A value of p < 0.05 was considered statistically significant. All statistical analyses were performed by using R v3.4.2.
Results
In our study, patients were mostly male (77.9%), average age was 68.2 years old. Type 2 diabetes was largely predominant (93.5%) which may explain the metabolic patients profile (78.8% of hypertension, mean BMI 28.9kg/m²). There were 8 patients (2.7%) newly diagnosed diabetes. Most patients were relatively well treated concerning diabetes (mean HbA1C = 7.55%) and dyslipidemia (mean LDL-C = 1.06g/l); thus among them 38.1% had previous CAD. Concerning ACS, 30.1% of them were STEMI; 136 patients (46.3%) had a three-vessel disease. Acute kidney failure (defined as ≥ stage 1 of KDIGO classification (67)) occurred in approximately one third of patients (34.1%). 232 patients (78.9%) underwent primary coronary intervention (PCI), 15 patients (5,1%) were treated using coronary artery bypass grafting (CABG) and 47 patients (16%) were medically managed. At hospital discharge, the majority of patients received optimal medical treatment (beta-blocker: 88,4%, RAASI: 80%, statin: 95,4%). 133 patients (46.8%) received insulin therapy and 177 patients (62.3%) received OAD. Regarding to glycemic measurement, there were a median of 25 glycemia per patient and a mean of 5,1 glycemia per patient per day. Due to the high proportion of type 2 diabetes, hypoglycemic episodes were rare (0.6%) whereas hyperglycemic ones were really common (31.2%).
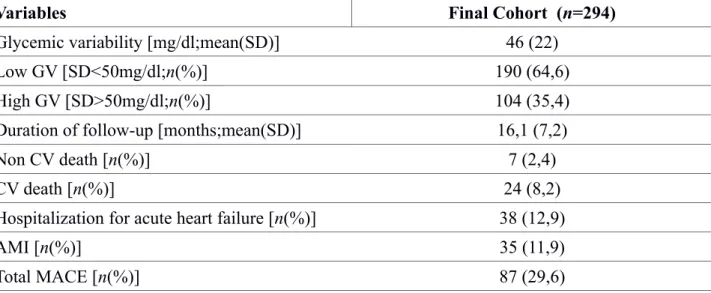
Concerning the GV, mean value was 46mg/dl(SD). When applying the cut-off of 50 mg/dl(SD), 190 patients (64.6%) had a low GV and 104 (35.4%) a high one (Table 2).
In our cohort, the mean follow-up was 16,1 months. A MACE occurred in 87 patients (29,6%) (Figure 1): 38 (12,9%) hospitalization for acute heart failure, 35 (11.9%) AMI and 24 (8.2%) CV-death (Table 2).
Univariate regression analysis
In univariate analysis, following criteria are associated with the occurrence of MACE (p < 0.05): female gender (68), age, known cardiovascular risk factors (smoking status, LDL-C, TG, TC), a previous CAD, a three-vessel disease, LVEF, a Killip class ≥ 2, BNP value, the occurrence of acute kidney failure during hospitalization, the use of vasopressor/inotropic agents, an insulin therapy at hospital discharge, high level of hyperglycemia during hospital stay and elevation of GV (group with GV>50mg/dl, 3rd tertile). At the opposite, the following factors were protective: presence of an
RAASI, a beta blocker and an OAD at hospital discharge, elevation of creatinine clearance level (CKD-EPI).
Type of diabetes, level of HbA1C (p = 0.57), admission glycemia (p = 0.05), number of hypoglycemia (p = 0.06), HTA (p = 0.07), type of AMI (p = 0,7) are not associated with the
occurrence of MACE. Neither the presence of statin at discharge (p = 0.93) (probably because of the low statistical power generated by the small number of untreated patients).
Multivariate regression analysis
In the multivariate proportional Cox regression analysis (Table 3), only two variables still to be strongly associated with the occurrence of MACE: a Killip class ≥ 2 (p = 0.004) and GV.
This important relation between GV and MACE was valid with the cut-off value of 50mg/dl (p = 0.014) and with the 3rd tertile group (p = 0.04).
The rate of MACE in high GV group (SD>50mg/dl) was 46.2% vs. 20.5% in the low one (SD<50mg/dl). The rate of MACE by GV (SD) tertile (>51.47mg/dl, 34.66-51.47mg/dl, <34.66) was respectively 44.9% vs. 24.5% vs. 19.4%.
Conclusions
Our study shows the association between GV after an ACS in the specific population of diabetic patients and the occurrence of mid-term MACE. This pilot study demonstrates a major association between GV and MACE and therefore the importance to be interested in this variable in the management of patients with diabetes in the acute phase of myocardial infarction and in secondary prevention.
The strength of this study lies in the adjustment to several different factors known to be associated with the occurrence of MACE such as cardiovascular risk factors and parameters related to severity criteria of ACS. It also includes the variables linked to the prognosis in ICCU. The results of this study seem to be convincing as the study population before hospital admission was well-treated concerning common cardiovascular risk factors (mean LDL-C=1.06g/l, mean HbA1C=7.55%) and medical treatment at hospital discharge was quite optimal.
Our pilot study reflect the “real world” population in that it includes all consecutive diabetic patients hospitalized with AMI during the study period. Regarding the glycemic measurement, the point-of-care measurement of all blood glucose levels avoids input errors. Discontinuous glucose monitoring is very interesting because it is applicable to everyday life but is less efficient to estimate the real GV.
Study limitations
The use of SD (which reflects more dispersion than variability) can be objectionable (69) but some authors have shown that the random sampling errors in the SD (65) are significantly and consistently smaller than the use of other variables such as MAGE (65,66). SD is usefull and sufficient to assess GV and its evolution in patients in clinical routine practice (41,65).Its use could also be extended to assess ambulatory GV with self monitoring blood glucose (70).
The evolution of GV and common cardiovascular risk factor during follow-up could have been a valuable indication but is missing too in our study.
Clinical implications
Regarding specific population of patients with type 1 diabetes who were a minority in our study (5.8%), previous studies did not show any association between short term GV and diabetes complications (35).However, it seems difficult to definitely conclude in this population.
In the literature, some studies whose methodologies are open to criticism because of a low number of glycemias (54) or because authors re-analyse databases that are not built to answer the initial
question of influence of GV (52), do not find any connection between GV and MACE. To our knowledge, only one well-conducted trial lead by Mellbin et al. (55) did not outline any association between GV and diabetic patients prognosis after an AMI but he used other variables to evaluate GV.
At present, guidelines concerning management of glycemia in ACS (62) propose that an insulin-based glycemic control should be considered in case of hyperglycemia (>10 mmol/L or >180 mg/dL) with the target adapted to possible comorbidities but exact targets are still to be defined. As a reminder, many large trials do not find a benefit to a strict control of blood glucose in the acute phase of myocardial infarction (71–73).
At this time, more and more authors have investigated GV as a target for the management of diabetes (74).
In the current therapeutic arsenal of type 2 diabetes, molecules like dipeptidyl peptidase-IV inhibitors (75,76), glucagon-like peptide-1 analogues (77–79) but also the accessibility and the development of continuous glucose monitoring systems allow to significantly reduce GV (80).This finding is all the more relevant as the recent LEADER trial (81) shows a reduction in the occurrence of MACE with the use of liraglutide (a glucagon-like peptide analogue) vs. placebo in patients with type 2 diabetes with high cardiovascular risk. But to our knowledge, no study has attempted to evaluate the impact of reducing GV in the acute phase of myocardial infarction.
Other prospective trials are needed to assess whether GV is an independent cardiovascular risk factor and whether correction of high GV can reduce the occurrence of cardiovascular events. GV after an AMI in patients with diabetes is a powerful independent predictive factor of mid-term cardiovascular risk. A high GV must at least alert to the patient's cardiovascular risk.
Tables and Figures
Figure 1. Flow chart of study population
11 non-CV deaths (<8 months follow-up) 34 patients lost to follow-up
339 diabetic patients with ACS
294 patients included
87 patients with MACE 207 patients without MACE 1841 ACS during the study period
Variables Eligible Patients(n=339) Final Cohort (n=294) p-value Male gender [n(%)] 261 (77) 229 (77.9) 0.86 Age [years;mean(SD)] 69 (11.9) 68.2 (11.7) 0.41 Smoking status [n(%)] 0.91 Non-smoker 164 (48.4) 139 (47.3) Former smoker 106 (31.3) 91 (31) Current smoker 69 (20.4) 64 (21.8) Hypertension* [n(%)] 263 (77.5) 232 (78.8) 0.76 Type of diabetes [n(%)] 0.95 Type 1 18 (5.3) 17 (5.8) Type 2 319 (94.1) 275 (93.5)
Secondary (chronic pancreatitis) 2 (0.6) 2 (0.7)
HbA1C [%;mean(SD)] 7.55 (1.43) 7.55 (1.4) 0.98 TC [g/l;mean(SD)] 1.75 (0.54) 1.76 (0.55) 0.78 LDL-C [g/l;mean(SD)] 1.05 (0.46) 1.06 (0.46) 0.86 HDL-C [g/l;mean(SD)] 0.41 (0.1) 0.41 (0.1) 0.82 TG [g/l;mean(SD)] 1.76 (1.53) 1.76 (1.39) 0.99 BMI [kg/m²;mean(SD)] 28.8 (5) 28.9 (4.9) 0.75 LVEF [%;mean(SD)] 51.8 (10.9) 51.8 (11.2) 0.99
Family history of CAD [n(%)] 41 (12.1) 37 (12.6) 0.95
Previous CAD [n(%)] 133 (39.2) 112 (38.1) 0.83 STEMI [n(%)] 102 (30.4) 88 (30.2) 1 Extent of CAD [n(%)] 0.97 No invasive angiography 7 (2.1) 4 (1.4) No significant stenosis 7 (2.1) 6 (2) One-vessel 74 (21.8) 68 (23.1) Two-vessel 89 (26.3) 78 (26.5) Three-vessel 158 (46.6) 136 (46.3) Non-reperfused STEMI† [n(%)] 31 (9.1) 27 (9.2) 1
Delay to reperfusion (STEMI) [hours;mean(SD)] 4.5 (3.7) 4.3 (3.6) 0.78
TIMI Grade Flow [n(%)] 0.98
TIMI 0 11 (3.2) 11 (3.7) TIMI 1 2 (0.6) 2 (0.7) TIMI 2 3 (0.9) 3 (1) TIMI 3 280 (82.6) 243 (82.6) Killip score [n(%)] 0.99 Killip 1 251 (74) 216 (73.5) Killip 2 50 (14.7) 42 (14.3) Killip 3 31 (9.1) 29 (9.9) Killip 4 4 (1.2) 4 (1.4)
Peak troponin I [ng/ml;mean(SD)] 22.2 (55.8) 22.2 (58.5) 1
BNP [pg/ml;mean(SD)] 426 (687) 435 (721) 0.89
Creatinine clearance (CKD-EPI)
[µmol/l;mean(SD)] 77.6 (25.2) 77.9 (25.1) 0.88
Acute kidney failure‡ [n(%)] 112 (33.8) 98 (34.1) 1
CKD with RRT [n(%)] 7 (2,1) 6 (2) 1
Vasopressor/inotropic agent [n(%)] 15 (4.4) 12 (4.1) 0.99
Revascularization strategy 0.89
PCI [n(%)] 263 (77.6) 232 (78.9)
CABG [n(%)] 20 (5.9) 15 (5.1)
Medical treatment only§ [n(%)] 56 (16.5) 47 (16)
Antithrombotic treatment [n(%)] 1
Single APT 23 (6.8) 18 (6.1)
DAT with clopidogrel 48 (14.2) 40 (13.6)
DAT with ticagrelor 151 (44.5) 132 (44.9)
DAT with prasugrel 39 (11.5) 37 (12.6)
OAC monotherapy 4 (1.2) 2 (0.7)
Dual therapy (OAC+SAPT) 14 (4.1) 13 (4.4)
Triple therapy (OAC+DAT) 50 (14.7) 44 (15)
Treatment at hospital discharge
RAASI [n(%)] 259 (79) 228 (80) 0.83
Beta blocker [n(%)] 283 (86.3) 252 (88.4) 0.5
Statin [n(%)] 313 (95.4) 272 (95.4) 1
Insulin therapy [n(%)] 155 (47.3) 133 (46.8) 0.98
OAD [n(%)] 199 (60.9) 177 (62.3) 0.77
Nb of glycemia per patient (median) 25 25
Nb of glycemia per patient per day (mean) 5.1 5.1
Admission glycemia [mg/dl;mean(SD)] 204 (105) 203 (106) 0.89
Mean glycemia [mg/dl;mean(SD)] 162 (33) 162 (34) 0.93
Hypoglycemia|| (%) 0.6 0.6 0.93
Number of patients with hypoG [n(%)] 45 (13.3) 36 (12.2) 0.79
Hyperglycemia¶ (%) 31.5 31.2 0.85
Number of patients with hyperG [n(%)] 290 (85.5) 250 (85) 0.95
Glycemic variability [mg/dl;mean(SD)] 46 (22) 46 (22) 0.95
Table 1. Baseline characteristics of the study population * Hypertension = antihypertensive treatment at admission
† Non-reperfused STEMI: persistence of ST-segment elevation on ECG due to failure of revascularization or delay between initial symptom and hospitalization > 24h
‡ Acute kidney failure defined according to KDIGO staging of acute kidney injury (≥ stage 1: elevation of creatinine 1.5 times baseline or ≥ 26,5 µmol/l increase)
§ decision of medical treatment or failure of revascularization || Hypoglycemia = glycemia ≤ 60 mg/dl
Variables Final Cohort (n=294) Glycemic variability [mg/dl;mean(SD)] 46 (22)
Low GV [SD<50mg/dl;n(%)] 190 (64,6) High GV [SD>50mg/dl;n(%)] 104 (35,4) Duration of follow-up [months;mean(SD)] 16,1 (7,2)
Non CV death [n(%)] 7 (2,4)
CV death [n(%)] 24 (8,2)
Hospitalization for acute heart failure [n(%)] 38 (12,9)
AMI [n(%)] 35 (11,9)
Total MACE [n(%)] 87 (29,6)
Variables
Multivariate analysis
GV>50mg/dl (SD) GV 3rd tertile (SD)
OR (CI 95%) p-value OR (CI 95%) p-value
Male gender 0.68 (0.22-2.08) 0.495 0.74 (0.24-2.32) 0.597 Age (years) 0.99 (0.94-1.04) 0.691 0.99 (0.94-1.04) 0.703 Smoking status Former smoker 2.75 (0.98-8.19) 0.06 2.87 (1.01-8.72) 0.053 Current smoker 2.23 (0.52-9.84) 0.28 2.54 (0.58-11.58) 0.217 Hypertension 0.60 (0.19-2.01) 0.4 0.65 (0.2-2.18) 0.475 LDL-C (g/l) 0.42 (0.12-1.38) 0.164 0.43 (0.12-1.42) 0.178 TG (g/l) 0.82 (0.46-1.28) 0.438 0.79 (0.44-1.24) 0.366 LVEF 0.99 (0.95-1.04) 0.7 0.99 (0.95-1.04) 0.709 Previous CAD 1.44 (0.54-3.79) 0.459 1.3 (0.48-3.46) 0.6 Killip score ≥ 2 3.76 (1.48-10) 0.006 3.72 (1.45-10.07) 0.007 Peak troponin I (ng/ml) 0.99 (0.96-1) 0.175 0.99 (0.96-1) 0.191 BNP (pg/ml) 1 (1-1) 0.174 1 (1-1) 0.165 Creatinine clearance (CKD-EPI)
(µmol/l) 0.98 (0.96-1) 0.084 0.98 (0.96-1) 0.072 Acute kidney failure 1.51 (0.52-4.39) 0.441 1.44 (0.49-4.22) 0.501 Vasopressor/inotropic agent 3.63 (0.22-74.81) 0.37 4.91 (0.25-120.12) 0.306 RAASI 1.4 (0.46-4.64) 0.37 1.39 (0.46-4.63) 0.575 Beta blocker 0.29 (0.08-1.07) 0.063 0.31 (0.08-1.2) 0.087 Insulin therapy 2.34 (0.66-8.38) 0.185 2.3 (0.65-8.28) 0.197 OAD 0.83 (0.27-2.55) 0.737 0.75 (0.25-2.32) 0.617 GV>50mg/dl (SD) 3.33 (1.29-8.89) 0.014 GV [mg/dl;tertile;(SD)] 1st tertile 2nd tertile 1.05 (3.33-3.42) 0.934 3rd tertile 3.53 (1.08-12.32) 0.04
Table 3. Multivariate logistical regression analysis including the variables with a significance level of p < 0.20 in univariate analysis
References
1. Klein R. Hyperglycemia and microvascular and macrovascular disease in diabetes. Diabetes Care. 1995 Feb;18(2):258–68.
2. Turner RC, Millns H, Neil HAW, Stratton IM, Manley SE, Matthews DR, et al. Risk factors for coronary artery disease in non-insulin dependent diabetes mellitus: United Kingdom prospective diabetes study (UKPDS: 23). BMJ. 1998 Mar 14;316(7134):823–8.
3. Stamler J, Vaccaro O, Neaton JD, Wentworth D. Diabetes, other risk factors, and 12-yr cardiovascular mortality for men screened in the Multiple Risk Factor Intervention Trial. Diabetes Care. 1993 Feb;16(2):434–44.
4. Malmberg K, Yusuf S, Gerstein HC, Brown J, Zhao F, Hunt D, et al. Impact of diabetes on long-term prognosis in patients with unstable angina and non-Q-wave myocardial infarction: results of the OASIS (Organization to Assess Strategies for Ischemic Syndromes) Registry. Circulation. 2000 Aug 29;102(9):1014–9.
5. Laing SP, Swerdlow AJ, Slater SD, Burden AC, Morris A, Waugh NR, et al. Mortality from heart disease in a cohort of 23,000 patients with insulin-treated diabetes. Diabetologia. 2003 Jun;46(6):760–5.
6. Deedwania P, Kosiborod M, Barrett E, Ceriello A, Isley W, Mazzone T, et al. Hyperglycemia and Acute Coronary Syndrome: A Scientific Statement From the American Heart Association Diabetes Committee of the Council on Nutrition, Physical Activity, and Metabolism. Circulation. 2008 Mar 25;117(12):1610–9.
7. Groeneveld Y, Petri H, Hermans J, Springer MP. Relationship between blood glucose level and mortality in Type 2 diabetes mellitus: a systematic review. Diabet Med. 1999 Jan;16(1):2–13. 8. Kuusisto J, Mykkänen L, Pyörälä K, Laakso M. NIDDM and its metabolic control predict
coronary heart disease in elderly subjects. Diabetes. 1994 Aug;43(8):960–7.
9. Stratton IM, Adler AI, Neil HA, Matthews DR, Manley SE, Cull CA, et al. Association of glycaemia with macrovascular and microvascular complications of type 2 diabetes (UKPDS 35): prospective observational study. BMJ. 2000 Aug 12;321(7258):405–12.
10. Hanefeld M, Duetting E, Bramlage P. Cardiac implications of hypoglycaemia in patients with diabetes - a systematic review. Cardiovasc Diabetol. 2013 Sep 21;12:135.
11. Yakubovich N, Gerstein HC. Serious Cardiovascular Outcomes in Diabetes: The Role of Hypoglycemia. Circulation. 2011 Jan 25;123(3):342–8.
12. ADVANCE Collaborative Group, Patel A, MacMahon S, Chalmers J, Neal B, Billot L, et al. Intensive blood glucose control and vascular outcomes in patients with type 2 diabetes. N Engl J Med. 2008 Jun 12;358(24):2560–72.
13. Intensive blood-glucose control with sulphonylureas or insulin compared with conventional treatment and risk of complications in patients with type 2 diabetes (UKPDS 33). UK Prospective Diabetes Study (UKPDS) Group. Lancet Lond Engl. 1998 Sep 12;352(9131):837– 53.
14. Duckworth W, Abraira C, Moritz T, Reda D, Emanuele N, Reaven PD, et al. Glucose Control and Vascular Complications in Veterans with Type 2 Diabetes. N Engl J Med. 2009 Jan 8;360(2):129–39.
15. Gerstein HC, Riddle MC, Kendall DM, Cohen RM, Goland R, Feinglos MN, et al. Glycemia treatment strategies in the Action to Control Cardiovascular Risk in Diabetes (ACCORD) trial. Am J Cardiol. 2007 Jun 18;99(12A):34i–43i.
16. Effects of Intensive Glucose Lowering in Type 2 Diabetes. N Engl J Med. 2008 Jun 12;358(24):2545–59.
17. Intensive versus Conventional Glucose Control in Critically Ill Patients. N Engl J Med. 2009 Mar 26;360(13):1283–97.
18. Brownlee M. Biochemistry and molecular cell biology of diabetic complications. Nature. 2001 Dec 13;414(6865):813–20.
19. Goraya TY, Leibson CL, Palumbo PJ, Weston SA, Killian JM, Pfeifer EA, et al. Coronary atherosclerosis in diabetes mellitus. J Am Coll Cardiol. 2002 Sep;40(5):946–53.
20. Iwakura K, Ito H, Ikushima M, Kawano S, Okamura A, Asano K, et al. Association between hyperglycemia and the no-reflow phenomenon in patients with acute myocardial infarction. J Am Coll Cardiol. 2003 Jan 1;41(1):1–7.
21. Mather AN, Crean A, Abidin N, Worthy G, Ball SG, Plein S, et al. Relationship of dysglycemia to acute myocardial infarct size and cardiovascular outcome as determined by cardiovascular magnetic resonance. J Cardiovasc Magn Reson. 2010;12(1):61.
22. Alegria JR, Miller TD, Gibbons RJ, Yi Q-L, Yusuf S. Infarct size, ejection fraction, and mortality in diabetic patients with acute myocardial infarction treated with thrombolytic therapy. Am Heart J. 2007 Oct;154(4):743–50.
23. Landstedt-Hallin L, Englund A, Adamson U, Lins PE. Increased QT dispersion during hypoglycaemia in patients with type 2 diabetes mellitus. J Intern Med. 1999 Sep;246(3):299– 307.
24. Gill GV, Woodward A, Casson IF, Weston PJ. Cardiac arrhythmia and nocturnal hypoglycaemia in type 1 diabetes—the “dead in bed” syndrome revisited. Diabetologia. 2009 Jan;52(1):42–5. 25. Wahab NN, Cowden EA, Pearce NJ, Gardner MJ, Merry H, Cox JL, et al. Is blood glucose an
independent predictor of mortality in acute myocardial infarction in the thrombolytic era? J Am Coll Cardiol. 2002 Nov 20;40(10):1748–54.
26. Meier JJ, Deifuss S, Klamann A, Launhardt V, Schmiegel WH, Nauck MA. Plasma glucose at hospital admission and previous metabolic control determine myocardial infarct size and survival in patients with and without type 2 diabetes: the Langendreer Myocardial Infarction and Blood Glucose in Diabetic Patients Assessment (LAMBDA). Diabetes Care. 2005 Oct;28(10):2551–3.
27. Yang S-W, Zhou Y-J, Hu D-Y, Nie X-M, Liu Y-Y, Hua Q, et al. Association between admission hypoglycaemia and in-hospital and 3-year mortality in older patients with acute myocardial infarction. Heart. 2010 Sep 1;96(18):1444–50.
28. Svensson A-M, McGuire DK, Abrahamsson P, Dellborg M. Association between hyper- and hypoglycaemia and 2 year all-cause mortality risk in diabetic patients with acute coronary events. Eur Heart J. 2005 Jul 1;26(13):1255–61.
29. Kosiborod M, Inzucchi SE, Krumholz HM, Xiao L, Jones PG, Fiske S, et al. Glucometrics in Patients Hospitalized With Acute Myocardial Infarction: Defining the Optimal Outcomes-Based Measure of Risk. Circulation. 2008 Feb 4;117(8):1018–27.
30. Mellbin LG, Malmberg K, Waldenstrom A, Wedel H, Ryden L, for the DIGAMI 2 investigators. Prognostic implications of hypoglycaemic episodes during hospitalisation for myocardial infarction in patients with type 2 diabetes: a report from the DIGAMI 2 trial. Heart. 2009 May 1;95(9):721–7.
31. Moghissi ES, Korytkowski MT, DiNardo M, Einhorn D, Hellman R, Hirsch IB, et al. American Association of Clinical Endocrinologists and American Diabetes Association Consensus Statement on Inpatient Glycemic Control. Diabetes Care. 2009 Jun 1;32(6):1119–31.
32. Nerenberg KA, Goyal A, Xavier D, Sigamani A, Ng J, Mehta SR, et al. Piloting a Novel Algorithm for Glucose Control in the Coronary Care Unit: The RECREATE (REsearching Coronary REduction by Appropriately Targeting Euglycemia) trial. Diabetes Care. 2012 Jan 1;35(1):19–24.
33. Kosiborod M, Inzucchi SE, Krumholz HM, Masoudi FA, Goyal A, Xiao L, et al. Glucose Normalization and Outcomes in Patients With Acute Myocardial Infarction. Arch Intern Med. 2009 Mar 9;169(5):438.
34. Service FJ, Molnar GD, Rosevear JW, Ackerman E, Gatewood LC, Taylor WF. Mean amplitude of glycemic excursions, a measure of diabetic instability. Diabetes. 1970 Sep;19(9):644–55. 35. Smith-Palmer J, Brändle M, Trevisan R, Orsini Federici M, Liabat S, Valentine W. Assessment
of the association between glycemic variability and diabetes-related complications in type 1 and type 2 diabetes. Diabetes Res Clin Pract. 2014 Sep;105(3):273–84.
36. Brownlee M, Hirsch IB. Glycemic variability: a hemoglobin A1c-independent risk factor for diabetic complications. JAMA. 2006 Apr 12;295(14):1707–8.
37. Hirsch IB. Glycemic Variability and Diabetes Complications: Does It Matter? Of Course It Does! Diabetes Care. 2015 Aug;38(8):1610–4.
38. Monnier L, Mas E, Ginet C, Michel F, Villon L, Cristol J-P, et al. Activation of Oxidative Stress by Acute Glucose Fluctuations Compared With Sustained Chronic Hyperglycemia in Patients With Type 2 Diabetes. JAMA. 2006 Apr 12;295(14):1681.
39. Torimoto K, Okada Y, Mori H, Tanaka Y. Relationship between fluctuations in glucose levels measured by continuous glucose monitoring and vascular endothelial dysfunction in type 2 diabetes mellitus. Cardiovasc Diabetol. 2013;12(1):1.
40. Azuma K. Repetitive Fluctuations in Blood Glucose Enhance Monocyte Adhesion to the Endothelium of Rat Thoracic Aorta. Arterioscler Thromb Vasc Biol. 2006 Oct 1;26(10):2275– 80.
41. Siegelaar SE, Holleman F, Hoekstra JBL, DeVries JH. Glucose variability; does it matter? Endocr Rev. 2010 Apr;31(2):171–82.
42. Mita T, Otsuka A, Azuma K, Uchida T, Ogihara T, Fujitani Y, et al. Swings in blood glucose levels accelerate atherogenesis in apolipoprotein E-deficient mice. Biochem Biophys Res Commun. 2007 Jul;358(3):679–85.
43. Dandona P. Minimizing Glycemic Fluctuations in Patients with Type 2 Diabetes: Approaches and Importance. Diabetes Technol Ther [Internet]. 2017 Aug 3 [cited 2017 Oct 25]; Available from: http://online.liebertpub.com/doi/10.1089/dia.2016.0372
44. Suh S, Kim JH. Glycemic Variability: How Do We Measure It and Why Is It Important? Diabetes Metab J. 2015;39(4):273.
45. Lachin JM, Genuth S, Nathan DM, Zinman B, Rutledge BN, for the DCCT/EDIC Research Group. Effect of Glycemic Exposure on the Risk of Microvascular Complications in the Diabetes Control and Complications Trial--Revisited. Diabetes. 2008 Apr 1;57(4):995–1001. 46. Tang X, Li S, Wang Y, Wang M, Yin Q, Mu P, et al. Glycemic variability evaluated by
continuous glucose monitoring system is associated with the 10-y cardiovascular risk of diabetic patients with well-controlled HbA1c. Clin Chim Acta. 2016 Oct;461:146–50.
47. Su G, Mi S, Tao H, Li Z, Yang H, Zheng H, et al. Association of glycemic variability and the presence and severity of coronary artery disease in patients with type 2 diabetes. Cardiovasc Diabetol. 2011;10(1):19.
48. Kataoka S, Gohbara M, Iwahashi N, Sakamaki K, Nakachi T, Akiyama E, et al. Glycemic Variability on Continuous Glucose Monitoring System Predicts Rapid Progression of Non-Culprit Lesions in Patients With Acute Coronary Syndrome. Circ J. 2015;79(10):2246–54. 49. Gohbara M, Hibi K, Mitsuhashi T, Maejima N, Iwahashi N, Kataoka S, et al. Glycemic
Variability on Continuous Glucose Monitoring System Correlates With Non-Culprit Vessel Coronary Plaque Vulnerability in Patients With First-Episode Acute Coronary Syndrome – Optical Coherence Tomography Study –. Circ J. 2016;80(1):202–10.
50. Teraguchi I, Imanishi T, Ozaki Y, Tanimoto T, Orii M, Shiono Y, et al. Impact of glucose fluctuation and monocyte subsets on coronary plaque rupture. Nutr Metab Cardiovasc Dis. 2014 Mar;24(3):309–14.
51. Gohbara M, Iwahashi N, Kataoka S, Hayakawa Y, Sakamaki K, Akiyama E, et al. Glycemic Variability Determined by Continuous Glucose Monitoring System Predicts Left Ventricular Remodeling in Patients With a First ST-Segment Elevation Myocardial Infarction. Circ J. 2015;79(5):1092–9.
52. Siegelaar SE, Kerr L, Jacober SJ, Devries JH. A Decrease in Glucose Variability Does Not Reduce Cardiovascular Event Rates in Type 2 Diabetic Patients After Acute Myocardial Infarction: A reanalysis of the HEART2D study. Diabetes Care. 2011 Apr 1;34(4):855–7. 53. Kilpatrick ES, Rigby AS, Atkin SL. For debate.Glucose variability and diabetes complication
risk: we need to know the answer: Glucose variability and complications. Diabet Med. 2010 Jul 15;27(8):868–71.
54. Lipska KJ, Venkitachalam L, Gosch K, Kovatchev B, Van den Berghe G, Meyfroidt G, et al. Glucose Variability and Mortality in Patients Hospitalized With Acute Myocardial Infarction. Circ Cardiovasc Qual Outcomes. 2012 Jul 1;5(4):550–7.
55. Mellbin LG, Malmberg K, Rydén L, Wedel H, Vestberg D, Lind M. The relationship between glycaemic variability and cardiovascular complications in patients with acute myocardial infarction and type 2 diabetes: a report from the DIGAMI 2 trial. Eur Heart J. 2013 Feb 1;34(5):374–9.
56. Su G, Mi S -h., Tao H, Li Z, Yang H-X, Zheng H, et al. Impact of Admission Glycemic Variability, Glucose, and Glycosylated Hemoglobin on Major Adverse Cardiac Events After Acute Myocardial Infarction. Diabetes Care. 2013 Apr 1;36(4):1026–32.
57. Su G, Mi S, Li Z, Tao H, Yang H, Zheng H. Prognostic value of early in-hospital glycemic excursion in elderly patients with acute myocardial infarction. Cardiovasc Diabetol. 2013;12(1):33.
58. Zhang X-L, Lu J-M, Shan G-L, Yang Z-J, Yang W-Y. Association between glucose variability and adverse in-hospital outcomes for Chinese patients with acute coronary syndrome. Saudi Med J. 2010 Oct;31(10):1146–51.
59. Wang X, Zhao X, Dorje T, Yan H, Qian J, Ge J. Glycemic variability predicts cardiovascular complications in acute myocardial infarction patients with type 2 diabetes mellitus. Int J Cardiol. 2014 Mar;172(2):498–500.
60. Xia J, Xu J, Li B, Liu Z, Hao H, Yin C, et al. Association between glycemic variability and major adverse cardiovascular and cerebrovascular events (MACCE) in patients with acute coronary syndrome during 30-day follow-up. Clin Chim Acta. 2017 Mar;466:162–6.
61. American Diabetes Association. Diagnosis and Classification of Diabetes Mellitus. Diabetes Care. 2010 Jan 1;33(Supplement_1):S62–9.
62. ESC Guidelines on diabetes, pre-diabetes, and cardiovascular diseases developed in collaboration with the EASD: The Task Force on diabetes, pre-diabetes, and cardiovascular diseases of the European Society of Cardiology (ESC) and developed in collaboration with the European Association for the Study of Diabetes (EASD). Eur Heart J. 2013 Oct 14;34(39):3035–87.
63. 2017 ESC Guidelines for the management of acute myocardial infarction in patients presenting with ST-segment elevation. Eur Heart J. 2017 Aug 26;00:1–66.
64. 2015 ESC Guidelines for the management of acute coronary syndromes in patients presenting without persistent ST-segment elevation: Task Force for the Management of Acute Coronary Syndromes in Patients Presenting without Persistent ST-Segment Elevation of the European Society of Cardiology (ESC). Eur Heart J. 2016 Jan 14;37(3):267–315.
65. Rodbard D. The Challenges of Measuring Glycemic Variability. J Diabetes Sci Technol. 2012 May;6(3):712–5.
66. Baghurst PA, Rodbard D, Cameron FJ. The Minimum Frequency of Glucose Measurements from Which Glycemic Variation Can Be Consistently Assessed. J Diabetes Sci Technol. 2010 Nov;4(6):1382–5.
67. Notice. Kidney Int Suppl. 2012 Mar;2(1):1.
68. Zuanetti G, Latini R, Maggioni AP, Santoro L, Franzosi MG. Influence of diabetes on mortality in acute myocardial infarction: data from the GISSI-2 study. J Am Coll Cardiol. 1993 Dec;22(7):1788–94.
69. DeVries JH. Glucose Variability: Where It Is Important and How to Measure It. Diabetes. 2013 May 1;62(5):1405–8.
70. Bragd J, Adamson U, Bäcklund LB, Lins PE, Moberg E, Oskarsson P. Can glycaemic variability, as calculated from blood glucose self-monitoring, predict the development of complications in type 1 diabetes over a decade? Diabetes Metab. 2008 Dec;34(6):612–6. 71. A Randomized Trial of Therapies for Type 2 Diabetes and Coronary Artery Disease. N Engl J
Med. 2009 Jun 11;360(24):2503–15.
72. The CREATE-ECLA Trial Group Investigators*. Effect of Glucose-Insulin-Potassium Infusion on Mortality in Patients With Acute ST-Segment Elevation Myocardial Infarction: The CREATE-ECLA Randomized Controlled Trial. JAMA. 2005 Jan 26;293(4):437.
73. Cheung NW, Wong VW, McLean M. The Hyperglycemia: Intensive Insulin Infusion in Infarction (HI-5) study: a randomized controlled trial of insulin infusion therapy for myocardial infarction. Diabetes Care. 2006 Apr;29(4):765–70.
74. Frontoni S, Di Bartolo P, Avogaro A, Bosi E, Paolisso G, Ceriello A. Glucose variability: An emerging target for the treatment of diabetes mellitus. Diabetes Res Clin Pract. 2013 Nov;102(2):86–95.
75. Rizzo MR, Barbieri M, Marfella R, Paolisso G. Reduction of Oxidative Stress and Inflammation by Blunting Daily Acute Glucose Fluctuations in Patients With Type 2 Diabetes: Role of dipeptidyl peptidase-IV inhibition. Diabetes Care. 2012 Oct 1;35(10):2076–82.
76. Barbieri M, Rizzo MR, Marfella R, Boccardi V, Esposito A, Pansini A, et al. Decreased carotid atherosclerotic process by control of daily acute glucose fluctuations in diabetic patients treated by DPP-IV inhibitors. Atherosclerosis. 2013 Apr;227(2):349–54.
77. Irace C, Fiorentino R, Carallo C, Scavelli F, Gnasso A. Exenatide Improves Glycemic Variability Assessed by Continuous Glucose Monitoring in Subjects with Type 2 Diabetes. Diabetes Technol Ther. 2011 Dec;13(12):1261–3.
78. Bajaj HS, Venn K, Ye C, Patrick A, Kalra S, Khandwala H, et al. Lowest Glucose Variability and Hypoglycemia Are Observed With the Combination of a GLP-1 Receptor Agonist and Basal Insulin (VARIATION Study). Diabetes Care. 2017 Feb;40(2):194–200.
79. Glucose Variability in a 26-Week Randomized Comparison of Mealtime Treatment With Rapid-Acting Insulin Versus GLP-1 Agonist in Participants With Type 2 Diabetes at High Cardiovascular Risk. Diabetes Care. 2016 Jun;39(6):973–81.
80. El-Laboudi AH, Godsland IF, Johnston DG, Oliver NS. Measures of Glycemic Variability in Type 1 Diabetes and the Effect of Real-Time Continuous Glucose Monitoring. Diabetes Technol Ther. 2016 Dec;18(12):806–12.
81. Marso SP, Daniels GH, Brown-Frandsen K, Kristensen P, Mann JFE, Nauck MA, et al. Liraglutide and Cardiovascular Outcomes in Type 2 Diabetes. N Engl J Med. 2016 Jul 28;375(4):311–22.