HAL Id: hal-00298085
https://hal.archives-ouvertes.fr/hal-00298085
Submitted on 23 Jul 2007
HAL is a multi-disciplinary open access
archive for the deposit and dissemination of
sci-entific research documents, whether they are
pub-lished or not. The documents may come from
teaching and research institutions in France or
abroad, or from public or private research centers.
L’archive ouverte pluridisciplinaire HAL, est
destinée au dépôt et à la diffusion de documents
scientifiques de niveau recherche, publiés ou non,
émanant des établissements d’enseignement et de
recherche français ou étrangers, des laboratoires
publics ou privés.
The LGM surface climate and atmospheric circulation
over East Asia and the North Pacific in the PMIP2
coupled model simulations
W. Yanase, A. Abe-Ouchi
To cite this version:
W. Yanase, A. Abe-Ouchi. The LGM surface climate and atmospheric circulation over East Asia and
the North Pacific in the PMIP2 coupled model simulations. Climate of the Past, European Geosciences
Union (EGU), 2007, 3 (3), pp.439-451. �hal-00298085�
www.clim-past.net/3/439/2007/
© Author(s) 2007. This work is licensed under a Creative Commons License.
Climate
of the Past
The LGM surface climate and atmospheric circulation over East
Asia and the North Pacific in the PMIP2 coupled model simulations
W. Yanase1and A. Abe-Ouchi1,21Center for Climate System Research, The University of Tokyo, Tokyo, Japan
2Frontier Research Center for Global Change, Japan Agency for Marine-Earth Science and Technology, Kanagawa, Japan
Received: 14 March 2007 – Published in Clim. Past Discuss.: 23 March 2007 Revised: 8 June 2007 – Accepted: 28 June 2007 – Published: 23 July 2007
Abstract. The surface conditions and atmospheric
circu-lation over East Asia and the North Pacific during the last glacial maximum have been investigated using outputs from several coupled atmosphere-ocean general circulation model in the PMIP2 database. During the boreal summer, the weak-ening of the high pressure system over the North Pacific and less precipitation over East Asia are found in most models. The latter can be attributed to reduced moisture transport. During the boreal winter, an intensification of the Aleutian low and southward shift of the westerly jet stream in the up-per troposphere are found in most models.
Some of the results in the present study seem to be con-sistent with the paleoclimatic reconstructions in the previ-ous studies: pollen and lake-status records suggest dry cli-mate over East Asia during the last glacial maximum, and part of the dust record has a signal that the East Asian winter monsoon was more strong and the westerly jet stream in the upper troposphere was further south during the last glacial maximum than at the present day. This result confirms that a coupled atmosphere-ocean general circulation model is a promising tool to understand not only the global climate but also the regional climate in the past.
1 Introduction
The paleoclimatic reconstruction shows that the last glacial maximum (LGM) was characterized by global atmospheric change due to large ice sheets over the high-latitude
con-tinents and reduced atmospheric CO2 concentration. Some
paleoclimatic reconstructions also show that the regional at-mosphere at LGM was different from that at the present day (PD). While North American, European, and the Atlantic
re-Correspondence to: W. Yanase
gion are considered to be directly influenced by the ice-sheet and modified thermohaline circulation, East Asian and the North Pacific region also appears to have experienced a re-gional climate change in spite of the distance from the ice-sheets. For example, according to the analysis and interpre-tation of the dust record over China (Donghuai, 2004), the westerly jet stream in the upper troposphere over East Asia during the LGM was further south than at the PD. In addi-tion, the lower-troposphere northerly wind associated with the East Asian winter monsoon was intensified during the LGM. Taken together, these characteristics imply that the circulation was regionally modified. The regional climate change over East Asia and the North Pacific is also reflected in the dry/wet signal that can qualitatively be estimated from the pollen-based vegetation and lake status records. Dur-ing the LGM, Eastern China was characterized by steppe or desert vegetation, and seems to have experienced a dry climate (Kohfeld and Harrison, 2000; Yu et al., 2000). Al-though there are no records associated with dry/wet signal over the North Pacific, the record over western North Amer-ica, that is the area closest to the eastern North Pacific, expe-rienced a wetter climate than the PD (Kohfeld and Harrison, 2000). However, since the number of sampling sites and the physical variables of the geological record are limited, the entire regional climatic structure cannot be obtained. Thus, the dynamic relation among the atmospheric and oceanic variables is not clear.
General circulation models (GCM) are a useful tool for investigating the horizontal distribution of atmospheric vari-ables, if it can successfully reproduce the climatic condition during the LGM that are estimated based on the geological record. In GCM simulations, the prescribed boundary condi-tions are the ice sheet distribution and the atmospheric CO2
concentration estimated from the geological record, and the solar insolation calculated based on Berger (1978). In the late 20th century, LGM experiments were performed using
atmospheric GCM (AGCM) in which the sea surface tem-perature (SST) estimated from the geological record is also prescribed.
It is interesting to note that most of these AGCM exper-iments show that the atmospheric circulation anomaly over the North Pacific during the LGM is cyclonic during both the boreal summer and winter (Kutzbach and Wright, 1985; Rind, 1987; Hall et al., 1996; Dong and Valdes, 1998; Vet-toretti et al., 2000); a cyclonic anomaly over the North Pacific implies a weakening in the high sea level pressure (SLP) dur-ing the summer, while it implies the intensification of the low SLP during the winter.
There have also been some experiments using AGCM cou-pled with a slab (or mixed-layer) ocean in which the model only calculates the change in the heat budget through the atmosphere-ocean interface but not the change in the oceanic circulation. The cyclonic LGM anomaly over the North Pa-cific during the boreal summer is also seen in such experi-ments (e.g. Dong and Valdes, 1998; Vettoretti et al., 2000), while the winter anomaly shows different tendencies: an anti-cyclonic anomaly in Broccoli and Manabe (1987) and Dong and Valdes (1998) and no clear anomaly in Vettoretti et al. (2000). In AGCM simulations, not only is there a lower tropospheric circulation but a precipitation pattern that is dif-ferent from that at the PD. During the LGM, it has been shown that the precipitation over East Asia remarkably de-creases during the boreal summer at LGM (?Kutzbach et al., 1998).
In recent years, some experiments using a coupled atmosphere-ocean GCM (CGCM) have been reported by Bush and Philander (1999), Kitoh and Murakami (2001a), Hewitt et al. (2003), Kim et al. (2003), and Shin et al. (2003). However, most of these studies only reported the an-nual average showing that the circulation anomaly over the North Pacific was cyclonic and the precipitation was reduced over East Asia. Only Shin et al. (2003) shows the seasonal anomaly during the LGM. This result suggests that the circu-lation anomaly over the North Pacific was cyclonic during the boreal summer and uncertain during the winter, while the precipitation over East Asia decreased. Thus, more sam-ples of CGCM experiments are necessary to discuss whether there is consistent tendency in the surface climate and the at-mospheric circulation over East Asia and the North Pacific during the summer and winter. In terms of the water bud-get, it would also be interesting to examine the water vapor and lower tropospheric circulation obtained from many of the CGCM.
Recently, the Paleoclimate Modeling Intercomparison Project Phase 2 (PMIP2) has defined a standard forcing for the LGM experiment in order to allow the various CGCMs to be compared and validation using the paleoclimatic re-constructions (e.g. Masson-Delomtte et al., 2006; Kageyama et al., 2006; Braconnot et al. , 2007; Hargreaves et al., 2007; Roche et al., 2007; Weber et al., 2007). The objective of this study is to investigate the surface climate and atmospheric
field over East Asia and the North Pacific during the LGM by comparing the results obtained using the different CGCMs in the PMIP2 database and the paleoclimatic reconstructions. Section 2 describes the experimental design and PMIP2 mod-els. Section 3 gives the climate change over East Asia and the North Pacific during the boreal summer and winter. The re-sults obtained in this study are compared with the previous studies and the paleoclimatic reconstructions in Sect. 4. As well, the water budget during the LGM is examined. Sec-tion 5 summarizes the results of this paper.
2 Models and experimental design
The simulation outputs from CGCM stored in the PMIP2 database for both the PD and the LGM experiments were examined. The following forcing and boundary conditions were different during the LGM than the PD: solar insolation, greenhouse gases, and ice-sheet distribution. The solar inso-lation for the LGM was estimated based on the Earth’s or-bital parameters 21 000 years before present (BP). The
con-centration of atmospheric CO2, which is the most dominant
greenhouse gas, was only 185 ppm during the LGM com-pared with the PD (preindustrial) value of 280 ppm. For both the PD and LGM, the albedo and topography is based on the ice-sheet distribution of the ICE-5G reconstruction (Peltier, 2004), which assumed that large ice-sheets cov-ered the high-latitude North America and Europe during the LGM. The detailed information about the forcing and bound-ary conditions can be obtained from the PMIP2 web site (http://www-lsce.cea.fr/pmip2/).
The outputs were analyzed from five CGCMs that are cur-rently available in the PMIP2 database: MIROC3.2 (here-after, referred to as MIROC), CCSM3 (CCSM), FGOALS-1.0g (FGOALS), HadCM3M2 (HADCM), and IPSL-CM4-V1-MR (IPSL). In addition to the five CGCMs with full com-plexity, an intermediate complexity model, ECBILT/CLIO (ECBILT), was analyzed, in which the horizontal resolution and vertical layers are minimized and the dynamics of the atmosphere is quasi-geostrophic.
The output was obtained by running the simulation for 100 years after the major adjustments to the forcings has been made in the atmosphere and ocean surface. The 100-year av-eraged value is used in this study. The confidence level for the anomaly during the LGM was examined using Student’s t-test with a sample of 25 years. The samples were deter-mined by taking every 4th sample from the 100-year data set for both the PD and the LGM experiments. In order to validate the result of PD simulations, the simulated results were compared with the climatological data by the ERA-40 reanalysis data (Uppala et al., 2005) using averaged monthly data between 1979 and 1999.
✂✁☎✄✝✆✟✞✡✠☞☛✌✎✍✡✏✑✄ ✎✒✓✄✝✆✔✞✕✠✖☛
✂✗✘✄✙✆✟✚✜✛✣✢✥✤ ✎✦✓✄✝✤✝✤✝✧✓✆
✂★✘✄✙✩✫✪✬✢✖✠☞✭✮✧ ✎✯✰✄✝✱☞✠✖✏✑✤✝✆
✂✲☎✄✝✚✜✍✕✧✓✭
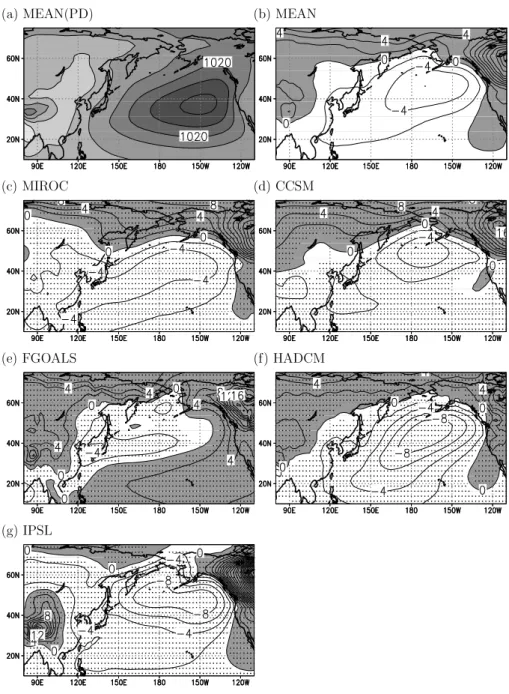
Fig. 1. Sea level pressure for JJA. (a) PD for model mean (the counter interval is 4 hPa); (b) Anomaly (LGM-PD) for the model mean (the
contour interval is 2 hPa); (c)–(g) same as (b) except for each model. In panels (b)–(g), the shades indicate a positive anomaly. In panels (c)–(g), the areas marked by dots have a difference in the anomaly at p≺0.05 using Student’s t-test. The output from the ECBILT model is not shown because the SLP data from the model was not available in the database.
3 Results
3.1 Boreal summer
Figure 1 shows the SLP averaged during the boreal summer, which consists of June, July and August, (JJA). Figure 1a shows the multi-model mean SLP for the PD. This result is identical to the high pressure actually observed over the North Pacific (the Pacific high). The calculated SLP
anoma-lies (LGM-PD) are shown in Figs. 1b–g. In each anomaly data, the global average of the data was removed, since only the horizontal contrast of the SLP is required to understand the lower tropospheric circulation in terms of the geostrophic wind balance. During the LGM, the SLP anomalies of the multi-model mean (Fig. 1b) and all the models (Fig. 1c–g) shows negative tendencies over a wide area of the North Pa-cific (p≺0.05), although the quantitative amplitudes and pat-terns are somewhat different among the models. This implies
✂✁☎✄✝✆✟✞✡✠☞☛✌✎✍✡✏✑✄ ✎✒✓✄✝✆✔✞✕✠✖☛
✂✗✘✄✙✆✟✚✜✛✣✢✥✤ ✎✦✓✄✝✤✝✤✝✧✓✆
✂★✘✄✙✩✫✪✬✢✖✠☞✭✮✧ ✎✯✰✄✝✱☞✠✖✏✑✤✝✆
✂✲☎✄✝✚✜✍✕✧✓✭ ✎✳✓✄✝✞✕✤✝✴✣✚✜✭✶✵
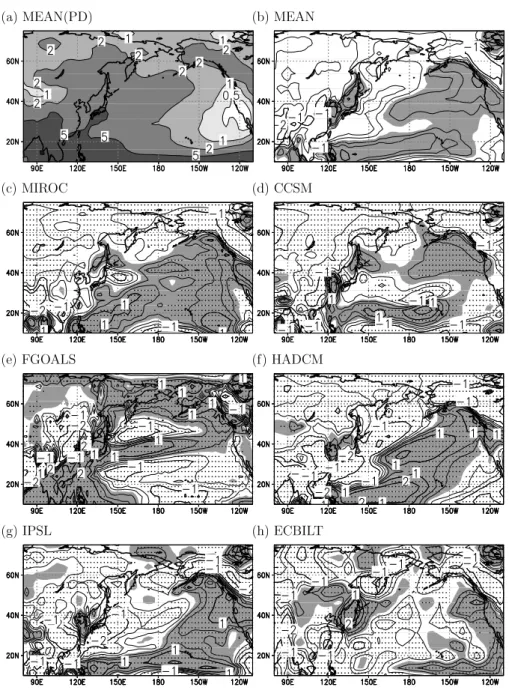
Fig. 2. Precipitation for JJA. (a) PD for model mean (the contours are drawn for 0.5, 1, 2, 5 and 10 mm/day); (b) Anomaly (LGM-PD) for
the model mean (the contours are drawn for ± 0.2, 0.5, 1 and 2 mm/day); (c)–(h) same as (b) except for each model. In panels (b)–(g), the shades indicate a positive anomaly. In panels (c)–(g), the areas marked by dots have a difference in the anomaly at p≺0.05 using Student’s t-test.
that the high pressures over the North Pacific was weakened during the LGM. This result was also found in the previous AGCM studies.
Figure 2 shows the average boreal summer precipitation. The multi-model mean for the PD (Fig. 2a) reproduces the precipitation field actually observed: the precipitation is heavy over East Asia and the western North Pacific, while it is light over the eastern North Pacific in subtopics and mid-latitudes. Figures 2c–h show the precipitation anomaly
dur-ing the LGM. Despite the rather large divergence between the models, most of the models seem to suggest that, during the LGM, the precipitation was smaller over East Asia than at the PD, while it was larger over the eastern North Pacific than at the PD. This characteristic is confirmed by the model-mean anomaly shown in Fig. 2b.
Next, the condition over East Asia that is located on the western edge of the weakened Pacific high and is char-acterized by the reduced precipitation during the LGM is
✂✁☎✄✝✆✞✁✠✟☛✡✌☞☎✍✏✎✒✑✝✁✓✂✑✕✔✗✖✙✘✛✚✢✜✣✄ ✂✤✒✄✝✆✞✁✠✟☛✡✌☞☎✍✏✎✒✑✝✁✓✂✘✛✚☛✜✦✥✧✑✕✔★✄ -1 0 1 2 3 4 5 6 20 30 40 50 60 Meridional Wind (m/s) latitude MIROC CCSM HADCM FGOALS IPSLMR ECBILT ERA40 -2.5 -2 -1.5 -1 -0.5 0 0.5 1 20 30 40 50 60 Meridional Wind (m/s) latitude MIROC CCSM HADCM FGOALS IPSLMR ECBILT ✂✩✠✄✧✑✕✪✬✫✭✩✭✮✰✯✒✮✱✟✲✁☎✤✴✳✵✫✷✶✸✁✹✟✲✫✭✪✢✺✑✻✔✗✖✼✘✛✚☛✜✣✄ ✂✽✒✄✷✑✕✪✬✫✭✩✭✮✰✯✒✮✱✟✲✁☎✤✴✳✵✫✷✶✸✁✹✟✲✫✭✪✢✺✘✾✚☛✜✿✥✧✑✕✔★✄ 0 10 20 30 40 50 60 20 30 40 50 60 Precipitable Water (kg/m2) latitude MIROC CCSM HADCM FGOALS IPSLMR -14 -12 -10 -8 -6 -4 -2 0 20 30 40 50 60 Precipitable Water (kg/m2) latitude miroc ccsm hadcm fgoals ipslmr
Fig. 3. Meridional distributions of physical variables over East Asia (averaged between 105◦E and 135◦E). (a) Meridional wind at 850 hPa (the unit is m/s) during the PD (black lines) and the LGM (gray lines); (b) Meridional wind anomaly (LGM-PD) at 850 hPa (the unit is m/s);
(c) Precipitable water (the unit is kg/m2) during the PD (black lines) and the LGM (gray lines); (d) Precipitable water anomaly (the unit is kg/m2).
examined. Figure 3 shows the meridional distributions of the meridional wind at 850 hPa and the precipitable water (vertically integrated water vapor amount) averaged between
105◦E–135◦E for the PD, the LGM, and the anomaly. The
large precipitation over East Asia at PD is considered to be associated with the moisture transport by the southerly flow during this season (Fig. 3a). During the LGM, most models simulate weakened southerly winds over this region. This characteristic is found as negative anomalies for the meridional wind (Fig. 3b). It is expected that the water va-por amount is different between the PD and the LGM due to the different meridional wind which transports the mois-ture. Figure 3c (black lines) shows the precipitable water at the PD. Since there is a remarkable meridional gradient with large amounts of water vapor in the lower latitudes, the southerly flow shown in Fig. 3a transports the water vapor to the higher latitude. During the LGM (see Fig. 3d), the precipitable water decreased in all the models. Thus, the anomaly of precipitation seems to partly explained by the change of the meridional transport of moisture. In order to further understand the dynamics associated with this precipi-tation change, a detailed water budget analysis using the out-put of one model will be considered in Sect. 4.2.
3.2 Boreal winter
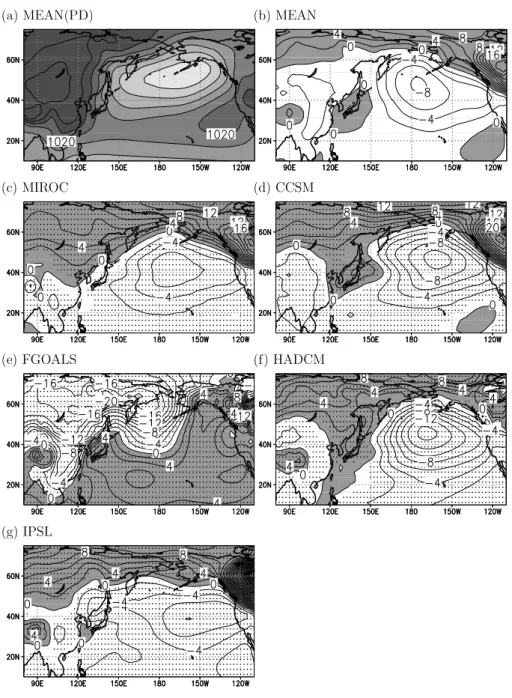
Figure 4 shows the SLP averaged in boreal winter, which consists of December, January, and February (DJF). Fig-ure 4a shows the multi-model mean SLP at the PD. As can be seen in this figure, the models reproduce a low pressure over the North Pacific (the Aleutian low) and high pressure over Asia (the Siberian high). Figure 4b shows the LGM multi-model mean SLP anomaly, while Figs. 4c–g show the indi-vidual model SLP anomaly during the LGM. As can be seen from Figs. 4c–g, all the models show a negative anomaly over the North Pacific (p≺0.05). This implies that the Aleutian low, which was simulated in the PD experiments, was inten-sified. The same result was seen in many previous AGCM simulations. It should be noted that the quantitative ampli-tudes and horizontal patterns of the anomalies vary among the models.
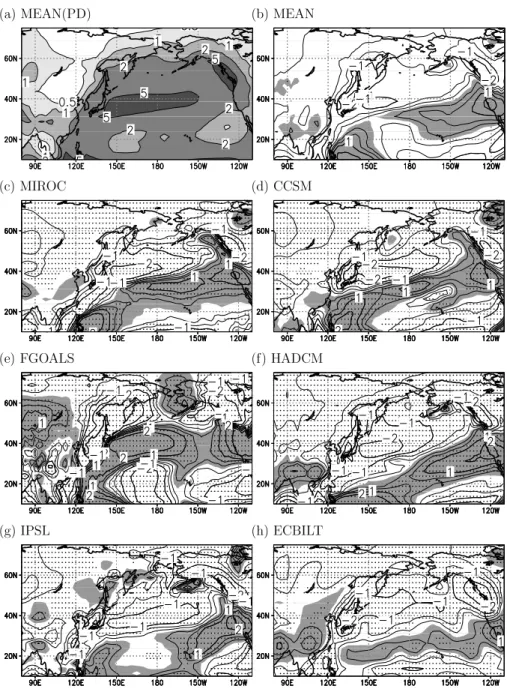
Figure 5 shows the average boreal winter precipitation. Figure 5a shows the multi-model mean PD precipitation. From this figure, the models reproduce a zone of heavy precipitation extending along a latitude of about 40◦N
dur-ing the boreal winter. This seems to result from the
✂✁☎✄✝✆✟✞✡✠☞☛✌✎✍✡✏✑✄ ✎✒✓✄✝✆✔✞✕✠✖☛
✂✗✘✄✙✆✟✚✜✛✣✢✥✤ ✎✦✓✄✝✤✝✤✝✧✓✆
✂★✘✄✙✩✫✪✬✢✖✠☞✭✮✧ ✎✯✰✄✝✱☞✠✖✏✑✤✝✆
✂✲☎✄✝✚✜✍✕✧✓✭
Fig. 4. Same as in Fig. 1 except for DJF.
track. Figure 5b shows the multi-model mean precipitation anomaly during the LGM, while Figs. 5c–h show the indi-vidual model precipitation anomaly during the LGM. Dur-ing the LGM, the multi-model mean precipitation anomaly is positive on the southern and eastern sides of the PD mid-latitude precipitation maximum, but negative on the northern and western sides. The tendency can also be seen in most of the individual model anomalies including the intermedi-ate complexity model, ECBILT. This implies that the mid-latitude precipitation maximum shifted southward and east-ward during the LGM. On the other hand, over East Asia, during the LGM, the boreal winter precipitation anomaly is
small compared with the boreal summer anomaly. Thus, the annual precipitation anomaly over East Asia is dominantly explained by the summer anomaly.
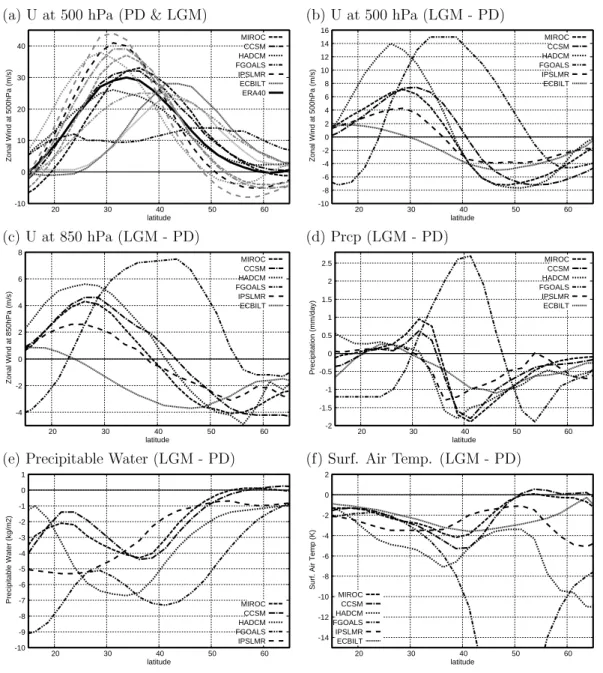
Figure 6, the meridional distribution of several atmo-spheric variables over the North Pacific for all the models.
The values are averaged for longitudes between 150◦E and
150◦W. At PD, zonal winds at 500 hPa (Fig. 6a, black lines) are shown by most models as a westerly jet stream axis lo-cated between 30◦N and 40◦N. This is consistent with the ERA-40 reanalysis data (thick solid black line in Fig. 6a). The westerly jet stream in the upper-troposphere corresponds approximately to the meridional temperature gradient under
✂✁☎✄✝✆✟✞✡✠☞☛✌✎✍✡✏✑✄ ✎✒✓✄✝✆✔✞✕✠✖☛
✂✗✘✄✙✆✟✚✜✛✣✢✥✤ ✎✦✓✄✝✤✝✤✝✧✓✆
✂★✘✄✙✩✫✪✬✢✖✠☞✭✮✧ ✎✯✰✄✝✱☞✠✖✏✑✤✝✆
✂✲☎✄✝✚✜✍✕✧✓✭ ✎✳✓✄✝✞✕✤✝✴✣✚✜✭✶✵
Fig. 5. Same as in Fig. 2 except for DJF.
the thermal wind balance, the storm track, and the mid-latitude precipitation maximum. During the LGM, the mag-nitude of zonal winds at 500 hPa (gray lines) was larger than that at the PD, and the location of the maximum shifted southward. The southward shift of the jet stream can be seen more apparently in the LGM zonal wind anomalies (Fig. 6b): the anomalies were positive on the southern side of the PD jet stream in most models, while it is negative on the north-ern side. The anomalies of westerly wind at 850 hPa (Fig. 6c) show the pattern similar to those at 500 hPa but with smaller amplitudes. As seen in Fig. 5, the precipitation anomalies
during the LGM (Fig. 6d) increased around 30◦N and
de-creased around 40◦N, which is consistent with the zonal
wind anomaly at 500 hPa in that the southward shift of the storm-track accompanied by the westerly jet stream results in more precipitation on the southern side of the PD precipita-tion maximum. Since, during the LGM, the precipitable wa-ter (Fig. 6e) decreases over the sub-tropics and mid-latitudes in all the models, the water vapor anomaly does not explain the precipitation anomaly. Instead, the precipitation anomaly seems to be consistent with the interpretation that the dy-namic effect such as the storm track is related to the precipita-tion anomaly. The negative surface air temperature anomaly during the LGM (Fig. 6f) is seen in all the models at latitudes
✂✁☎✄✝✆✞✁✠✟☛✡✌☞☎☞✎✍✑✏✒✁✓✂✏✕✔✗✖✙✘✛✚✢✜✣✄ ✂✤✑✄✝✆✞✁✠✟☛✡✌☞☎☞✎✍✑✏✒✁✓✂✘✛✚☛✜✦✥✧✏✕✔★✄ -10 0 10 20 30 40 20 30 40 50 60
Zonal Wind at 500hPa (m/s)
latitude MIROC CCSM HADCM FGOALS IPSLMR ECBILT ERA40 -10 -8 -6 -4 -2 0 2 4 6 8 10 12 14 16 20 30 40 50 60
Zonal Wind at 500hPa (m/s)
latitude MIROC CCSM HADCM FGOALS IPSLMR ECBILT ✂✩✠✄✧✆✞✁✠✟☛✪✌✡☎☞✎✍✑✏✒✁✓✂✘✛✚☛✜✦✥✧✏✕✔★✄ ✂✫✑✄✝✏✕✬✭✩✯✮✰✂✘✛✚✢✜✦✥✧✏✕✔★✄ -4 -2 0 2 4 6 8 20 30 40 50 60
Zonal Wind at 850hPa (m/s)
latitude MIROC CCSM HADCM FGOALS IPSLMR ECBILT -2 -1.5 -1 -0.5 0 0.5 1 1.5 2 2.5 20 30 40 50 60 Precipitation (mm/day) latitude MIROC CCSM HADCM FGOALS IPSLMR ECBILT ✂✱✠✄✧✏✕✬✭✱✯✩✯✲✳✮✑✲✴✟✵✁☎✤✷✶✸✱✝✹✺✁✻✟✵✱✯✬✢✼✘✽✚☛✜✾✥✧✏✕✔★✄ ✂✿❀✄✝❁✑❂✑✬✭✿❄❃✝❅❆✲✳✬✧❇✽✱✯❈✎✮✑❃❉✂✘✛✚☛✜✾✥✧✏❊✔★✄ -10 -9 -8 -7 -6 -5 -4 -3 -2 -1 0 1 20 30 40 50 60 Precipitable Water (kg/m2) latitude MIROC CCSM HADCM FGOALS IPSLMR -14 -12 -10 -8 -6 -4 -2 0 2 20 30 40 50 60
Surf. Air Temp (K)
latitude MIROC CCSM HADCM FGOALS IPSLMR ECBILT
Fig. 6. Meridional distributions of physical variables over the North Pacific (averaged between 150◦E and 150◦W). (a) Zonal wind at 500 hPa (the unit is m/s) during the PD (black lines) and the LGM (gray lines); (b) Zonal wind anomaly (LGM-PD) at 500 hPa (the unit is m/s); (c) Zonal wind anomaly at 850 hPa (the unit is m/s); (d) Precipitation anomaly (the unit is mm/day); (e) Precipitable water anomaly (the unit is kg/m2); (f) Surface air temperature anomaly (the unit is degrees Celsius).
lower than 50◦N and in some models even at the latitudes
greater than 50◦N. In detail, all the models show largest
neg-ative temperature anomaly between 30◦N and 50◦N, which
is located near the westerly jet stream axis in the upper tro-posphere. Since the thermal wind balance results in the west-erly (eastwest-erly) vertical-shear anomaly on the southern (north-ern) side of the largest negative temperature anomaly, this is consistent with the southward shift of the the westerly jet stream in the upper troposphere (Fig. 6b). The largest neg-ative temperature anomaly at the mid-latitudes is more
re-markable on the western side of the North Pacific than on the eastern side (not shown).
4 Discussions
4.1 General characteristics during a boreal summer
During a LGM summer, all the CGCMs show a weaken-ing of the Pacific high (Fig. 1). This characteristic is also seen in many AGCM experiments both with prescribed SST
(Kutzbach and Wright, 1985; Rind, 1987; Hall et al., 1996; Dong and Valdes, 1998; Vettoretti et al., 2000) and computed SST using a mixed-layer model (Dong and Valdes, 1998; Vettoretti et al., 2000). Therefore, this seems to be a rela-tively robust characteristic of LGM simulations using both AGCM and CGCM. Unfortunately, there are few direct ge-ological records that show the tendency of the atmospheric circulation over the ocean.
In most CGCMs, the precipitation over East Asia de-creases during the LGM (Fig. 2). This is also seen in the previous experiments by AGCM with prescribed SST (Hall et al., 1996; Dong and Valdes, 1998; Liu et al., 2002) and with computed SST using mixed-layer model (Dong and Valdes, 1998) and by CGCM (Shin et al., 2003). Since the precipitation and its anomaly is dominant in summer over East Asia, this tendency is consistent with the paleoclimatic reconstruction that shows a dry climate over East Asia dur-ing the LGM (Kohfeld and Harrison, 2000; Yu et al., 2000). The weakened southerly flow over East Asia (Fig. 3b) seems to be related to a reduction in precipitable water (Fig. 3d) and, thus, precipitation over this region due to a decrease in the southerly moisture transport. In order to confirm this dy-namics, the horizontal distributions of the water budgets are examined in Sect. 4.2. On the other hand, the anomaly of southerly flow during the LGM occurs on the western edge of the weakened high pressure over the North Pacific. The reason why the high pressure over the North Pacific is weak-ened in most LGM simulations should also be determined using a sensitivity experiment and discussed based on the-oretical studies on the formation mechanism of subtropical high (e.g. Rodwell and Hoskins, 2001; Miyasaka and Naka-mura, 2005) in a future study.
4.2 Water budget analysis during a boreal summer
Section 3.1 showed that the reduction in precipitation over East Asia during JJA was associated with the reduction in southerly wind and less water vapor in this region. However, this explanation does not sufficiently explain the exact wa-ter balance over East Asia and the dynamics related to the larger areas. Thus, in this section, the horizontal distribu-tion in the difference of the water budget between the PD and the LGM over East Asia and the North Pacific will be considered. The output from the MIROC simulation, which is performed in Japanese institutes that included the author of this paper, was used. The LGM tendencies of reduction in precipitation, weaker southerly flow, and less water vapor over East Asia during JJA, which are simulated by most of the CGCMs (Figs. 2 and 3), are also found in the MIROC simulation.
The budget for the vertically integrated water vapor, that is precipitable water, Q≡R ρqdz, is described as
∂Q
∂t =H ADV − P RCP + EV AP , (1)
where H ADV is the horizontal advection of water vapor defined as R −→∇ ·(ρq−→v )dz, P RCP is the removal by
pre-cipitation, and EV AP is the moisture supply by surface evaporation. Assuming that ∂Q∂t is negligible for the aver-age from June to August, the relationship that gives the dif-ferences between the LGM and the PD in the precipitation (1P RCP ), evaporation (1EV AP ) and horizontal advec-tion (1H ADV ) is given as
1P RCP = 1EV AP + 1H ADV (2)
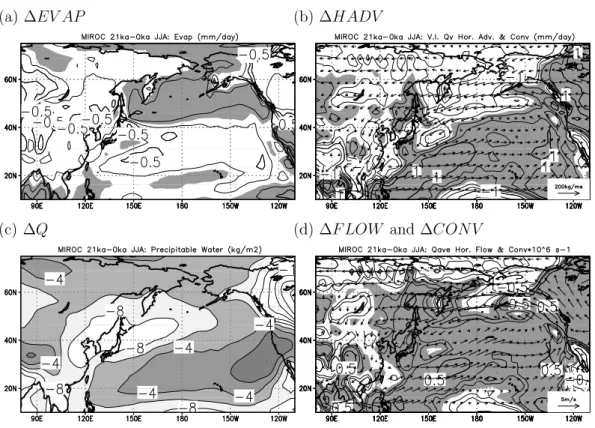
Figure 7a shows 1EV AP during JJA. Over East Asia, the evaporation was reduced, which is consistent with a reduc-tion in precipitareduc-tion in terms of Eq. (2). It should be noted that this result does not imply a simple causal relationship: when the precipitation over a region is reduced by a certain reason, the ground in this region contains less water, which, in turn, results in a reduction in the atmospheric water va-por and precipitation due to the reduction in the evava-poration of the ground water to the atmosphere. Over the North Pa-cific, the evaporation decreases at the latitudes lower than 40◦N, while it increases at the higher latitudes. The reduced evaporation over the low-latitude ocean seems to simply re-flect the less water vapor holding in the atmosphere under the LGM lower atmospheric temperature. On the other hand, the increased evaporation over the high-latitude ocean, is con-sidered to result from the extremely drier atmosphere in this region than expected from a decrease in the atmospheric tem-perature. This extremely drier atmosphere during the LGM seems to be related to the water vapor transport demonstrated later in Figs. 7b–d. In Fig. 7b, the anomaly of horizontal water vapor advection (1H ADV ) shows a contrast between East Asia and the North Pacific, which is similar to the pre-cipitation anomaly (Fig. 2c). Over East Asia, the negative anomaly is relatively dominant while the positive anomaly is dominant over the subtropical North Pacific. From these re-sults, it can be concluded that water vapor transport caused the precipitation change over East Asia and the North Pa-cific. As well, it was shown that the evaporation reinforces the transport effect over East Asia, but it cancels the transport effect over the high-latitude North Pacific.
Since H ADV depends on both the amount of water vapor (Q) and the convergence of the wind which transports the water vapor (referred to as the effect of CON V ), these two effects need to be separated in order to further understand the dynamics. For example, Knutson and Manabe (1995) com-pared the two effects when they analyzed the change in the
water cycle under the increased atmospheric CO2 climate.
Partly based on the previous studies, the effect of CON V can be separated as follows
H ADV ≡ Q · CON V . (3)
Thus, the difference of H ADV is given as
✂✁☎✄✝✆✟✞✡✠☞☛✍✌ ✏✎✑✄✝✆✟✒✓☛✍✔✕✠
✂✖✗✄✘✆✟✙ ✏✚✑✄✝✆✟✛✡✜✣✢✥✤ ✁☎✦✑✚✧✆✟★✡✢✡✩✪✠
Fig. 7. The LGM anomalies associated with the water budget during JJA using the output from the MIROC model (1P RCP in the MIROC
model is given in Fig. 2c). (a) 1EV AP (the contours are drawn for ±0.2, 0.5, 1 and 2 mm/day). The shades indicate a positive anomaly.
(b) Same as (a) but for 1H ADV (contour) in Eq. (2). The shades indicate a positive anomaly. The arrows indicate water vapor flux. (c) 1Q
in Eq. (4) (contour interval is 2 kg/m2). (d) 1F LOW in Eq. (5) (arrow) and 1CON V in Eq. (4) (the contours are drawn for ±0.1, 0.2 and 0.5×10⁻⁶s−1). The shades indicate a positive anomaly.
where the term 1Q1(CON V ) is neglected. We also define the vector−−−−→F LOW
−−−−→ F LOW ≡ R ρq−→v dz R ρqdz . (5)
which is the wind averaged in the levels where the water va-por amount is large (usually the lower troposphere). Fig-ure 7c shows 1Q for JJA. Over East Asia, as Fig. 3d also shows, Q decreases, which is consistent with a reduction in precipitation over this region. On the other hand, over the North Pacific, the magnitude of 1Q is small, which seems to difficult to explain the 1H ADV that is more remark-able in this region than over East Asia (Fig. 7b). Figure 7d shows 1CON V and 1F LOW . Over the North Pacific, the 1CON V is positive and, thus, indicates a convergent tendency, which results in the increased precipitation. Over East Asia, neither a convergence nor a divergence tendency is dominant. Therefore, the reduced precipitation over East Asia results from less water vapor, not from a divergence of flow. Note that the southward anomaly of F LOW over East Asia is consistent with the meridional wind anomaly at 850 hPa shown in Fig. 3b. In conclusion, compared with the PD climate situation, during the LGM, the water vapor
trans-port from the south during JJA decreases. This in turn results in less water vapor and, thus, precipitation over East Asia.
The atmospheric circulation tendency is associated with a weakened subtropical high over the North Pacific during JJA (Fig. 1). When the subtropical high is weakened, the diver-gent flow near the center of the high is suppressed and the northward flow on the western edge of the high is reduced. It should be noted that the sea level pressure over Asia shows no tendency to intensify or weaken (Fig. 1). This implies that the change in cyclonic circulation around the Tibetan plateau during a PD summer cannot explain the northerly anomaly on its eastern edge, that is, over East Asia and the western North Pacific.
Since the seasonally-averaged physical variables were used, the transient eddy effects appear as a residual term in Eq. (2). An analysis of the residual term showed that it is less dominant during JJA than during DJF. During DJF, the tran-sient eddy in the active storm track seems to play an impor-tant role in water transport as will be discussed in Sect. 4.3.
4.3 General characteristics during a boreal winter
All the CGCMs show, during the LGM boreal winter, the negative pressure anomaly existed over the North Pacific, al-though the patterns and amplitudes vary among the models (Fig. 4). On the other hand, over East Asia, the Siberian high shows no clear tendency. These results suggest that the ten-dency of East Asian winter monsoon at LGM was controlled by the tendency of the Aleutian low over the North Pacific rather than the Siberian high over East Asia. This could be useful information to interpret the geological record of dust transport that suggests that the East Asian winter monsoon was intensified during the LGM (Donghuai, 2004).
The negative pressure anomaly is also seen in some AGCM simulations (Kutzbach and Wright, 1985; Rind, 1987; Hall et al., 1996; Vettoretti et al., 2000), although other AGCM (Broccoli and Manabe, 1987; Dong and Valdes,
1998) give positive anomalies. The negative pressure
anomaly is also associated with the westerly tendency at the latitudes lower than 40◦N and easterly tendency at the lat-itudes greater than 40◦N in zonal wind over the Pacific at 850 hPa (Fig. 6c). At 500 hPa (Fig. 6b), most models show a southward shift of westerly jet stream, which is also seen in some AGCM simulations (Kutzbach and Wright, 1985; Rind, 1987; Hall et al., 1996) and not in others (Dong and Valdes, 1998). Since the westerly jet stream in the upper troposphere is related to the storm-track and, hence, to the mid-latitude precipitation maximum during the winter, the southward shift of the jet stream axis is consistent with the southward shift of the precipitation maximum. During the LGM, an increase in precipitation compared with the PD sit-uation is seen on the eastern side of the maximum. During the winter, this shift results in the heavy precipitation over western North America. Since the precipitation anomaly dur-ing the summer is also positive over western North America, this is consistent with the paleoclimatic reconstructions that the western North America experienced a wet climate dur-ing the LGM (Kohfeld and Harrison, 2000). It should also be noted that the eastward shift of the storm track had been found in AGCM simulations (Kageyama et al., 1999).
During the LGM, the surface air temperature over the
Pa-cific shows maximum negative anomaly between 30◦N and
50◦N (Fig. 6f). This characteristic is more remarkable in
the western North Pacific than in the eastern North Pacific (not shown). Since this pattern is also seen in annual-mean SST anomaly field, this is consistent with the paleoclimatic reconstructions in that the surface temperature decreases re-markably in the mid-latitude western North Pacific (Oba and Murayama, 2004).
Future study should investigate the dynamics of the neg-ative SLP anomaly, the southward shift of the westerly jet stream in the upper troposphere, the southward shift in pre-cipitation maximum, and mid-latitude temperature decrease. It should be noted that the relation among these variables in the LGM simulations is similar to the currently observed
Fig. 8. The H¨ovmoller (meridional-month) diagram of precipitation
anomaly (contour interval is 0.2 mm/day) over East Asia (averaged between 105◦E and 135◦E).
decadal variability over the North Pacific. Although the signs of all fields are inverted, Nakamura et al. (2004) demon-strated that a negative SST anomaly at mid-latitude corre-sponds with a cyclonic surface wind anomaly, and intensi-fied (weakened) storm track activity at the latitudes lower
(higher) than about 45◦N. Further studies should be
con-ducted in determining the relationship, if any, between the LGM anomaly patterns and the decadal variation patterns.
5 Conclusions
The atmospheric field over East Asia and the North Pacific during the LGM was investigated using the outputs from dif-ferent CGCMs, which are available on the PMIP2 web-site. During the boreal summer, a weakening of the high SLP over the North Pacific was found in most CGCM models. Simi-lar results had been obtained in previous AGCM simulations. As well, a reduction in the precipitation over East Asia during the LGM was also simulated in most CGCMs. This result is consistent with the pollen and lake-status records. The water budget analysis suggests that, during the LGM, a reduction in moisture transport resulted in less precipitation over East Asia, while the evaporation from the land surface reinforced the tendency.
During the boreal winter, an intensification of the Aleutian low and a southward shift of the westerly jet stream in the upper-troposphere was present in most CGCM models. This result is consistent with the dust record. The precipitation
maximum at the mid-latitude shifted southward. This seems to be related to the southward shift of westerly jet stream based on a corresponding shift in the storm track.
This paper has not considered the atmospheric circulation mechanism over the North Pacific during the LGM. The
ef-fect of the ice sheet topography/albedo, atmospheric CO2
concentration, and solar insolation on the atmospheric circu-lation need to be examined. In order to examine these effects separately, sensitivity experiments are being performed. Al-though detailed results will be presented in a future paper, it currently appears that the effect of reduced atmospheric
CO2 concentration during the LGM is less crucial than the
mechanical and thermal effects of ice sheets not only on the climate over the neighboring region of the North American and northern European ice sheets but also on the climate over East Asia and the North Pacific. This implies that the re-gional climatic change over East Asia and the North Pacific during the LGM, which is associated with a decrease in the atmospheric CO2, does not necessarily result in an opposite
signal compared with a global warming simulation, which is associated with an increase in the atmospheric CO2.
Most of the results of CGCM simulations in this paper are similar to the results of previous AGCM simulations. However, this does not imply that the ocean feedback does not play an important role for the atmospheric circulation anomaly, since the SST anomaly during the LGM based on the paleoclimatic reconstruction is prescribed in such AGCM simulations. Therefore, the influence of thermal and dy-namical ocean feedbacks should be examined carefully us-ing fixed-SST AGCM, slab-ocean-coupled AGCM, and full-ocean-coupled AGCM (CGCM). These simulations are cur-rently performed in our group.
Another future work is to examine the seasonality under the climate change during the LGM. For example, Fig. 8 shows the H¨ovmoller (meridional-month) diagram of the precipitation anomaly over East Asia. While the negative precipitation anomaly at the low latitudes is most remarkable (less than −0.8 mm/day) during the boreal summer, the neg-ative anomaly persists in the following season (autumn). The anomaly is uncertain during the boreal winter and spring. Thus, the seasonality of precipitation, horizontal wind and other variables should be examined considering the mon-soon onset/offset and meridional movement of the upper-tropospheric westerly jet stream.
Acknowledgements. We acknowledge the international modeling
groups for providing their data for analysis, the Laboratoire des Sci-ences du Climat et de l’Environnement (LSCE) for collecting and archiving the model data. The PMIP2/MOTIF Data Archive is sup-ported by CEA, CNRS, the EU project MOTIF (EVK2-CT-2002-00153) and the Programme National d’Etude de la Dynamique du Climat (PNEDC). The analyses were performed using version 01-30-2006 of the database. More information is available on http://pmip2.lsce.ipsl.fr/ and http://motif.lsce.ipsl.fr/.
The present research is supported in part by a Grant for the 21st Century COE Program “Predictability of the Evolution and
Variation of the Multi-scale Earth System” from the Ministry of Education, Culture, Sports, Science, and Technology of Japan and by Grant-in-Aid for Scientific Research No. 16340136, Japan Society for the Promotion of Science.
Edited by: P. Braconnot
References
Berger, A. L.: Long-term variations of Caloric insolation resulting form the Earth’s orbital elements, Quart. Res., 9, 139–167, 1978. Braconnot, P., Otto-Bliesner, B., Harrison, S., Joussaume, S, Pe-terchmitt, J.-Y., Abe-Ouchi, A., Crucifix, M., Driesschaert, E., Fichefet, Th., Hewitt, C. D., Kageyama, M., Kitoh, A., Laˆın´e, A., Loutre, M.-F., Marti, O., Merkel, U., Ramstein, G., Valdes, P., Weber, L., Yu, Y., and Zhao, Y.: Results of PMIP2 coupled simulations of the mid-Holocene and Last Glacial Maximum – Part 1: experiments and large-scale features, Clim. Past, 3, 261– 277, 2007,
http://www.clim-past.net/3/261/2007/.
Broccoli, A. J. and Manabe, S.: The influence of continental ice, at-mospheric CO2, and land albedo on the climate of the last glacial
maximum, Clim. Dyn., 1, 87–99, 1987.
Bush, A. B. G. and Philander, S. G. H.: The climate of the Last Glacial Maximum: Results from a coupled atmosphere-ocean general circulation model, J. Geophys. Res., 104, 24 509–24 525, 1999.
Dong, B. and Valdes, P. J.: Simulations of the Last Glacial Maxi-mum climates using a general circulation model: prescribed ver-sus computed sea surface temperatures, Clim. Dyn., 14, 571– 591, 1998.
Donghuai, S.: Monsoon and westerly circulation changes recorded the Late Cenozoic aeolian sequences of Northern China, Global Planet. Change, 41, 63–80, 2004.
Hall, N. M. J., Valdes, P. J., and Dong, B.: The maintenance of the last great ice sheets: a UGAMP GCM study, J. Clim., 9, 1004– 1009, 1996.
Hargreaves, J. C., Abe-Ouchi, A., and Annan J. D.: Linking glacial and future climates through an ensemble of GCM simulations, Clim. Past, 3, 77–87, 2007,
http://www.clim-past.net/3/77/2007/.
Hewitt, C. D., Stouffer, R. J., Broccoli, A. J., Mitchell, J. F. B., and Valdes, P. J.: The effect of ocean dynamics in a coupled GCM simulation of the Last Glacial Maximum, Clim. Dyn., 20, 203– 218, 2003.
Kageyama, M., Valdes, P. J., Ramstein, G., Hewitt, C., and Wy-putta, U.: Northerm hemisphere storm tracks in present day and last glacial maximum climate simulations: a comparison of the European PMIP models, J. Clim., 12, 742–760, 1999.
Kageyama, M., Laˆın´e, A., Abe-Ouchi, A., Braconnot, P., Cortijo, E., Crucifix, M., deVernal, A., Guiot, J., Hewitt, C. D., Ki-toh, A., Kucera, M., Marti, O., Ohgaito, R., Otto-Bliesner, B., Peltier, W. R., Rosell-Mel´e, A., Vettoretti, G., Weber, S. L., Yu, Y., and MARGO Project Members: Last Glacial Maxi-mum temperatures over the North Atlantic, Europe, and west-ern Siberia: A comparison between PMIP models, MARGO sea-surface temperatures and pollen-based reconstructions, Quater-nary Sci. Rev., 25, 2082–2102, 2006.
Kim, S., Flato, G. M., and Boer, G. J.: A coupled climate model simulation of the Last Glacial Maximum, Part 2: approach to equilibrium, Clim. Dyn., 20, 635–661, 2003.
Kitoh, A. and Murakami, S.: A simulation of the Last Glacial Max-imum with a coupled atmosphere-ocean GCM, Geophys. Res. Lett., 28, 2221–2224, 2001a.
Kitoh, A. and Murakami, S.: A simulation of the Last Glacial Max-imum with a coupled atmosphere-ocean GCM, Geophys. Res. Lett., 28, 2221–2224, 2001b.
Knutson, T. R. and Manabe, S.: Time-mean response over tropical pacific to increased CO2 in a coupled ocean-atmosphere model, J. Clim., 8, 2181–2199, 1995.
Kohfeld, K. E. and Harrison, S. P.: How well can we simulate past climates? Evaluating the models using global palaeoenvi-ronmental datasets, Quart. Sci. Rev., 19, 321–346, 2000. Kutzbach, J., Gallimore, R., Harrison, S., Behling, P., Selin, R., and
Laarif, F.: Climate and BIOME simulations for the past 21 000 years, Quart. Sci. Rev., 17, 473–506, 1998.
Kutzbach, J. E. and Wright, E.: Simulation of the climate of 18 000 years BP: results for the North American / North Atlantic/ Euro-pean sector and comparison with the geological record of North America, Quarternary Sci. Rev., 4, 147–185, 1985.
Liu, J., Yu, G., and Chen, X.: Paleoclimate simulation of 21 ka for the Tibetan Plateau and Eastern Asia, Clim. Dyn., 19, 575–583, 2002.
Masson-Delomtte, V., Kageyama, M., Braconnot, P., Charbit, S., Krinner, G., Ritz, C., Guilyardi, E., Jouzel, J., Abe-Ouchi, A., Crucifix, M., Gladstone, R. M., Hewitt, C. D., Kitoh, A., Ohgaito, R., Otto-Bliesner, B., Peltier, W. R., Ross, I., Valdes, P. J., Vettoretti, G., Weber, S. L., Wolk, F., and Y. Yu: Past and future polar amplification of climate change: climate model in-tercomparisons and ice-core constraints, Clim. Dyn., 27, 437– 440, 2006.
Miyasaka, T. and Nakamura, H.: Structure and formation mecha-nism of the northern hemisphere summertime subtropical highs, J. Clim., 18, 5046–5065, 2005.
Nakamura, H., Sampe, T., Tanimoto, Y., and Shimpo, A.: Ob-served associations among storm tracks, jet streams and midlati-tude oceanic fronts, Geophys. Mono. Ser., 147, 329–345, 2004. Oba, T. and Murayama, M.: Sea-surface temperature and salinity
changes in the northwest Pacific since the Last Glacial Maxi-mum, J. Quaternary Sci., 19, 335–346, 2004.
Peltier, W. R.: Global glacial isostasy and the surface of the ice-age Earth: the ICE-5G (VM2) model and GRACE, Ann. Rev. Earth Planet. Sci., 32, 111–149, 2004.
Rind, D.: Components of the ice age circulation, J. Geophys. Res., 92, 4241–4281, 1987.
Roche, D. M., Dokken, T. M., Goosse, H., Renssen, H., and We-ber, S. L.: Climate of the last glacial maximum: sensitivity stud-ies and model-data comparison with the LOVECLIM coupled model, Clim. Past, 3, 205–224, 2007,
http://www.clim-past.net/3/205/2007/.
Rodwell, M. J. and Hoskins, B. J.: Subtropical amticyclones and summer monsoons, J. Clim., 14, 3192–3211, 2001.
Shin, S. I., Liu, Z., Otto-Bliesner, B., Brady, E. C., Kutzbach, J. E., and Harrison, S. P.: A simulation of the Last Glacial Maximum climate using the NCAR-CCSM, Clim. Dyn., 20, 127–151, 2003. Uppala, S., Kallberg, P., Simmons, A., Andrae, U., da Costa Bech-told, V., Fiorino, M., Gibson, J., Haseler, J., Hernandez, A., Kelly, G., Li, X., Onogi, K., Saarinen, S., Sokka, N., Allan, R., Andersson, E., Arpe, K., Balmaseda, M., Beljaars, A., van de Berg, L., Bidlot, J., Bormann, N., Caires, S., Chevallier, F., De-thof, A., Dragosavac, M., Fisher, M., Fuentes, M., Hagemann, S., Holm, E., Hoskins, B., Isaksen, L., Janssen, P., Jenne, R., Mc-Nally, A., Mahfouf, J.-F., Morcrette, J.-J., Rayner, N., Saunders, R., Simon, P., Sterl, A., Trenberth, K., Untch, A., Vasiljevic, D., Viterbo, P., and Woollen, J.: The ERA-40 re-analysis, Quart. J. Roy. Meteor. Soc., 131, 2961–3012, 2005.
Vettoretti, G., Peltier, W. R., and McFarlane, N. A.: Global wa-ter balance and atmospheric wawa-ter vapor transport at last glacial maximum: climate simulations with the Canadian Climate Cen-ter for Modelling and Analysis atmospheric general circulation model, Can. J. Earth Sci., 37, 695–723, 2000.
Weber, S. L., Drijfhout, S. S., Abe-Ouchi, A., Crucifix, M., Eby, A., Ganopolski, S., Murakami, B., Otto-Bliesner, B., and Peltier, W. R.: The modern and glacial overturning circulation in the At-lantic ocean in PMIP, Clim. Past, 3, 51–64, 2007,
http://www.clim-past.net/3/51/2007/.
Yu, G., Chen, X., Ni, J., Cheddai, R., Guiot, J., H. Han, S. P. H., Huang, C., Ke, M., Kong, Z., Li, S., Li, W., Liew, P., Liu, G., Liu, J., Liu, Q., Liu, K.-B., Prentice, I. C., Qui, W., Ren, G., Song, C., Sugita, S., Sun, X., Tang, L., Campo, E. V., Xia, Y., Xu, Q., Yan, S., Yang, X., Zhao, J., and Zheng, Z.: Palaeovegetation of China: a pollen data-based synthesis for the mid-Holocene and last glacial maximum, J. Biogeogr., 27, 635–664, 2000.