HAL Id: hal-00328049
https://hal.archives-ouvertes.fr/hal-00328049
Submitted on 2 Mar 2007HAL is a multi-disciplinary open access
archive for the deposit and dissemination of sci-entific research documents, whether they are pub-lished or not. The documents may come from teaching and research institutions in France or abroad, or from public or private research centers.
L’archive ouverte pluridisciplinaire HAL, est destinée au dépôt et à la diffusion de documents scientifiques de niveau recherche, publiés ou non, émanant des établissements d’enseignement et de recherche français ou étrangers, des laboratoires publics ou privés.
Validation of MIPAS-ENVISAT NO2 operational data
G. Wetzel, A. Bracher, B. Funke, Florence Goutail, F. Hendrick, J.-C.
Lambert, S. Mikuteit, C. Piccolo, Michel Pirre, Ariane Bazureau, et al.
To cite this version:
G. Wetzel, A. Bracher, B. Funke, Florence Goutail, F. Hendrick, et al.. Validation of MIPAS-ENVISAT NO2 operational data. Atmospheric Chemistry and Physics Discussions, European Geo-sciences Union, 2007, 7 (2), pp.3333-3395. �10.5194/acpd-7-3333-2007�. �hal-00328049�
ACPD
7, 3333–3395, 2007 MIPAS NO2 validation G. Wetzel et al. Title Page Abstract Introduction Conclusions References Tables Figures ◭ ◮ ◭ ◮ Back CloseFull Screen / Esc
Printer-friendly Version Interactive Discussion
EGU
Atmos. Chem. Phys. Discuss., 7, 3333–3395, 2007 www.atmos-chem-phys-discuss.net/7/3333/2007/ © Author(s) 2007. This work is licensed
under a Creative Commons License.
Atmospheric Chemistry and Physics Discussions
Validation of MIPAS-ENVISAT NO
2
operational data
G. Wetzel1, A. Bracher2, B. Funke3, F. Goutail4, F. Hendrick5, J.-C. Lambert5, S. Mikuteit1, C. Piccolo6, M. Pirre7, A. Bazureau4, C. Belotti8, T. Blumenstock1, M. De Mazi `ere5, H. Fischer1, N. Huret7, D. Ionov4, M. L ´opez-Puertas3,
G. Maucher1, H. Oelhaf1, J.-P. Pommereau4, R. Ruhnke1, M. Sinnhuber2, G. Stiller1, M. Van Roozendael5, and G. Zhang1,*
1
Institut f ¨ur Meteorologie und Klimaforschung (IMK), Forschungszentrum Karlsruhe, Karlsruhe, Germany
2
Institute of Environmental Physics and Remote Sensing (IUP/IFE), University of Bremen, Bremen, Germany
3
Instituto de Astrof´ısica de Andaluc´ıa (IAA), Consejo Superior de Investigaciones Cientificas, Granada, Spain
4
Service d’A ´eronomie, CNRS, Verri `eres-le-Buisson, France 5
Belgian Institute for Space Aeronomy (IASB-BIRA), Brussels, Belgium 6
Oxford University, Oxford, UK 7
Laboratoire de Physique et Chimie de l’Environnement (LPCE), CNRS, Orl ´eans, France 8
IFAC-CNR, Firenze, Italy *
now at: Yantai University, Yantai, China
Received: 18 December 2006 – Accepted: 28 February 2007 – Published: 2 March 2007 Correspondence to: G. Wetzel ([email protected])
ACPD
7, 3333–3395, 2007 MIPAS NO2 validation G. Wetzel et al. Title Page Abstract Introduction Conclusions References Tables Figures ◭ ◮ ◭ ◮ Back CloseFull Screen / Esc
Printer-friendly Version Interactive Discussion
EGU Abstract
The Michelson Interferometer for Passive Atmospheric Sounding (MIPAS) instrument was launched aboard the environmental satellite ENVISAT into its sun-synchronous orbit on 1 March 2002. The short-lived species NO2 is one of the key target products of MIPAS that are operationally retrieved from limb emission spectra measured in the 5
stratosphere and mesosphere. Within the MIPAS validation activities, a large number of independent observations from balloons, satellites and ground-based stations have been compared to European Space Agency (ESA) version 4.61 operational NO2data
comprising the time period from July 2002 until March 2004 where MIPAS measured with full spectral resolution. Comparisons between MIPAS and balloon-borne obser-10
vations carried out in 2002 and 2003 in the Arctic, at mid-latitudes, and in the tropics show a very good agreement below 40 km altitude with a mean deviation of roughly 3%, virtually without any significant bias. The comparison to ACE satellite observa-tions exhibits only a small negative bias of MIPAS which appears not to be significant. The independent satellite instruments HALOE, SAGE II, and POAM III confirm in com-15
mon for the spring-summer time period a negative bias of MIPAS in the Arctic and a positive bias in the Antarctic middle and upper stratosphere exceeding frequently the combined systematic error limits. In contrast to the ESA operational processor, the IMK/IAA retrieval code allows accurate inference of NO2 volume mixing ratios under
consideration of all important non-LTE processes. Large differences between both re-20
trieval results appear especially at higher altitudes, above about 50 to 55 km. These differences might be explained at least partly by non-LTE under polar winter conditions but not at mid-latitudes. Below this altitude region mean differences between both pro-cessors remain within 5% (during night) and up to 10% (during day) under undisturbed (September 2002) conditions and up to 40% under perturbed polar night conditions 25
(February and March 2004). The intercomparison of ground-based NDACC observa-tions shows no significant bias between the FTIR measurements in Kiruna (68◦N) and MIPAS in summer 2003 but larger deviations in autumn and winter. The mean
devi-ACPD
7, 3333–3395, 2007 MIPAS NO2 validation G. Wetzel et al. Title Page Abstract Introduction Conclusions References Tables Figures ◭ ◮ ◭ ◮ Back CloseFull Screen / Esc
Printer-friendly Version Interactive Discussion
EGU
ation over the whole comparison period remains within 10%. A mean negative bias of 15% for MIPAS daytime and 8% for nighttime observations has been determined for UV-vis comparisons over Harestua (60◦N). Results of a pole-to-pole comparison of ground-based DOAS/UV-visible sunrise and MIPAS mid-morning column data has shown that the mean agreement in 2003 falls within the accuracy limit of the compar-5
ison method. Altogether, it can be indicated that MIPAS NO2 profiles yield valuable
information on the vertical distribution of NO2 in the lower and middle stratosphere
(below about 45 km) during day and night with an overall accuracy of about 10–20% and a precision of typically 5–15% such that the data are useful for scientific studies. In cases where extremely high NO2 occurs in the mesosphere (polar winter) retrieval
10
results in the lower and middle stratosphere are less accurate than under undisturbed atmospheric conditions.
1 Introduction
The abundance of reactive nitrogen and its partitioning plays an important role in the understanding of gas-phase and heterogeneous processes in stratospheric chemistry. 15
The short-lived species nitrogen dioxide (NO2) is involved in catalytic cycles leading to
the destruction of stratospheric ozone. In addition, NO2 regulates the ozone budget via reactions with radicals to form reservoir species like HNO3, ClONO2, BrONO2, and
N2O5which temporarily remove these radicals from fast ozone destroying reactions.
NO2 exhibits a strong diurnal variation in the stratosphere and is in photochemical 20
equilibrium with NO and N2O5(see, e.g. Brasseur and Solomon, 2005). At sunset, NO
is rapidly converted to NO2mainly via the reaction with O3:
NO + O3→NO2+ O2 (R1)
During the night, NO2is gradually decomposed to form N2O5 by the following
reac-tions: 25
ACPD
7, 3333–3395, 2007 MIPAS NO2 validation G. Wetzel et al. Title Page Abstract Introduction Conclusions References Tables Figures ◭ ◮ ◭ ◮ Back CloseFull Screen / Esc
Printer-friendly Version Interactive Discussion
EGU
NO2+ NO3+ M → N2O5+ M (R3)
After sunrise, N2O5is photolyzed back into NO2and NO3:
N2O5+ hν → NO2+ NO3 (R4)
It can also be destroyed by collisional decomposition via the reverse reaction of (R3). At the same time, NO2 reacts very rapidly to reform NO either by photolysis or by 5
reaction with atomic oxygen:
NO2+ hν → NO + O(3P) (R5)
NO2+ O → NO + O2 (R6)
This diurnal variation of NO2 results in a minimum concentration after sunrise and a
maximum concentration shortly after sunset. 10
Stratospheric NO2 measurements have been carried out since the 1970s from a variety of airborne and ground-based platforms using in-situ and remote sensing tech-niques (e.g., Noxon et al., 1979; Coffey et al., 1981; Kondo et al., 1985; Roscoe et al., 1986; Pommereau and Goutail, 1988; Webster et al., 1990; Pfeilsticker and Platt, 1994; Chance et al., 1996; Renard et al., 1996; Wetzel et al., 1997; Sen et al., 1998; 15
Payan et al., 1999).
Satellite measurements are essential for monitoring the behaviour and trends of chemical species in the atmosphere since a global set of simultaneously derived at-mospheric parameters can be obtained. Early spaceborne observations of NO2 were
performed between 1978 and 1979 by the LIMS radiometer (Gille and Russell III, 1984). 20
The Atmospheric Trace Molecule Spectroscopy experiment (ATMOS) has flown four times on the Space Shuttle between 1985 and 1994 measuring NO2 in infrared solar
occultation (Russell III et al., 1988; Newchurch et al., 1996). The families of the Strato-spheric Aerosol and Gas Experiment (SAGE I, II, and III; Chu and McCormick, 1986; Cunnold et al., 1991; NASA LaRC, 2006) and Polar Ozone and Aerosol Measurement 25
ACPD
7, 3333–3395, 2007 MIPAS NO2 validation G. Wetzel et al. Title Page Abstract Introduction Conclusions References Tables Figures ◭ ◮ ◭ ◮ Back CloseFull Screen / Esc
Printer-friendly Version Interactive Discussion
EGU
(POAM II and III; Randall et al., 1998; Randall et al., 2002) observe NO2 by solar oc-cultation in the visible while the Halogen Ococ-cultation Experiment (HALOE; Russell III et al., 1993) on the Upper Atmosphere Research Satellite (UARS) spacecraft operated in the infrared spectral domain. On the same platform, NO2was observed in the infrared by the Improved Stratospheric and Mesospheric Sounder (ISAMS) by means of pres-5
sure modulator radiometer technique (Reburn et al., 1996) and by the Cryogenic Limb Array Etalon Spectrometer (CLAES; Dessler et al., 1996). Further satellite sensors measuring NO2in the infrared spectral region are the two Improved Limb Atmospheric
Spectrometers (ILAS I and II; Sasano et al., 1999; Nakajima et al., 2006) and the At-mospheric Chemistry Experiment Fourier Transform Spectrometer (ACE-FTS; Bernath 10
et al., 2005).
The Environmental Satellite (ENVISAT) was launched into its sun-synchronous orbit on 1 March 2002 and operates in an altitude of 800 km. The Scanning Imaging Ab-sorption Spectrometer (SCIAMACHY; Bovensmann et al., 1999) measures NO2and a number of climate relevant trace gases during day in nadir and limb viewing geometries, 15
as well as in solar and lunar occultation modes (Amekudzi et al., 2005; Bracher et al., 2005; Meyer et al., 2005; Rozanov et al., 2005). The Global Ozone Monitoring by Oc-cultation of Stars (GOMOS; Bertaux et al., 1991) instrument observes NO2and some
other species during twilight and night (Marchand et al., 2004). The Michelson Interfer-ometer for Passive Atmospheric Sounding (MIPAS; Fischer and Oelhaf, 1996; Fischer 20
et al., 20071) is one of the three chemistry instruments aboard ENVISAT. MIPAS oper-ates in the mid-infrared spectral region with high spectral resolution measuring many climate relevant species within the nitrogen, chlorine and hydrogen chemical families together with tropospheric source gases simultaneously. Increasing complexity of such space instruments and enhanced diversity of products expected from instruments like 25
MIPAS demand for even increased efforts in validation. Apart from satellite measure-ments, balloon-borne observations are a very useful tool to obtain distributions of a
1
Fischer, H., Carli, B., Oelhaf, H., et al.: MIPAS: An instrument for atmospheric and climate research, Atmos. Chem. Phys. Discuss., in preparation, 2007.
ACPD
7, 3333–3395, 2007 MIPAS NO2 validation G. Wetzel et al. Title Page Abstract Introduction Conclusions References Tables Figures ◭ ◮ ◭ ◮ Back CloseFull Screen / Esc
Printer-friendly Version Interactive Discussion
EGU
large number of molecules with sufficiently high vertical resolution. However, due to large logistical efforts the number of these flights is very limited. This holds also for air-craft measurements which may cover larger horizontal regions compared to balloons but from distinctly lower flight altitudes. Ground-based measurements can be carried out all over the year but, apart from LIDAR observations, the vertical resolution is gen-5
erally very low. The use of independent satellite measurements to validate trace gas products has the great advantage that global coverage for all seasons is available and that validation activities are not limited to a certain period and location. This paper out-lines the results of the MIPAS validation activities concerning the molecule NO2. The
comparisons were made with the European Space Agency (ESA) operational version 10
4.61 data comprising the time period from July 2002 until March 2004 where MIPAS measured with full spectral resolution.
2 MIPAS NO2data
The limb viewing Fourier transform spectrometer MIPAS on ENVISAT (MIPAS-E) op-erates in the mid-infrared spectral region covering five spectral bands within 685 cm−1 15
and 2410 cm−1 with an unapodized full spectral resolution of 0.035 cm−1(Fischer and Oelhaf, 1996; Fischer et al., 20071). Owing to its sun-synchronous orbit (98.55◦ inclina-tion) in about 800 km, MIPAS passes the equator in southwards direction at 10:00 am local time 14.3 times a day. During each orbit approximately 72 limb scans (full reso-lution mode) are recorded covering tangent altitudes from 8 to 68 km in steps of 3 km. 20
The vertical resolution is about 3 km coinciding with the vertical field of view (FOV) of 3 km while the horizontal field of view extends to 30 km. Level 1B and level 2 process-ing of the data (version 4.61) includprocess-ing all processprocess-ing steps from raw data to calibrated spectra and volume mixing ratio (VMR) profiles of species has been performed by ESA using the operational retrieval algorithm described by Raspollini et al. (2006) and ref-25
erences therein. Calibrated spectra are analyzed using a global fit approach (Carlotti, 1988) by varying the input parameters of the forward model according to a non-linear
ACPD
7, 3333–3395, 2007 MIPAS NO2 validation G. Wetzel et al. Title Page Abstract Introduction Conclusions References Tables Figures ◭ ◮ ◭ ◮ Back CloseFull Screen / Esc
Printer-friendly Version Interactive Discussion
EGU
Gauss-Newton procedure. In a first step, temperature and pressures at the tangent altitudes are retrieved simultaneously (p, T retrieval), then the VMR profiles of the pri-mary target species O3, H2O, CH4, N2O, HNO3 and NO2 are retrieved individually in
sequence.
The NO2operational analysis of the version 4.61 data has been performed in three
5
microwindows of the ν3 band near 6.2 µm (1615 cm −1
). A random error due to the propagation of instrument noise through the retrieval can be extracted from the diag-onal elements of the error variance covariance matrix calculated during the retrieval process. Systematic error sources are calculated for day and night conditions and dif-ferent seasons. For most cases and at most altitudes in the stratosphere, the random 10
error is the dominant error source. However, in the upper stratosphere and meso-sphere, the systematic non local thermodynamic equilibrium (non-LTE) error gets very important, especially under winter conditions. The total error is calculated as the root sum square of systematic and random components.
3 Intercomparison results
15
In this section, profiles and vertical column amounts of NO2 measured by several
in-struments are compared to MIPAS version 4.61 NO2 data. A comprehensive study concerning validation methods and strategies is given by von Clarmann (2006) and references therein. Differences in VMR profiles of measured quantities are expressed as either relative or absolute differences. The mean relative difference of several pro-20
files is calculated by dividing the mean absolute difference by the mean profile value of the validation instrument for all coincident altitudes. Differences are displayed together with the combined errors σcombof both instruments which are defined as:
σcomb = q
σM2 + σI2, (1)
where σM and σI are the precision, systematic or total errors of MIPAS and the vali-25
ACPD
7, 3333–3395, 2007 MIPAS NO2 validation G. Wetzel et al. Title Page Abstract Introduction Conclusions References Tables Figures ◭ ◮ ◭ ◮ Back CloseFull Screen / Esc
Printer-friendly Version Interactive Discussion
EGU
of a measurement) correspond, in general, to random noise errors, while other error sources are treated as systematic. However, for statistic comparisons, errors of the temperature profile used for the NO2retrievals behave more randomly and are
there-fore included in the precision (random) part of the error budget. The uncertainty of the calculated mean difference (standard error of the mean, SEM) is given by σ/N0.5 5
where σ is the standard deviation (SD) and N the number of compared observations. The comparison between the standard deviation of the mean difference and the com-bined random error helps to validate the precision of MIPAS. The comparison between the mean VMR difference and the combined systematic error of the two instruments is appropriate to identify unexplained biases in MIPAS NO2 observations which turn out
10
to be significant when they exceed the combined systematic error limits.
As mentioned in Sect. 1, NO2volume mixing ratios exhibit a strong diurnal variation.
Changes in the volume mixing ratio may reach several ppbv within half an hour around sunrise and sunset. Consequently, photochemical corrections have been applied to account for temporal and in some cases also spatial differences between MIPAS and 15
the validation instrument.
3.1 Intercomparison of balloon-borne observations
As part of the validation program of the chemistry instruments aboard ENVISAT a num-ber of balloon flights were carried out within dedicated campaigns. An overview of all balloon flights used within this comparison study is given in Table 1. A total of three 20
validation flights were carried out with the cryogenic Fourier transform infrared spec-trometer MIPAS-B, the balloon-borne version of MIPAS, from Aire sur l’Adour (France, 44◦N) on 24 September 2002, Kiruna (Sweden, 68◦N) on 20/21 March 2003, and again from Kiruna on 3 July 2003. MIPAS-B measures all atmospheric parameters covered by MIPAS-E. Essential for the balloon instrument is the sophisticated line of sight sta-25
bilization system, which is based on an inertial navigation system and supplemented with an additional star reference system. Averaging several spectra during one single elevation angle yields to a reduction of the noise equivalent spectral radiance (NESR)
ACPD
7, 3333–3395, 2007 MIPAS NO2 validation G. Wetzel et al. Title Page Abstract Introduction Conclusions References Tables Figures ◭ ◮ ◭ ◮ Back CloseFull Screen / Esc
Printer-friendly Version Interactive Discussion
EGU
and therefore to an improvement of the signal to noise ratio. The MIPAS-B data pro-cessing including instrument characterization is described in Friedl-Vallon et al. (2004) and references therein. Retrieval calculations of atmospheric target parameters were performed with a least squares fitting algorithm using analytical derivative spectra cal-culated by the Karlsruhe Optimized and Precise Radiative transfer Algorithm (KOPRA; 5
Stiller et al., 2002; H ¨opfner et al., 2002). A Tikhonov-Phillips regularization approach constraining with respect to the form of an a priori profile was adapted. The resulting vertical resolution lies typically between 2 and 3 km and is therefore comparable to the vertical resolution of MIPAS-E. NO2 was analyzed in MIPAS-B proven microwindows
in the ν3band between 1585 cm −1
and 1615 cm−1. Spectroscopic parameters chosen 10
for the MIPAS-B retrieval are consistent with the database taken for the MIPAS-E data analysis (Flaud et al., 2003) and originate mainly from the HITRAN 2004 database (Rothman et al., 2005). A further overview on the MIPAS-B data analysis is given in Wetzel et al. (2006) and references therein.
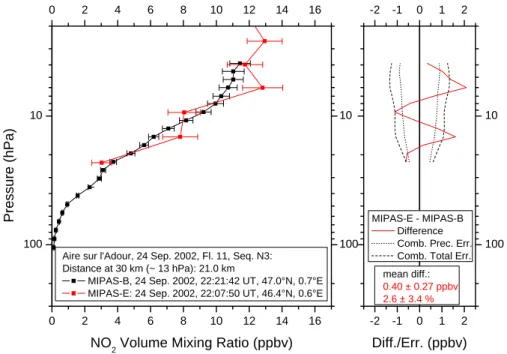
Figure 1 shows an example for perfect coincidence between MIPAS-B and MIPAS-E 15
on 24 September 2002 above southern France. The mean distance of both observa-tions in the compared altitude region was about 57 km and the mean time difference was only 14 min. The MIPAS-E profile shows some retrieval instabilities which occur quite frequently in the ESA operational data. Apart from these instabilities, the MIPAS-B profiles are fairly well reproduced by MIPAS-E and differences are mostly within the 20
combined errors. A small positive bias of 0.4 ppbv, more pronounced at higher alti-tudes, can be recognized in the satellite data.
To increase the number of matches between MIPAS-B and MIPAS-E, trajectory cal-culations have been performed at the FU (Freie Universit ¨at) Berlin (K. Grunow, private communication, 2005). The trajectory model (Langematz et al., 1987; Reimer and 25
Kaupp, 1997) uses operational analyses and forecasts of the European Centre for Medium-Range Weather Forecasts (ECMWF) on a 2.5◦×2.5◦ latitude/longitude grid. The trajectories are calculated on 25 isentropic levels from the surface up to 1600 K with interpolation between these levels. For this study forward and backward
trajecto-ACPD
7, 3333–3395, 2007 MIPAS NO2 validation G. Wetzel et al. Title Page Abstract Introduction Conclusions References Tables Figures ◭ ◮ ◭ ◮ Back CloseFull Screen / Esc
Printer-friendly Version Interactive Discussion
EGU
ries up to two days were calculated, starting on the MIPAS-B tangent point locations. MIPAS-E measurement points have been searched within a match criterion of not more than an hour in time and less than 500 km horizontal distance to the centre of the satel-lite scan.
To balance temporal and spatial differences of the observations of both sensors, sim-5
ulations have been carried out with the three-dimensional Chemistry Transport Model (CTM) KASIMA (Karlsruhe Simulation model of the Middle Atmosphere; Kouker et al., 1999) which was run in a 5.6◦×5.6◦ horizontal resolution. MIPAS-B NO2 values were
corrected by scaling them with the altitude-dependent NO2 ratio determined from the
modelled NO2 profiles for the MIPAS-B and MIPAS-E measurement times and loca-10
tions.
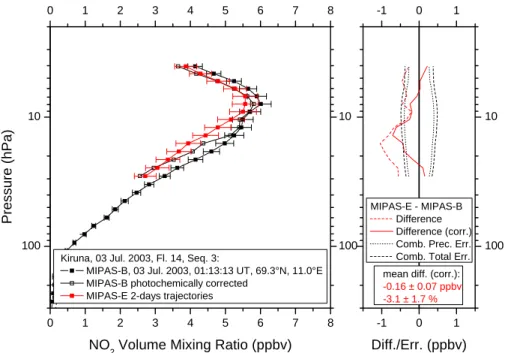
Figure 2 displays an example for the trajectory comparison for the balloon flight on 3 July 2003 which was carried out from Kiruna. Dependent on altitude, a total of 5 to 7 trajectory matches have been averaged by taking into account the individual random error to yield a mean MIPAS-E profile. The viewgraph shows, that the bias between 15
the measured profiles of both sensors vanishes at many altitudes when comparing the photochemically corrected MIPAS-B profile to the mean satellite profile.
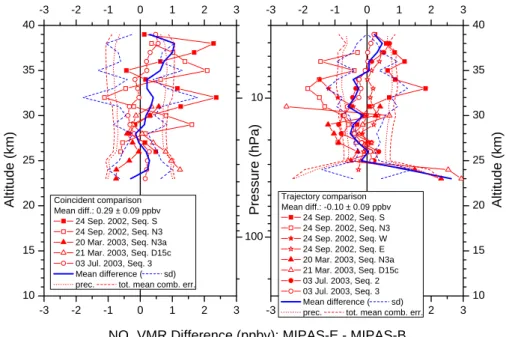
A summary of all MIPAS balloon comparisons is depicted in Fig. 3. A mean positive bias of 0.29 ppbv (4.2%) is visible in the coincidence case, especially for altitudes above about 28 km (18 hPa). The mean difference lies clearly within the combined total error 20
and, except a small region around 38 km, even within the combined precision error. The trajectory comparison, however, reveals a small negative bias between 25 and 35 km altitude while, below and above, MIPAS-E tends to higher NO2values compared to the balloon instrument. The mean deviation over all altitudes is –0.10 ppbv (–2.2%). The combined coincidence and trajectory comparison results in a small mean deviation 25
of 0.21 ppbv (3.8%) between MIPAS-E and MIPAS-B measured NO2values.
The tunable diode laser instrument SPIRALE (Spectrom `etre Infra Rouge pour l’ ´etude de l’Atmosph `ere par diodes Laser Embarqu ´ees) is a balloon-borne instrument for the in situ measurement of stratospheric trace species. 86 reflections of six laser beams in
ACPD
7, 3333–3395, 2007 MIPAS NO2 validation G. Wetzel et al. Title Page Abstract Introduction Conclusions References Tables Figures ◭ ◮ ◭ ◮ Back CloseFull Screen / Esc
Printer-friendly Version Interactive Discussion
EGU
a 3.5 m multipass Herriott cell exposed to ambient air above the tropopause lead to a 300 m optical path length. Species concentrations are retrieved from direct absorption in the mid-infrared spectral region by fitting experimental spectra and spectra calcu-lated using spectroscopic parameters of absorption lines from the HITRAN database (Rothman et al., 2005). With this technique concentrations of CH4, N2O, NO2, HNO3, 5
HCl, CO and O3 can be observed simultaneously. A detailed description of the
in-strument and of its operating modes can be found in Moreau et al. (2005). Validation flights were carried out from Aire sur l’Adour on 2 October 2002 and from Kiruna on 21 January 2003.
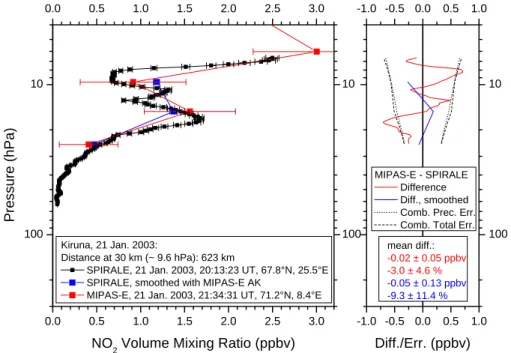
An example for a SPIRALE comparison with MIPAS-E is given in Fig. 4 for the 10
arctic flight on 21 January 2003. The SPIRALE profile has been smoothed with the averaging kernel of MIPAS according to the method described in Rodgers (2000). Both measurements were performed inside the polar vortex. Mean differences are small with –0.05 ppbv (–9.3%) in the smoothed case.
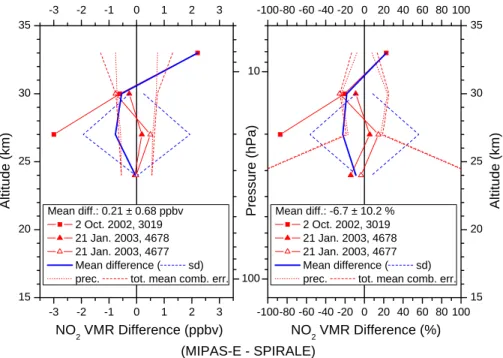
Figure 5 shows all SPIRALE comparisons with MIPAS-E. Mean differences in po-15
tential vorticity (PV) are less than 8% for the January flight between 24 and 30 km altitude. For the 2 October 2002 flight no MIPAS-E data for a coincident comparison is available. Hence, backward trajectories ending at the location of the SPIRALE profiles (44◦N, 0◦E) on 2 October 2002 (07:15–08:30 UT at ascent) have been computed as a function of potential temperature in 25 K steps (about 1 km). Profiles 14 and 15 of 20
orbit 3019 have been proven to be the best matches for comparison with SPIRALE. These profiles were measured close to 00 UT near 42◦N and 46◦N on 28 Septem-ber, 4.5 days before the SPIRALE flight. A correction for the diurnal variation of NO2
has been applied to the smoothed SPIRALE profiles with the help of a photochemical model. For the highest altitude (around 33 km) MIPAS-E overestimates the SPIRALE 25
observations, while below a tendency of underestimation of the NO2values, especially
in the non-coincident October 2002 case, is obvious.
The balloon-borne diode array UV-visible spectrometer SAOZ (Syst `eme d’Analyse par Observation Z ´enitale) measures vertical profiles of O3and NO2(Pommereau and
ACPD
7, 3333–3395, 2007 MIPAS NO2 validation G. Wetzel et al. Title Page Abstract Introduction Conclusions References Tables Figures ◭ ◮ ◭ ◮ Back CloseFull Screen / Esc
Printer-friendly Version Interactive Discussion
EGU
Piquard, 1994). A Global Positioning System (GPS) and an accurate pressure and temperature sensor (PTU) are attached to the gondola reaching a flight altitude of typically 30 km. Solar occultation measurements are performed during the ascent of the balloon and during sunset from float or during sunrise and descent of the balloon. Slant columns of measured species along the line of sight are retrieved by the DOAS 5
technique (Differential Optical Absorption Spectroscopy). Vertical profiles are deduced using a linear onion peeling inversion procedure after calculating the tangent height from GPS. Since the full solar disk is observed, the vertical resolution of the profile is 1.4 km. A chemical box model is included for taking into account the NO2 variations
during twilight as a function of solar zenith angle (SZA) and altitude. A comprehensive 10
description of the data analysis is given in Denis et al. (2005). Fifteen flights have been carried out since the launch of ENVISAT, namely three in the Arctic (Kiruna, August 2002 until March 2003), eight at mid-latitudes (Vanscoy, Canada, 54◦N, September 2002 and August 2004, Aire sur l’Adour, France, 44◦N, May 2002 until October 2005), and four in the tropics (Bauru, Brazil, 23◦S, February 2003 and February 2004). Flights 15
used for this validation study are listed in Table 1.
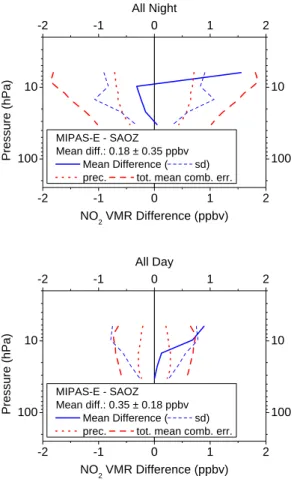
An example for a comparison between SAOZ and MIPAS for the flight from Vanscoy on 4 September 2002 is shown in Fig. 6. Correcting the SAOZ data with a photochem-ical model yields a close to perfect agreement with MIPAS for this comparison with a mean difference of less than 1% between about 10 and 23 hPa (about 32 to 25 km). 20
Fig. 7 shows that there is in general a good agreement for the nighttime comparisons up to about 10 hPa while above MIPAS NO2 mixing ratios are too high compared to
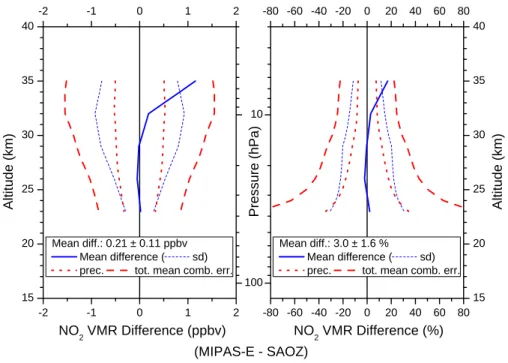
the SAOZ observations. A positive bias is also visible in the daytime comparison (see Fig. 7) at higher altitudes. Differences of all comparisons are depicted in Fig. 8. Ex-cept the region above about 30 km where MIPAS exhibits a positive bias, differences 25
between MIPAS and SAOZ are very small with a mean deviation over the complete altitude range of 0.21 ppbv (3.0%).
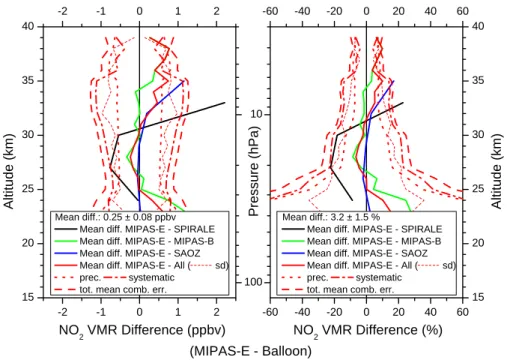
A summary of the comparison of all balloon flights is given in Fig. 9. A mean differ-ence profile was calculated taking into account the number of coincident measurement
ACPD
7, 3333–3395, 2007 MIPAS NO2 validation G. Wetzel et al. Title Page Abstract Introduction Conclusions References Tables Figures ◭ ◮ ◭ ◮ Back CloseFull Screen / Esc
Printer-friendly Version Interactive Discussion
EGU
sequences. Below about 31 km, the mean difference of all intercomparisons is well inside the combined errors. However, above this altitude region, an increasing positive bias of MIPAS-E is visible reaching a magnitude of up to 0.77 ppbv (9.9%) exceed-ing slightly the systematic error limits at 38 km. The mean deviation over all altitudes between 23 and 39 km is found to be only 0.25 ppbv (3.2%). Hence the general agree-5
ment between balloon-borne observations and MIPAS-E is found to be very good. 3.2 Intercomparison of satellite observations
Satellite observations are very useful for validation of other spaceborne sensors since the number of possible coincidences is large and potential systematic differences ap-pear to be very meaningful due to enhanced statistics. In the following sections in-10
tercomparison results of different satellite sensors are being discussed. A common strategy was adapted for the validation of MIPAS NO2profiles by intercomparison with these space-borne sensors, using concepts for statistical bias and precision determi-nation with matching pairs of measurements as described in von Clarmann (2006). Unless otherwise noted, a standard collocation criterion for maximum space and time 15
separation of 300 km and 3 h between MIPAS and the reference measurement has been applied to select the VMR comparison pairs. For each of the selected pairs, both MIPAS and the reference instrument NO2profiles were interpolated to a mean pressure grid over all collocated MIPAS measurements.
3.2.1 HALOE comparison 20
The Halogen Occultation Experiment (HALOE) was launched in September 1991 on board the Upper Atmosphere Research Satellite (UARS) and operated until Novem-ber 2005. The experiment uses solar occultation in several infrared channels and has recorded trace gas and temperature profiles of the middle atmosphere since October 1991. The NO2 data is corrected by taking into account variations of the solar zenith 25
ACPD
7, 3333–3395, 2007 MIPAS NO2 validation G. Wetzel et al. Title Page Abstract Introduction Conclusions References Tables Figures ◭ ◮ ◭ ◮ Back CloseFull Screen / Esc
Printer-friendly Version Interactive Discussion
EGU
and N2O5depends strongly on SZA due to the rapid photolysis of NO2and the slower photolysis of N2O5. In this study the HALOE NO2 data version 19 is compared to
MI-PAS. The validation of previous version 17 data (Gordley et al., 1996) shows mean differences with correlative measurements of about 10 to 15% over the middle strato-sphere. Randall et al. (2002) compared HALOE version 19 NO2with NO2profiles
de-5
rived by the Atmospheric Trace Molecule Spectroscopy Experiment (ATMOS). Above 25 km the two instruments agree within about 10%. The data accuracy of ATMOS is es-timated to about 6% in the altitude region between 15 and 48 km (Abrams et al., 1996). Since HALOE and MIPAS measured at different solar zenith angles a photochemical correction has been applied using a 1-dimensional photochemical model. This model 10
is initialised with the output of a global 2-dimensional chemistry transport model for the geolocation and day of the measurement. The solar occultation measurements of HALOE have been scaled to the MIPAS SZA by means of the photochemical model calculations (for details, see Bracher et al., 2005). An example for such a compari-son is displayed in Fig. 10. Since the altitude resolutions of HALOE and MIPAS are 15
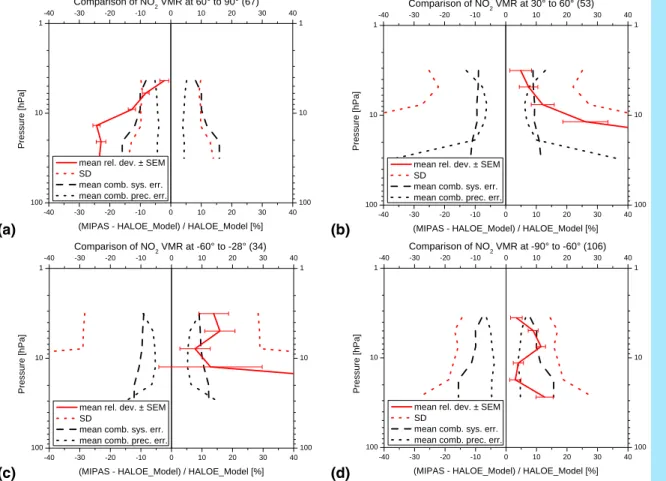
comparable, no smoothing with averaging kernels has been applied. Differences be-tween both sensors are shown in Table 2 and Table 3. Figure 11 displays differences between MIPAS and HALOE in dependence on latitude. In the southern hemisphere (mid-latitudes and Antarctic) and in northern hemisphere mid-latitudes, MIPAS exhibits a positive bias to HALOE in all altitude regions. Above about 10 hPa pressure altitude 20
this bias amounts roughly 10% or less which is close to the combined systematic error limit. For lower altitudes at mid-latitudes, the bias between both sensors is significant. In the Antarctic, however, the agreement between MIPAS and HALOE is also quite good at lower altitudes with only a small positive bias in the MIPAS data. In contrast, the arctic comparison shows a negative bias for MIPAS which is significant below about 25
10 hPa. In general the agreement in polar latitudes is better than in mid-latitudes where the solar zenith angle distribution is more variable than in polar regions.
ACPD
7, 3333–3395, 2007 MIPAS NO2 validation G. Wetzel et al. Title Page Abstract Introduction Conclusions References Tables Figures ◭ ◮ ◭ ◮ Back CloseFull Screen / Esc
Printer-friendly Version Interactive Discussion
EGU
3.2.2 SAGE II comparison
The Stratospheric Aerosol and Gas Experiment II (SAGE II) on the Earth Radiation Budget Satellite (ERBS) has been launched into its non-sun synchronous orbit in Oc-tober 1984. SAGE-II is a seven-channel solar occultation instrument collecting aerosol and trace gas data during each sunrise and sunset. It was powered off in August 5
2005. In this study the NO2data version 6.2 is used for the intercomparison to MIPAS. The precision and accuracy of NO2data has been assessed by Cunnold et al. (1991).
This former version 5.96 shows an agreement within 10% to balloon profiles and AT-MOS measurements in the altitude range between 23 and 37 km. The photochemical correction has been applied in the same way as for the HALOE-MIPAS comparison. 10
Averaging kernel smoothing of the NO2profiles could be neglected due to similar
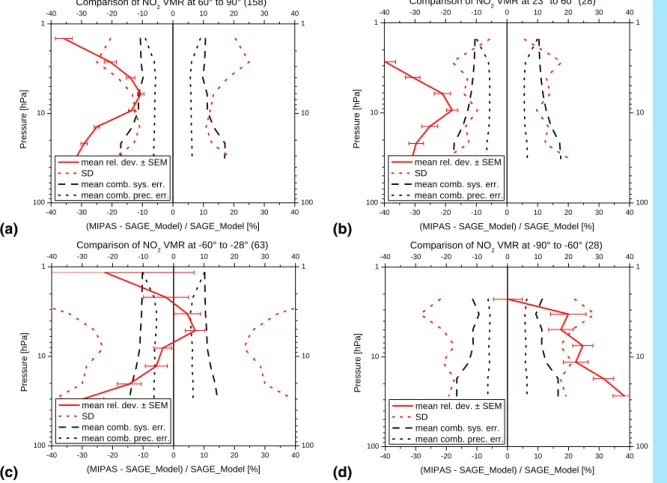
verti-cal resolutions of SAGE II and MIPAS. Differences between both sensors are displayed in Table 4 and Table 5. Latitudinal differences of both sensors are shown in Fig. 12. In southern hemisphere mid-latitudes the agreement between MIPAS and SAGE II is quite good. Except the highest (near 1 hPa) and lowest (below 20 hPa) altitude levels, 15
where a significant negative bias is visible, differences are within the combined errors. In the northern hemisphere, a significant negative bias is obvious especially for the mid-latitude case where mean relative deviations of more than 20% are found for most altitudes. It is known that SAGE II NO2 has a positive bias compared to HALOE NO2 (L. Thomason, personal communication, 2004). Bearing this fact in mind this would 20
reduce the mentioned negative bias between MIPAS and SAGE II. However, in the Antarctic, a positive bias of up to 38% near 30 hPa is visible. In contrast to HALOE, no corrections of variations of the solar zenith angle along the line of sight of SAGE II were performed. This may introduce some inaccuracies in the SAGE II NO2 data and help to at least partly explain the comparatively large discrepancies between MIPAS 25
ACPD
7, 3333–3395, 2007 MIPAS NO2 validation G. Wetzel et al. Title Page Abstract Introduction Conclusions References Tables Figures ◭ ◮ ◭ ◮ Back CloseFull Screen / Esc
Printer-friendly Version Interactive Discussion
EGU
3.2.3 POAM III comparison
The Polar Ozone and Aerosol Measurement III (POAM III) instrument is carried by the SPOT-4 spacecraft and was launched in March 1998. The solar occultation is performed in nine spectral channels in the visible and near-IR spectral region. The new NO2 data version 4 has been used for the intercomparison with MIPAS.
5
The precision and accuracy of POAM III version 3 NO2 data is given by Lumpe et al. (2002). This data has been validated by Randall et al. (2002) showing an agree-ment to HALOE from 20 to 33 km within 6% and from 33 to 40 km between 6 and 12%. The new POAM III version 4 data is described in a technical note (“Overview of the validation of POAM III version 4 retrievals”) available from the public web-site 10
http://wvms.nrl.navy.mil/POAM/poam.html. Differences compared to HALOE (version 19) are within 10% from 25–35 km, but approach 20% or higher (POAM higher than HALOE) near 20 km and 40 km. POAM III sunrise or sunset data and SAGE II (version 6.2) sunset data is within ±10% from 25–35 km. Comparisons with SAGE II sunrise data, however, suggest a SAGE II sunrise negative bias of more than 15%. The photo-15
chemical correction was applied like in the previous satellite comparisons. A smoothing with averaging kernels was not necessary due to similar vertical resolutions of POAM III and MIPAS. Differences between both sensors in dependence of season are given in Table 6 and Fig. 13. In the northern hemisphere (NH) winter (January to March) mea-surements of both sensors agree within about 15%. In the NH spring (April to June) a 20
negative bias in MIPAS NO2is visible exceeding 15% at altitudes below about 10 hPa.
A negative bias appears also in the NH summer (July to September) observations, es-pecially below 10 hPa, but due to the quite large combined systematic errors this bias is not significant. The comparison in SH summer (January to March) exhibits an agree-ment of both sensors within 15%. Except the altitude region below about 10 hPa this 25
holds also for the SH spring comparison (October to December). In the SH fall (April to June, see Table 6) below 4 hPa and winter (July to September, see Fig. 13) very large deviations between MIPAS and POAM occur, which might be connected to
observa-ACPD
7, 3333–3395, 2007 MIPAS NO2 validation G. Wetzel et al. Title Page Abstract Introduction Conclusions References Tables Figures ◭ ◮ ◭ ◮ Back CloseFull Screen / Esc
Printer-friendly Version Interactive Discussion
EGU
tions near and across the vortex edge and/or connected limitations of the correction with the photochemical model. This holds for the SH winter where no comparison was possible due to large standard deviations. It should be mentioned that POAM SH mea-surements (and therefore the MIPAS-POAM SH collocations) are at higher latitudes (63◦S to 83◦S) as compared to the NH latitudes (54◦N to 71◦N) what additionally to 5
the hemispheric difference explains the higher possibility of polar vortex coverage. Like SAGE II, no corrections of variations of the solar zenith angle along the line of sight of POAM III were performed what may introduce inaccuracies in the POAM III vertical NO2 profiles. On the other hand, it should be emphasized that under extreme winter
conditions standard NO2 microwindows used by the MIPAS retrieval processor do not 10
contain significant information in the lower stratosphere such that the NO2 data are only little reliable in this case (see also Sect. 3.2.5).
3.2.4 ACE comparison
The Atmospheric Chemistry Experiment (ACE), on the SCISAT-1 satellite, was launched into its orbit in August 2003 (Bernath et al., 2005). The primary instrument 15
is a high resolution (0.02 cm−1) Fourier transform spectrometer (ACE-FTS) operating between 750 and 4400 cm−1in solar occultation. In this work, we only examine results from the FTS, and hereafter refer to the ACE-FTS simply as ACE. Vertical profiles of various atmospheric constituents are retrieved from measured spectra with a vertical resolution of 3–4 km with a nearly global coverage from about 85◦N to 85◦S with a 20
majority of observations in the Arctic and Antarctic. NO2 profile comparisons (data version 1.0) to HALOE version 19 NO2 have shown that both sensors agree within
10% between 22 and 35 km altitude with lower values of ACE compared to HALOE (McHugh et al., 2005). For this study, only arctic daytime sunset profiles (data version 2.2) around 75◦N are compared to MIPAS daytime observations. A photochemical 25
correction has been applied to the data with the help of calculations performed by the three dimensional CTM KASIMA according to the method described in Sect. 3.1. The limited horizontal resolution of the model may introduce systematic inaccuracies in the
ACPD
7, 3333–3395, 2007 MIPAS NO2 validation G. Wetzel et al. Title Page Abstract Introduction Conclusions References Tables Figures ◭ ◮ ◭ ◮ Back CloseFull Screen / Esc
Printer-friendly Version Interactive Discussion
EGU
photochemical correction when transferring the sunset ACE data to the time and loca-tion of MIPAS day measurements. To avoid such effects, the collocaloca-tion criterion was tightened in terms of time and set to 1 h.
The mean difference of all collocations (between 4 February and 26 March 2004) is shown in Fig. 14. The overall agreement of both sensors is very good. A tendency to 5
a small negative bias is visible for pressure altitudes below 6 hPa (about 32 km) and extends to about 40% at the lowest altitude level. However, the overall negative mean bias is only 5.8% and remains mostly within the combined systematic error, which is underestimated since no systematic error data is available for the ACE observations.
3.2.5 Retrieval processor comparison 10
It has been shown that atmospheric NO2ν3IR emissions might depart from local ther-modynamic equilibrium (LTE) in the mesosphere and upper stratosphere (see, e.g., L ´opez-Puertas and Taylor, 2001). An innovative non-LTE retrieval scheme (Funke et al., 2001) has been included in the scientific MIPAS data processor (von Clarmann et al., 2003) developed at the Institut f ¨ur Meteorologie und Klimaforschung (IMK) and 15
the Instituto de Astrof´ısica de Andaluc´ıa (IAA). In contrast to the ESA operational pro-cessor, the IMK/IAA retrieval code allows accurate inference of NO and NO2 volume mixing ratios under consideration of all important non-LTE processes. Main results of this processor comparison are depicted in Fig. 15. These comparisons have been performed for undisturbed conditions (24 September 2002) and perturbed conditions 20
(nighttime only, NH winter 2003/2004) with a strong subsidence of mesospheric NOx. Large differences appear especially at higher altitudes above about 50 to 55 km for the September comparison. ESA results at these high altitudes show extremely high variability. IMK/IAA retrievals have shown that residuals could be significantly reduced by readjusting the collisional rate for N2 to a value 20 times higher than the nominal
25
one. The non-LTE effect in NO2 6.2 µm emissions is thus less important than
previ-ously estimated (i.e. up to 30%, Funke et al., 2005a) and generally amounts to only 3%, although more than 20% can be reached under extreme polar winter conditions
ACPD
7, 3333–3395, 2007 MIPAS NO2 validation G. Wetzel et al. Title Page Abstract Introduction Conclusions References Tables Figures ◭ ◮ ◭ ◮ Back CloseFull Screen / Esc
Printer-friendly Version Interactive Discussion
EGU
above 60 km. Non-LTE, however, cannot account alone for the discrepancy at these altitudes.
In the stratosphere (September 2002 case) the ESA retrievals yield up to 10% lower NO2 volume mixing ratios during day and mostly less than 5% during nighttime
com-pared to the IMK/IAA retrievals. The instrumental line shape (ILS) models of IMK/IAA 5
and ESA used for the retrievals are slightly different. Sensitivity studies for the Septem-ber case have shown that this could partly explain the VMR differences between ESA and IMK/IAA retrievals. Differences in temperature profiles used for the NO2 retrievals
have been checked for 24 September 2002. In general, ESA retrieved temperatures are higher than those inferred by IMK/IAA by up to 5 K at 70 km and 1–2 K between 10
35 and 50 km altitude. Estimating the Planck function effect for NO2 emissions at
1600 cm−1, a 1.5 K overestimation by ESA would result in roughly 6% underestima-tion of NO2 volume mixing ratios. This helps to explain differences between ESA and
IMK/IAA retrievals below 50 km altitude.
The comparison of IMK/IAA and ESA retrievals during perturbed conditions (win-15
ter 2003/04, see Fig. 15, bottom) shows qualitatively good agreement (note, that NO2
VMRs at these conditions vary over several orders of magnitude), although ESA values are 10–40% higher between 30 and 40 km and 20–60% lower at 50–65 km. Differences above 50 km might be explained at least partly by non-LTE (under polar winter condi-tions); below they are probably related to horizontal NO2gradients, which are explicitly 20
treated in the IMK/IAA retrieval, and differences in the retrieved temperature profiles. It should be noted that whenever NO2values are very high in the upper stratosphere
and lower mesosphere, which was the case in the Antarctic polar region in winter 2003 (Funke et al., 2005b) and in the Arctic winter 2003/04, NO2 values retrieved by the operational processor at 30 km and below suffer from very large errors. The reason 25
seems to be that under these extreme conditions standard NO2microwindows used by
the ESA processor do not contain significant information in the lower stratosphere. This fact can also help to explain why large deviations prevented a reasonable comparison between MIPAS and POAM III in the Antarctic winter 2003 (cp. Sect. 3.2.3).
ACPD
7, 3333–3395, 2007 MIPAS NO2 validation G. Wetzel et al. Title Page Abstract Introduction Conclusions References Tables Figures ◭ ◮ ◭ ◮ Back CloseFull Screen / Esc
Printer-friendly Version Interactive Discussion
EGU
3.3 Intercomparison of NDACC ground-based observations
Nitrogen dioxide is one of the key species monitored from pole to pole by the ground-based Network for the Detection of Atmospheric Composition Change (NDACC), a main contributor to WMO’s Global Atmosphere Watch program and formerly known as the Network for the Detection of Stratospheric Change (NDSC). In the framework of 5
this worldwide network of high-quality remote-sounding stations, two different measure-ment techniques provide complemeasure-mentary observations of the vertical column amount and profile of NO2and its diurnal variation along the day. Sunrise and sunset columns
are retrieved from zenith-scattered sunlight absorption measurements in the 400– 500 nm range performed year-round by more than 30 Differential Optical Absorption 10
(DOAS) UV-visible spectrometers (Roscoe et al., 1999; Vandaele et al., 2005, and ref-erences therein). Daytime NO2column is retrieved at various solar zenith angles from solar radiation absorption measurements by the NO2 multiplet at 2914.65 cm−1 per-formed, weather permitting, by about 10 Fourier Transform infrared (FTIR) spectrome-ters (Notholt and Schrems, 1994; De Mazi `ere et al., 1998). Both measurement tech-15
niques are sensitive mainly to the stratospheric part of the vertical column. In addition to those column retrievals, height-resolved information on NO2is also derived at a few
NDACC/DOAS stations taking into account the significant variation of the mean scatter-ing height of zenith-sky observations durscatter-ing twilight (McKenzie et al., 1991; Hendrick et al., 2004). The independent validation of atmospheric chemistry satellite missions is a 20
main objective of the NDACC (Lambert et al., 1999). Although measuring stratospheric NO2at poor vertical resolution, its ability to provide high-quality, continuous time-series at a variety of sites from pole to pole has been helpful in validating seasonal signals and meridian structures reported by NO2satellite sensors like HALOE (Gordley et al.,
1996), GOME (Lambert et al., 2002), POAM III (Randall et al., 2002) and SCIAMACHY 25
(Piters et al., 2006). In this section we will study how partial stratospheric columns de-rived from MIPAS measurements are consistent with correlative observations reported by the various components of the NDACC.
ACPD
7, 3333–3395, 2007 MIPAS NO2 validation G. Wetzel et al. Title Page Abstract Introduction Conclusions References Tables Figures ◭ ◮ ◭ ◮ Back CloseFull Screen / Esc
Printer-friendly Version Interactive Discussion
EGU
The confrontation of MIPAS and NDACC data has to address two main issues: the di-urnal variation of NO2which can generate dramatic differences between data recorded
at different hours of the day, and the fact that MIPAS accuracy degrades rapidly at alti-tudes below 24 km. FTIR observations can offer the best time coincidence with MIPAS data acquired in the mid-morning part of the orbit, without the use of a photochem-5
ical model to allow for time differences. We will concentrate here on the instrument at the Institutet foer Rymdfysik (IRF) in Kiruna (Arctic Sweden, 67.8◦N, 20.4◦E). It is operated by IMK Karlsruhe, IRF Kiruna, and University of Nagoya. This instrument records atmospheric absorptions of the infrared solar spectrum with a high spectral resolution of approximately 0.003 cm−1. Experimental details have been published 10
elsewhere (e.g. Blumenstock et al., 1997). Measured spectra are evaluated using the retrieval code PROFFIT (Hase et al., 2004), one of the reference codes accepted by the NDACC, and the forward model KOPRA (Stiller et al., 2002). Spectroscopic parame-ters are taken from the HITRAN database (Rothman et al., 2005). Data and algorithms intercomparison exercises indicate that the precision of single NO2measurements
per-15
formed by FTIR spectrometry is in the range of 6% to 12% (Zander et al., 1994). The accuracy is estimated to be about 10% as well. The spectroscopic characteristics of the NO2 multiplet (weak lines, interfering with strong methane absorptions) make it
impossible to separate the contribution of the tropospheric NO2 column to the
mea-sured absorption. In fact, the absorption of the tropospheric NO2column is covered by 20
broad band absorption of methane and therefore the retrieved NO2column amount is
representative mainly for the stratospheric column.
Results of the FTIR-based comparison in Kiruna are displayed in Fig. 16 for the period February until September 2003. No significant deviations are visible between MIPAS columns, calculated directly from the profile VMRs or calculated after smooth-25
ing to the altitude resolution of the ground-based FTIR. The seasonal variation of the NO2columns is captured similarly by both instruments. Differences between FTIR and
MIPAS partial columns are very small in summer with less than 10% and without a bias. However, in autumn (September) and winter, deviations are larger and reach up
ACPD
7, 3333–3395, 2007 MIPAS NO2 validation G. Wetzel et al. Title Page Abstract Introduction Conclusions References Tables Figures ◭ ◮ ◭ ◮ Back CloseFull Screen / Esc
Printer-friendly Version Interactive Discussion
EGU
to 45% on 24 February 2003 with a general positive bias in the MIPAS data. The PV difference at 475 K is within 15% for these collocations.
The problem of altitude limitations of MIPAS can be minimized when comparing with height-resolved data retrieved from ground-based UV-visible spectra measured before and during twilight. Here, we will concentrate on the instrument operated by BIRA-5
IASB in Harestua (Southern Norway, 60.2◦N, 10.8◦E). Details on the instrument and the DOAS analysis settings can be found in Roscoe et al., 1999 and Vandaele et al., 2005, respectively. The retrieval of a NO2 profile is based on the dependence of the
mean scattering height of zenith-sky spectra on the solar zenith angle (Hendrick et al., 2004). A stacked photochemical box model is included in the retrieval algorithm 10
in order to reproduce the effect of the rapid variation of the NO2 concentration along
the optical path, particularly significant at twilight. A total error is calculated taking into account measurement, smoothing, and forward model errors. The resulting vertical resolution of the retrieved NO2 profile is about 10 km. To minimize errors due to dif-ferences in vertical smoothing, MIPAS NO2profiles are smoothed using the averaging
15
kernels and the a priori profile associated with the ground-based retrievals. From the comparison of the averaging kernels of both instruments it can be deduced that the altitude region between 26.5 and 36.5 km is most relevant for the comparison of par-tial columns. MIPAS tangent points are selected within a radius of 750 km around the station for the same days. Since a photochemical box model is included in the forward 20
model, ground-based UV-visible profiles are retrieved at the SZA corresponding to the MIPAS observation, minimizing errors due to diurnal cycle effects. Results of this com-parison are shown in Fig. 17 including data from July 2002 to October 2003. A mean negative bias in the MIPAS partial columns of 15% for daytime and 8% for nighttime co-incident events is visible. For nighttime events, the bias clearly changes over the year 25
with a negative bias in spring-summer and a positive bias in late summer-early fall. The possible impact on this behaviour of the uncertainty on the SZA correction has been investigated through sensitivity tests performed using the BIRA-IASB photochemical box model. These tests have shown that the uncertainty on the SZA correction can
ACPD
7, 3333–3395, 2007 MIPAS NO2 validation G. Wetzel et al. Title Page Abstract Introduction Conclusions References Tables Figures ◭ ◮ ◭ ◮ Back CloseFull Screen / Esc
Printer-friendly Version Interactive Discussion
EGU
only partly explain the seasonality in the nighttime bias. Further investigations are therefore required to find the exact origin(s) of this bias seasonality. However, it should be noted that for most coincidences, differences between MIPAS and ground-based partial columns are not significant since they are well inside the combined systematic errors.
5
To investigate possible meridian errors in MIPAS NO2 data, and to extend the
in-vestigation of seasonal errors at a larger amount of sites, we have also conducted comparisons with the entire DOAS/UV-visible network of the NDACC, which samples the latitude range from 79◦N to 78◦S with about 35 stations archiving data regularly to the NDACC central archive or to the ENVISAT Cal/Val data centre. During intercompar-10
ison/certification campaigns, the agreement between collocated instruments generally falls within the 3% to 8% range (Vandaele et al., 2005). Long-term comparisons of nearly co-located slant column measurements at middle latitudes conclude to a similar mean agreement of 3% in summer and 9% in winter (Koike et al., 1999). The pre-cision on the spectral fitting is much better than 1%. Although all NDACC/UV-visible 15
stations provide a comparable level of precision, the final accuracy of a ground-based NO2 column data record is determined by the choice of the NO2 cross-section tem-perature used for the spectral fitting of the spectra (Vandaele et al., 1998): on-site real-time retrieval algorithms using cross-sections at room temperature generate a sys-tematic offset of 10–20% compared to state-of-the-art algorithms using cross-sections 20
at stratospheric temperature.
To enable quantitative comparisons with MIPAS NO2 data, we minimize the
prob-lems of MIPAS altitude limitations and of the diurnal cycle as follows. First, only 23 DOAS stations found in a sufficiently clean tropospheric environment – to provide a good estimate of the NO2 stratospheric column – are used for testing MIPAS
strato-25
spheric data. Second, MIPAS profiles are completed down to the tropopause – de-termined from ECMWF meteorological analyses – with NO2profiles generated by the 4D-variational data assimilation system BASCOE (Errera and Fonteyn, 2001). This chemical-transport model of the stratosphere is driven by meteorological analyses
ACPD
7, 3333–3395, 2007 MIPAS NO2 validation G. Wetzel et al. Title Page Abstract Introduction Conclusions References Tables Figures ◭ ◮ ◭ ◮ Back CloseFull Screen / Esc
Printer-friendly Version Interactive Discussion
EGU
of the ECMWF (winds, pressure and temperature) and constrained with MIPAS pro-file data of all available species, including NO2. MIPAS profiles are thus completed
downwards with a chemically and dynamically consistent extrapolation, rather than the output of an independent model. This so-called “ghost” column added between the lowest available MIPAS altitude and the tropopause contributes to 10% of the to-5
tal NO2 day column in the tropics, and up to 40% in mid-latitude winter, as shown in
Fig. 18. MIPAS profile data are selected for comparisons within a radius of less than 300 km around the station. Third, the aforementioned photochemical model used in the ground-based NO2profiling (Hendrick et al., 2004) has been used to allow for time
differences between the mid-morning MIPAS measurement and the twilights. Usually, 10
at low and middle latitudes the sunrise and mid-morning columns are found to agree within a few 1014molec cm−2, the difference varying slowly with the season and the lat-itude. Ground-based DOAS/UV-visible sunrise and MIPAS mid-morning column data can thus be compared on an annual average within this accuracy limit. At higher lati-tudes, during polar day or under white nights conditions, a photochemical adjustment 15
based on modelling results must be used to deal with the particular U-shape of the diurnal cycle controlled here directly by the photochemical equilibrium of NO/NO2.
Results of the pole-to-pole comparison are shown in Fig. 19. In general, the 2003 mean agreement between MIPAS and ground-based NO2column data falls within the
accuracy limit of the comparison method, that is, a few 1014molec cm−2, which corre-20
sponds to better than 10% in polar summer and up to 30% and more in polar and mid-dle latitude winter. A distinction is made in Fig. 19 between data retrieved with absorp-tion cross-secabsorp-tions at stratospheric temperatures (black dots), and data retrieved with cross-sections at room temperature (grey squares). If we take into account the positive offset of 15%–20% characteristic of the latter data, that is, about 5×10¹⁴molec cm−2 25
on an annual average, the agreement with MIPAS at the concerned stations also falls within the accuracy limit of the comparison method. Figure 18 details how annual cy-cles of NO2are captured by MIPAS at the NDACC stations of the Jungfraujoch (Swiss
an-ACPD
7, 3333–3395, 2007 MIPAS NO2 validation G. Wetzel et al. Title Page Abstract Introduction Conclusions References Tables Figures ◭ ◮ ◭ ◮ Back CloseFull Screen / Esc
Printer-friendly Version Interactive Discussion
EGU
nual cycle is within the comparison error budget. In Antarctica, the enhanced natural variability during springtime increases the scatter of the comparison, nevertheless the mean agreement remains within the accuracy limits of the comparison technique. In summertime, a slowly decreasing negative difference is observed, that might be inter-preted partly as a residual photochemical difference between the MIPAS and ground-5
based measurements.
4 Summary and conclusions
The objective of this study is to validate MIPAS operational NO2profiles by comparison to other independent NO2observations carried out by different previously validated
in-struments. In addition, it may also be helpful to better characterize the MIPAS data 10
product by intercomparing it to non-validated instruments. Within this study, MIPAS NO2 vertical profiles have been compared to balloon-borne and satellite observations
performed by different sensors. Furthermore, retrieved NO2 column amounts were
compared to ground-based observations carried out within the NDACC network. Due to the strong diurnal variation of the NO2 species, non-coinciding validation
measure-15
ments have been photochemically corrected to balance mismatches with the MIPAS observations. A retrieval processor comparison has also been included to better as-sess potential inaccuracies during the operational retrieval procedure which neglects non-LTE effects occurring in the upper stratosphere and mesosphere. A summary of the assessment of the individual comparisons is given in Table 7.
20
The MIPAS comparison to balloon-borne instruments revealed basically the best agreement between MIPAS and corresponding validating instruments. Except for the case of the SPIRALE flight in October 2002, where the measured NO2 profile had to be compared to MIPAS measurements carried out 4.5 days in advance, the agree-ment between MIPAS NO2 profiles and those observed during balloon flights carried
25
out from tropical, mid-latitude, and arctic stations was found to be very good. Below about 35 km altitude, no significant bias between MIPAS and the balloon instruments
ACPD
7, 3333–3395, 2007 MIPAS NO2 validation G. Wetzel et al. Title Page Abstract Introduction Conclusions References Tables Figures ◭ ◮ ◭ ◮ Back CloseFull Screen / Esc
Printer-friendly Version Interactive Discussion
EGU
exceeding the combined systematic errors has been found. Above this altitude region, a small positive bias (up to 10%) in the MIPAS data has been detected. However, the mean deviation between MIPAS NO2 profiles and those measured by the balloon
in-struments is only 0.25 ppbv (3.2%). The standard deviation of the differences between the measurements shows the same magnitude as the combined precision errors indi-5
cating that the precision part of the total error is characterized quite well. Nevertheless, it should be noted, that some MIPAS profiles are characterized by retrieval instabilities yielding to some oscillations in the profile shape.
A less clear picture emerges for the satellite comparison. The comparison to ACE exhibits only a small negative bias (about –6%) of MIPAS in the Arctic which appears 10
not to be significant. The magnitude of the standard deviation of the mean relative dif-ference is comparable to the combined precision error. The other independent satellite instruments (HALOE, SAGE II, POAM III) confirm in common for the spring-summer time period a negative bias of MIPAS in the Arctic and a positive bias in the Antarctic middle and upper stratosphere exceeding frequently the combined systematic error lim-15
its. Standard deviations of the mean relative differences are larger than the estimated combined precision errors. In middle latitudes, the comparison to HALOE reveals a positive bias of 5 to 26% between 12 and 2.5 hPa (about 30–40 km). In contrast, com-paring to SAGE II this exhibits a mostly negative bias of +7 to –40% in this altitude region. Bearing in mind that SAGE II has a positive bias to HALOE (L. Thomason, per-20
sonal communication, 2004), this would at least partly explain this negative bias com-pared to MIPAS. The POAM III to MIPAS comparison (between about 25 and 40 km) exhibits hemispheric differences from –7 to 28% in the southern and 0 to –46% in the northern spring/summer hemisphere. However, differences between POAM and SAGE II and HALOE also sometimes exceed significantly the 10% limit (cp. Sect. 3.2.3). The 25
slightly better agreement between MIPAS and HALOE compared to MIPAS and SAGE II /POAM III could be explained by the fact that the HALOE NO2 data is corrected by
taking into account variations of the solar zenith angle along the line of sight. The high Antarctic winter (2003) deviations between MIPAS and POAM III could be connected
ACPD
7, 3333–3395, 2007 MIPAS NO2 validation G. Wetzel et al. Title Page Abstract Introduction Conclusions References Tables Figures ◭ ◮ ◭ ◮ Back CloseFull Screen / Esc
Printer-friendly Version Interactive Discussion
EGU
with observations near and across the vortex edge and/or connected limitations of the correction with the photochemical model in this case. In this context it must be em-phasized that whenever NO2values are very high in the upper stratosphere and lower
mesosphere, which was the case in the Antarctic polar region in winter 2003 (Funke et al., 2005b) and in the Arctic winter 2003/04, NO2 values retrieved by the MIPAS
5
operational processor at 30 km and below suffer from very large errors since microwin-dows used by the ESA processor most probably do not contain significant information in the lower stratosphere under these extreme conditions (cp. Sect. 3.2.5). In contrast to the ESA operational processor, the IMK/IAA retrieval code allows accurate inference of NO2 volume mixing ratios under consideration of all important non-LTE processes. 10
Large differences between both retrieval results appear especially at higher altitudes above about 50 to 55 km. These differences might be explained at least partly by non-LTE (under polar winter conditions). Below this altitude region mean differences between both processors remain within 5% (during night) and up to 10% (during day) under undisturbed (September 2002) conditions and up to 40% under perturbed polar 15
night conditions (February and March 2004). These differences are probably related to horizontal NO2 gradients, which are explicitly treated in the IMK/IAA retrieval, and differences in the retrieved temperature profiles.
The intercomparison of ground-based NDACC observations has shown that no sig-nificant bias between the FTIR measurements in Kiruna (68◦N) and MIPAS is visible 20
in summer 2003. However, in autumn and winter, deviations are larger revealing a positive bias in the MIPAS partial columns of up to 43% in February 2003 for a mea-surement situation outside the polar vortex. The mean deviation over the whole com-parison period remains within 10%. In contrast to the mean positive bias detected from Kiruna, a mean negative bias of 15% for MIPAS daytime and 8% for nighttime 25
observations has been determined for UV-vis comparisons over Harestua (60◦N). For nighttime events this bias clearly shows a seasonal variation with a negative bias in spring-summer and a positive bias in late summer-early fall. However, intercomparing the Harestua daytime observations with the (daytime) Kiruna measurements the
de-ACPD
7, 3333–3395, 2007 MIPAS NO2 validation G. Wetzel et al. Title Page Abstract Introduction Conclusions References Tables Figures ◭ ◮ ◭ ◮ Back CloseFull Screen / Esc
Printer-friendly Version Interactive Discussion
EGU
tected biases to MIPAS show an opposite sign. Results of a pole-to-pole comparison of ground-based DOAS/UV-visible sunrise and MIPAS mid-morning column data has shown that the mean agreement in 2003 falls within the accuracy limit of the compari-son method. However, a small negative bias of MIPAS is also visible, especially in the northern hemisphere data.
5
The intercomparison of independent instruments to MIPAS operational NO2data has
shown that MIPAS operational NO2data are basically in good agreement with observa-tions carried out by different independent validation instruments. The total MIPAS NO2
mean retrieval error was determined to be within a 10 to 20% confidence limit in the middle and lower stratosphere (below about 45 km) while the systematic error should 10
stay within a 5 to 10% error limit (Raspollini et al., 2006). The random part of the error typically ranges between about 5 and 15%. No significant non-LTE error is expected below 50 km altitude. The ex ante estimated MIPAS error limits appear to be reason-able. Deviations between MIPAS and balloon experiments are small and virtually within the combined error limits for all considered flights in the Arctic, at mid-latitudes and the 15
tropics. This holds also for many ground-based observations of the NDACC network while satellite comparisons show sometimes larger deviations, especially in the Arctic and Antarctic. Here, the photochemical correction of the NO2data may also introduce
significant errors in the comparison. Error estimates by Bracher et al. (2005) have shown that this uncertainty may reach up to 8% (HALOE) and up to 18% (SAGE II and 20
POAM III) between 20 and 40 km. Some systematic deviations could generally also be related to spectroscopy, since different spectral regions were used to derive NO2data
from observations of different instruments. Altogether, it can be indicated that MIPAS NO2 profiles yield valuable information on the vertical distribution of NO2in the lower
and middle stratosphere during day and night with an overall accuracy such that the 25
data are useful for scientific studies. In cases where extremely high NO2occurs in the mesosphere (polar winter) retrieval results in the stratosphere are less accurate than under undisturbed atmospheric conditions. In the upper stratosphere and mesosphere, MIPAS errors generally increase and the total error exceeds the 100% limit above 50