HAL Id: inserm-02290865
https://www.hal.inserm.fr/inserm-02290865
Submitted on 18 Sep 2019
HAL is a multi-disciplinary open access
archive for the deposit and dissemination of
sci-entific research documents, whether they are
pub-lished or not. The documents may come from
teaching and research institutions in France or
abroad, or from public or private research centers.
L’archive ouverte pluridisciplinaire HAL, est
destinée au dépôt et à la diffusion de documents
scientifiques de niveau recherche, publiés ou non,
émanant des établissements d’enseignement et de
recherche français ou étrangers, des laboratoires
publics ou privés.
Mohamed Doulazmi, Cyril Cros, Isabelle Dusart, Alain Trembleau, Caroline
Dubacq
To cite this version:
Mohamed Doulazmi, Cyril Cros, Isabelle Dusart, Alain Trembleau, Caroline Dubacq. Alternative
polyadenylation produces multiple 3’ untranslated regions of odorant receptor mRNAs in mouse
ol-factory sensory neurons. BMC Genomics, BioMed Central, 2019, 20 (1), pp.577.
�10.1186/s12864-019-5927-3�. �inserm-02290865�
R E S E A R C H A R T I C L E
Open Access
Alternative polyadenylation produces
multiple 3
’ untranslated regions of odorant
receptor mRNAs in mouse olfactory sensory
neurons
Mohamed Doulazmi
1, Cyril Cros
2,3, Isabelle Dusart
2, Alain Trembleau
2†and Caroline Dubacq
2*†Abstract
Background: Odorant receptor genes constitute the largest gene family in mammalian genomes and this family has been extensively studied in several species, but to date far less attention has been paid to the characterization of their mRNA 3′ untranslated regions (3’UTRs). Given the increasing importance of UTRs in the understanding of RNA metabolism, and the growing interest in alternative polyadenylation especially in the nervous system, we aimed at identifying the alternative isoforms of odorant receptor mRNAs generated through 3’UTR variation.
Results: We implemented a dedicated pipeline using IsoSCM instead of Cufflinks to analyze RNA-Seq data from whole olfactory mucosa of adult mice and obtained an extensive description of the 3’UTR isoforms of odorant receptor mRNAs. To validate our bioinformatics approach, we exhaustively analyzed the 3’UTR isoforms produced from 2 pilot genes, using molecular approaches including northern blot and RNA ligation mediated polyadenylation test.
Comparison between datasets further validated the pipeline and confirmed the alternative polyadenylation patterns of odorant receptors. Qualitative and quantitative analyses of the annotated 3′ regions demonstrate that 1) Odorant receptor 3’UTRs are longer than previously described in the literature; 2) More than 77% of odorant receptor mRNAs are subject to alternative polyadenylation, hence generating at least 2 detectable 3’UTR isoforms; 3) Splicing events in 3’UTRs are restricted to a limited subset of odorant receptor genes; and 4) Comparison between male and female data shows no sex-specific differences in odorant receptor 3’UTR isoforms.
Conclusions: We demonstrated for the first time that odorant receptor genes are extensively subject to alternative polyadenylation. This ground-breaking change to the landscape of 3’UTR isoforms of Olfr mRNAs opens new avenues for investigating their respective functions, especially during the differentiation of olfactory sensory neurons.
Keywords: Odorant receptors, Olfr genes, 3′ untranslated region, mRNA isoforms, Alternative polyadenylation, Adult olfactory mucosa, Olfactory sensory neuron, IsoSCM
Background
Olfactory sensory neurons (OSNs) are the receptor cells of the mammalian olfactory system. OSN cell bodies are located in the olfactory mucosa (OM), a tissue covering the posterior/dorsal part of the nasal cavity. OSN axons project to the forebrain, into the olfactory bulb where they
establish synaptic connections with dendrites of principal cells and interneurons within neuropils called glomeruli [1]. Odorant receptors (ORs), encoded by Olfr genes, are G Protein-Coupled Receptors (GPCRs) which were first identified as receptors of odorant molecules present at the surface of the OM [2]. Soon after the cloning of the first Olfr genes, it was shown that they constitute a very large family of genes [2–4], and that each OSN expresses only one Olfr gene from the full repertoire, in a monoallelic manner [5]. Such monogenic and monoallelic expression
© The Author(s). 2019 Open Access This article is distributed under the terms of the Creative Commons Attribution 4.0 International License (http://creativecommons.org/licenses/by/4.0/), which permits unrestricted use, distribution, and reproduction in any medium, provided you give appropriate credit to the original author(s) and the source, provide a link to the Creative Commons license, and indicate if changes were made. The Creative Commons Public Domain Dedication waiver (http://creativecommons.org/publicdomain/zero/1.0/) applies to the data made available in this article, unless otherwise stated.
* Correspondence:caroline.dubacq@sorbonne-universite.fr
Alain Trembleau and Caroline Dubacq are co-last authors.
2CNRS, INSERM, Institut de Biologie Paris Seine, Neuroscience Paris Seine, NPS, Sorbonne Université, F-75005 Paris, France
of Olfr genes in OSNs suggests tight genetic regulation. Furthermore, in terms of projections, it was shown that all OSNs expressing a given Olfr gene are scattered in large zones of the OM, but that their axons converge onto a small number of glomeruli [6–8]. Very interestingly, in addition to their role as chemoreceptors, ORs are involved in these two processes: ORs ensure their own monogenic and monoallelic expression [9], and play a critical role in guiding OSN axons towards their appropriate glomeruli [10–13]. Given the triple role played by Olfr genes in OSNs, and in view of deciphering the molecular and cellu-lar mechanisms involved in these different functions, it is critical to fully characterize their structure and expression. At the genomic and transcriptomic levels, the coding DNA sequence (CDS) and 5′ untranslated region (5’UTR) of Olfr genes have been extensively studied since the dis-covery of the gene family in the 1990s [2]. Olfr genes be-long to the GPCR superfamily and most of them were first identified by CDS homology search. Phylogenetic analysis of Olfr subfamilies, genomic distribution in clusters, and polymorphism studies were done on CDSs [14–16]. Alter-natively, 5’UTRs of Olfr genes were characterized through studies focusing on transcription start site identification and promoter analyses [17–21]. Early studies of Olfr cDNAs showed that, whereas introns are frequent (in low number) in 5’UTRs, they are very rare in Olfr CDSs [14,
15, 17]. Moreover, most Olfr expression studies were mainly based on CDS expression analyses [22–24]. In con-trast, 3′ untranslated regions (3’UTRs) of Olfr mRNAs are as yet poorly documented in databases and rarely included in Olfr studies [25–27].
The lack of knowledge regarding the 3’UTRs of Olfr mRNAs is detrimental, given the well-established critical functions of 3’UTRs in regulating mRNA stability/degrad-ation, translation repression/activation and subcellular localization [28]. Even more importantly, high throughput RNA sequencing during the past decade provided strong evidence for widespread alternative polyadenylation (APA) of mRNAs in eukaryotes, leading to the expression, for many genes, of several transcript isoforms with 3’UTRs of different lengths [29]. This APA turned out to be dynam-ically regulated during development [30], with lengthening or shortening of 3’UTR isoforms as an organism develops or a neuronal cell population differentiates [31–33]. At the subcellular level within developing neurons, APA is used to produce different mRNA isoforms having specific localization (i.e. axonal vs. cell body localization [34–38]). Furthermore, it was shown that APA is regulated in an ac-tivity dependent manner in adult neurons [39], where al-ternative 3’UTRs modify the localization, regulatory potential and plasticity of mRNAs in neuronal compart-ments [30].
To document the 3’UTRs of Olfr mRNAs in the mouse, and to determine to what extent these mRNAs
are subject to APA, we developed a dedicated strategy based on computational analyses of previously published RNA-Seq datasets obtained from adult mouse whole ol-factory mucosa [26,40].
Given that Olfr genes constitute the largest gene family in mammalian genomes (including around ~ 1400 Olfr genes or pseudogenes in the mouse genome [3]), a high throughput approach was required. We had to take into account very specific properties of the Olfr family, in addition to the number and the similarity of the Olfr se-quences that may challenge the specificity of the tech-niques. In particular, due to their monogenic and monoallelic expression [5], individual Olfr genes are expressed only in small subpopulations of OSNs and the resulting global low expression level of most of the Olfr genes in the OM may affect the annotation accuracy. Ibarra-Soria and colleagues [26] succeeded in generating 913 Olfr gene models from adult OM RNA-Seq data, thus bypassing the high similarity/low expression concerns. However, classical RNA-Seq annotation tools (e.g. Cuf-flinks) used by these authors and others [26, 27] are known to be poorly efficient in accurately identifying APA sites and the resulting 3’UTR isoforms [41]. In the present study, we re-analyzed Ibarra-Soria’s dataset with the Iso-form Structural Change Model (IsoSCM) method, dedi-cated to 3’UTR annotation in ab initio assemblies [41], and compared with the Cufflinks method. The parameters for the reads alignment and annotation steps were set to optimize the accurate and comprehensive identification of the Olfr 3’UTR ends. In addition, we validated the annota-tions obtained for selected representative Olfr genes by in-dependent experimental characterizations.
Results
Current documentation on Olfr 3’UTRs is not consistent, and likely underestimates their diversity
Until recently, most Olfr genes in databases showed no 3’UTR sequences. As an example, only 17 or 5 Olfr genes have one or multiple polyadenylation sites de-scribed in their annotated 3’UTR or extended 3′ region in 2 databases specific for 3’UTRs, PolyA_DB 3 [42] or APADB [43], respectively. Improved annotations of Olfr 3’UTR sequences were generated from male and female OM RNA-Seq data produced by Ibarra-Soria and col-leagues [26]. In 2015, Shum and colleagues published a study focused on the analysis of Olfr 3’UTRs and estab-lished a description of the 3’UTRs for 554 Olfr genes from adult female whole OM RNA-Seq data [27]. At the end of 2016, gene models for mouse Olfr genes were up-dated by the Havana project based on Ibarra-Soria’s RNA-Seq data (Ensembl 87 release [44, 45]), and Olfr genes now have 3′ annotations in mouse genome data-bases. However, these 3′ annotations are not fully con-sistent with either the Shum or the Ibarra-Soria analyses.
As an example, in the Ensembl database, Olfr1507 (also known as MOR28 or MOR244.1) shows 2 alternative 3’UTRs, one described by Ibarra-Soria and colleagues, and the other by Shum and colleagues (Fig.1a). A third isoform identified by Ibarra-Soria et al., however, is ex-cluded from the database. In the same Ensembl data-base, Olfr15 (also known as MOR256.17) shows a single 3’UTR, described by Ibarra-Soria et al., whereas Shum et al. demonstrated a shorter 3’UTR for this Olfr (Fig. 1a). In this latter work, an alternative 3’UTR was mentioned for Olfr15, but not described (Additional file3: Table S2 in [27]).
In an attempt to clarify this issue, we went back to the raw data of Ibarra-Soria and colleagues [26], and noticed that there were discrepancies between the 3′ annotations and the RNA-Seq data. A visual inspection of the read coverage argues in favour of 2 major 3’UTR isoforms for Olfr15, shorter than the Ensembl annotation, which may represent a long isoform expressed at a low level (Fig.1b). In the case of Olfr1507, the longer 3’UTR isoform anno-tated in Ensembl clearly appears as the major 3’UTR. While even longer additional 3’UTR isoform(s) of Olfr1507 most probably exist at a lower but detectable level, the shorter
Ensembl isoform does not show up from the read coverage profile (Fig. 1b). Although we cannot exclude that some variations in 3’UTRs of Olfr mRNAs may come from sex (males and females for Ibarra-Soria et al. vs. females only for Shum et al.), breeding, or other technical differences be-tween the 2 studies, these 2 examples clearly show that the current annotations of Olfr 3’UTR isoforms are not satisfactory.
In addition to the ambiguity described above, the number of alternative 3’UTRs clearly seems underestimated in both studies. This problem is likely due to the fact that both RNA-Seq analyses used Cufflinks for annotation, which in the literature [41] appears inefficient for the identification of alternative RNA ends. Thus, we decided to test dedicated tools and to set up a workflow specifically designed for the accurate characterization of the 3’UTRs of Olfr mRNAs. We applied this approach to available RNA-Seq datasets from first adult male OM, and then adult female OM.
Implementation of a dedicated computational pipeline to document the 3’UTR repertoire of mouse Olfr mRNAs
Our workflow comprises 6 steps ultimately leading to the identification and relative quantification of all
A
B
Fig. 1 Comparison between available annotations for Olfr1507 and Olfr15 3’UTR isoforms and RNA-Seq raw data. a Upper panel. 3’UTRs from Ibarra-Soria et al. [26] RNA-Seq study (Dataset S6 in this paper). Center panel. 3’UTRs from Shum et al. [27] RNA-Seq study (File 013
Additional File 26 Table S3 in this paper). An alternative 3’UTR for Olfr15 due to 3′ length variation is mentioned (File 010 Additional File3: Table S2 in [27]) but not described. Bottom panel. 3’UTRs in Ensembl release 89 [45].*: 3’UTRs deduced from RNA-Seq annotation (raw data in [26]) by the Havana project: ENSMUST00000206062.3 for Olfr1507; ENSMUST00000214590.1/ENSMUST00000214238.1 for Olfr15. Black vertical box: CDS end; black horizontal bar: 3’UTR. b Exon coverage, linear scale (top panel) and log scale (bottom panel), from olfactory mucosa RNA-Seq data of 3 adult male mice (male_IS2014, from [26]). Dashed lines indicate sustained drop of coverage that may be visually interpreted as 3′ ends; bold dashed lines indicate quantitatively major isoforms. Olfr1507 coverage suggests a short major 3’UTR isoform (S, previously described in a), and at least 2 additional minor 3’UTR isoforms with longer 3’UTRs (not described in a). Olfr15 coverage suggests 2 major 3’UTR isoforms (shorter than the 3’UTRs previously described in a), and a long minor 3’UTR isoform (L, previously described in a)
detectable Olfr 3’UTR isoforms (Fig.2, see methods for a complete description). Briefly, we chose to base our computational pipeline on STAR software for alignment (Fig. 2, Step 1). Before the assembly step, we applied a mask restricted to genomic regions of Olfr genes, most of them being included in large genomic clusters [14,15,
18,46,47] (Fig.2, steps 2 and 3; Additional file1: Table S1). In step 4, the IsoSCM algorithm was used for 3′ an-notations. IsoSCM is an ab initio transcript assembly method implementing multiple change-point inference in terminal exon models [41]. IsoSCM distinguishes be-tween local drops of coverage (due to biases) and sus-tained decrease of coverage (exon boundary change-point), and it avoids fragmentation due to small gaps in coverage. Among the available methods for 3’UTR anno-tation from RNA-Seq data, we chose IsoSCM for the fol-lowing reasons: it allows more than two 3’UTRs per gene (as compared to PHMM method [48]), it is able to detect novel polyA sites independently of genome anno-tation (as compared to the DaPars [49, 50], 3USS [51], Roar [52], QAPA [53] or TAPAS [54] reference-based methods), it is based on change-point analysis (as com-pared to GETUTR [55], based on read coverage smooth-ing), it is not focused on samples comparison (as compared to ChangePoint [56]) and it is not dependent on 3’end sequencing (as compared to the IntMAP [57] or CSI-UTR [58] integrative methods). The optimization of key parameters of IsoSCM to reach a compromise be-tween sensitivity and specificity are detailed in the methods section, and Additional file2: Figure S1. In par-allel, the data were processed in step 4 with the Cufflinks assembly method, to allow comparison with a previous study aiming at annotating the Olfr 3’UTRs [27]. In Step 5, transcripts were reconstructed. Furthermore, because 3’UTR ends depend on the presence of functional polya-denylation (polyA) signals (PAS) [59], we implemented in the workflow a search for canonical PAS in the vicin-ity of the newly identified 3’ends (Fig.2, step 5). Finally, for each Olfr gene, we used the quantitative coverage data (counts) in the different segments defined by the al-ternative 3′ ends downstream of the stop codon, and their respective length, to estimate the relative abun-dance of each 3’UTR isoform among the entire mRNA population (Fig.2, step 6).
Ibarra-Soria and colleagues provided high-quality data, with over 138 million paired-end fragments from 3 C57BL/6 J adult male OMs (referred to as male_IS2014) [26]. During the setup of the pipeline on these data, we considered that the precision of 3′ end annotation can-not exceed 100 nt for the following reasons: the read size is 75 nt, the cleavage sites at a single polyA site are ob-served in a 24-nt window [60], and a sequencing depth of 200 reads/kb is sufficient to reach a 100-nt resolution in IsoSCM transcript assembly with a 90% true positive
rate [41]. In the data set produced by Ibarra-Soria and colleagues, only 59.4% of the Olfr genes exceed the se-quencing depth of 200 counts/kb (in the CDS) for which a 100-nt resolution is achieved. Indeed, Olfr genes are expressed in a monogenic and monoallelic manner in OSNs and therefore most Olfr mRNAs show low abun-dance in whole olfactory mucosa extracts, limiting the precision of 3′ end identification for Olfr genes (see below). We considered further the 3′ ends which were matched with a canonical PAS (AAUAAA or AUUAAA) situated in a [− 100;+ 100] window. Overall, in our ana-lysis, 67.4% of the annotated 3′ ends are matched with a canonical polyA signal. Thus, we definitely used a preci-sion window of 100 nt.
From the 1181 Olfr genes investigated in adult male ol-factory mucosa (male_IS2014 dataset), we were able to an-notate 715 Olfr genes (61.4% of the 1165 Olfr genes expressed, i.e. with at least 1 read in the CDS) with the IsoSCM pipeline (Additional file3: Table S2) and 908 Olfr genes with Cufflinks. For these annotated Olfr genes, our pipeline was able to detect 1547 3’UTRs with IsoSCM vs. 946 3’UTRs with Cufflinks. Furthermore, the mean num-ber of 3′ ends per Olfr is 1.03 and 1.04 in the Cufflinks-based analysis by Shum and colleagues (File 010 Add-itional file 3: Table S2 in [27]) and by ourselves (male_ IS2014 dataset), respectively, whereas it reaches 2.16 in our IsoSCM analysis of this same dataset. Before exploring further the results obtained with our pipeline, we used 2 pilot genes to validate our in silico data.
Extensive characterization of the 3’UTR isoforms of 2 pilot Olfr genes
We undertook the extensive characterization of the 3’UTR isoforms produced by 2 pilot Olfr genes, Olfr1507 and Olfr15, belonging to distinct Class II odor-ant receptors subfamilies. In our hands, as for the two previous studies [26, 27], the Cufflinks’ method appears
inefficient for the identification of alternative RNA ends (Fig. 3b). The annotated 3’UTRs obtained using our
IsoSCM pipeline appear much more consistent, and even more precise than what could be presumed from a close visual inspection of RNA-Seq data for these 2 genes (Fig.3a and c). For both Olfr1507 and Olfr15, 4 al-ternative 3’UTRs are identified. Some of these isoforms correspond to the 3’UTRs obtained with Cufflinks (Olfr1507 3′S; Olfr15 3’M and 3’L; Figs. 1a and 3b-c). Interestingly, some isoforms are newly-identified 3’UTRs: Olfr1507 3’M, 3’L and 3’XL; Olfr15 3′S. The shortest Olfr1507 3’UTR described in Ensembl was not reconstructed from our pipeline (see further analysis below).
Importantly, our pipeline includes a step for relative quantification of the different 3’UTR isoforms produced by a given Olfr gene. Olfr1507 3′S represents 98.1% of
the Olfr1507 mRNAs. Olfr15 3′S represents only 60.3%, while Olfr15 3’M1 and 3’M2 together constitute 38.0% of the Olfr15 mRNAs (Fig.3d). Remarkably, all the 3′
al-ternative isoforms identified for the 2 genes are match-ing with canonical PASs (Fig.3e and Table1).
To confirm the biological existence of these 3’UTRs, we performed experimental characterization of the 8 pu-tative polyA sites annotated for Olfr1507 and Olfr15.
First, we investigated the precise cleavage sites by RNA Ligation mediated PolyAdenylation Test (RL-PAT), an RT-PCR-based strategy. We confirmed the use of 5
out of the 8 polyA sites using this technique (Fig. 3f; Table1). Unfortunately, the 3 last sites could not be vali-dated using this method, due to technical limitations: the presence of upstream repeat sequences made it im-possible to design specific primers for testing Olfr1507 3’XL, Olfr15 3’L and 3’M1.
Next, we demonstrated by northern blot the existence of alternative 3’UTR isoforms for both pilot genes using probes designed for the sequences either upstream (CDS probe) or downstream (3’M probe) of the proximal 3′ ends (Fig. 3g-h). The Olfr1507 3′S isoform appears as
Fig. 2 Computational pipeline for the characterization and analysis of Olfr 3’UTR isoforms from RNA-Seq datasets. The pipeline is divided into six steps: Step 1: RNA-Seq reads are mapped using STAR, and reference genome and annotation files. Step 2: A mask file in bed format, restricted to the Olfr loci in mouse, is generated. Step 3: The mask genome alignment output is obtained. Step 4: Full known and novel transcripts are reconstructed with IsoSCM or Cufflinks. Step 5: Reconstructed transcripts are characterized and analyzed in terms of annotation, 3’UTR isoforms identification, identification of predictive PASs at 3′ ends, merging (merge of 3’UTR isoforms from the same gene when 3′ ends are distant from less than 100 nt) and 3′ intron detection. Step 6: The relative abundances of the multiple 3’UTRs generated for the same Olfr gene are assessed by RNA-Seq quantification. Rectangles: input files or output files. Diamond shapes: bash shell and perl scripts.
the major 3’UTR: whereas a very strong signal attributed to 3′S isoform is detected with the CDS probe, another probe designed downstream of the 3′S end reveals only
faint bands corresponding to much less abundant longer 3’UTRs (3’M, 3’L or 3’XL) (Fig. 3g). A second band spe-cifically detected with the CDS probe corresponds to a
A B C D E F G H
Fig. 3 New annotations for Olfr1507 and Olfr15 3’UTR isoforms and experimental validation. a RNA-Seq raw data (see Fig.1Bfor legend). b 3’UTRs generated using our own Cufflinks analysis. c 3’UTRs identified using our dedicated workflow applied to the male_IS2014 dataset with the STAR and IsoSCM algorithms. S: short, M: medium, L: long; XL: extra-long. Black vertical box: CDS end; black horizontal bar: 3’UTR. d Relative abundance of the alternative 3’UTR isoforms annotated in silico using our IsoSCM pipeline. e In silico validation of the 3’UTRs annotated using our IsoSCM pipeline by the presence of canonical PASs. Vertical bar = predicted canonical (AAUAAA or AUUAAA) PAS. f Experimental validation by RL-PAT (RNA Ligation mediated PolyAdenylation Test, Table1).✔ = genuine polyA site. *: XL site for Olfr1507, M1 and L sites for Olfr15 could not be tested by RL-PAT due to repeat sequences upstream of the polyA sites. g and h Experimental validation by northern blot. Total OM RNAs were separated on agarose/formaldehyde gels and transferred onto nitrocellulose membranes. The presence of Olfr mRNAs was detected following hybridization with DIG-labeled antisense probes either in the CDS region (CDS probe) or between the 3′S and 3’M ends (3’M probe; see Table3for detailed probe description). g The major isoform of the Olfr1507 mRNA shows a short 3’UTR (≈3-kb dark band with CDS probe, not detected with 3’M probe); additional isoforms having longer 3’UTRs are present at low abundance (4.7 to 6.9-kb faint bands with both probes); ♯ highest band (> 7 kb) corresponds to an intron-retaining transcript for Olfr1507 (Additional File4: Fig. S2). h Olfr15 shows 2 major isoforms, the first one with a short 3’UTR (≈2.5-kb band with CDS probe, not detected with 3’M probe = 3′S), and the second one with a longer 3’UTR (≈4.5-kb band with both probes = 3’M1/2).
5′ intron-retaining transcript displaying the S 3’UTR (Additional file 4: Figure S2). For Olfr15, 3′S and 3’M1/
2 appear as two similarly dominant 3’UTR isoforms. In-deed, the Olfr15 3’M1 resides in a stretch of canonical PAS (11 AAUAAA or AUUAAA sequences from 2487 to 2822 after the stop codon) together with Olfr15 3’M2 (Fig. 3h). The 3’L isoform of Olfr15, not detected using
northern blot, is most probably expressed at a very low level (below the sensitivity of this technique; Fig. 3h). The existence of an XS 3’UTR for Olfr1507 (described by Ibarra-Soria’s study and in the Ensembl database; Fig.
1a) was confirmed by RL-PAT, and this isoform is prob-ably generated using a non-canonical PAS (Table 1). However, this 3’XS isoform is probably expressed at a very low level (below northern blot sensitivity– Fig.3g). Very importantly, northern blot confirmed the relative abundances of the alternative 3’UTR isoforms deter-mined using RNA-Seq quantification (Fig.3d).
In conclusion, our experimental investigations per-formed on these two pilot genes confirmed the data ob-tained in silico using our IsoSCM pipeline, from both the
qualitative (repertoire of 3’UTRs) and quantitative (rela-tive abundances of alterna(rela-tive isoforms) points of view. Altogether, this analysis fully supports the expression of multiple 3’UTR isoforms produced by alternative polyade-nylation, and it further shows that different Olfr genes may produce different patterns of Olfr mRNA isoforms in terms of relative abundance (i.e. 1 highly expressed iso-form plus several others expressed at a low level for Olfr1507 vs. 2 isoforms expressed at similarly high level plus several others expressed at low level for Olfr15).
Characterization of the full repertoire of detectable Olfr 3’UTRs using our IsoSCM pipeline
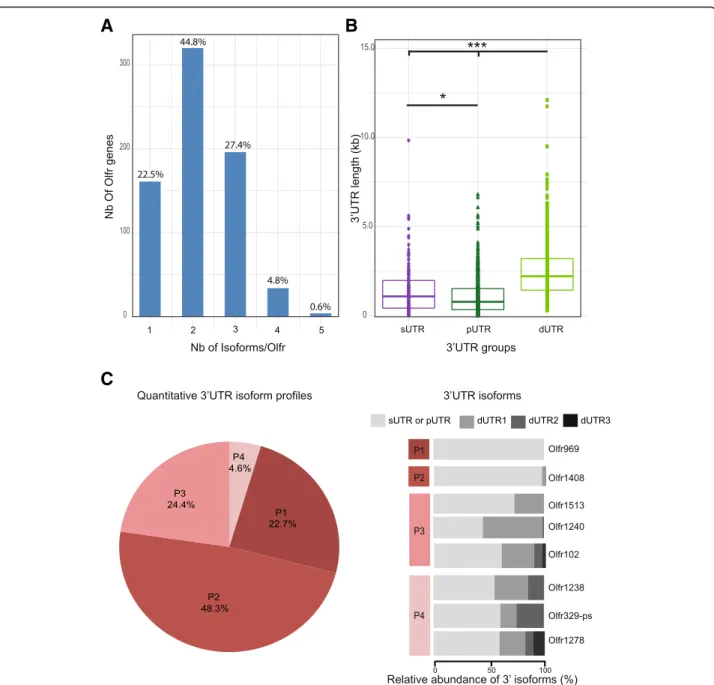
As mentioned above, our IsoSCM pipeline allowed the characterization of 1547 3’UTR isoforms, generated from the 715 Olfr genes annotated from the male_ IS2014 dataset. As for our 2 pilot genes, the great major-ity of the annotated Olfr genes (77.5%) show multiple 3’UTRs due to alternative polyadenylation, 44.8% with 2 isoforms, 27.4% with 3 isoforms and 5.3% with 4 or 5 isoforms (Fig.4a).
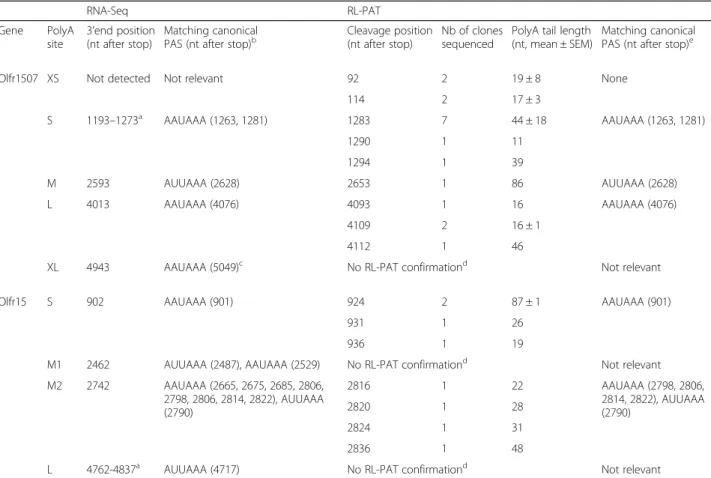
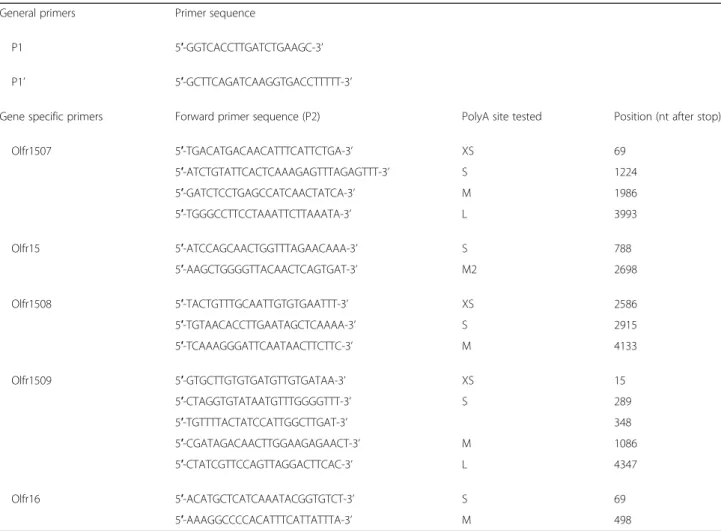
Table 1 Alternative 3′ ends for Olfr1507 and Olfr15 revealed in silico, and their subsequent experimental validation
RNA-Seq RL-PAT Gene PolyA site 3’end position (nt after stop) Matching canonical
PAS (nt after stop)b Cleavage position(nt after stop) Nb of clonessequenced PolyA tail length(nt, mean ± SEM) Matching canonicalPAS (nt after stop)e Olfr1507 XS Not detected Not relevant 92 2 19 ± 8 None
114 2 17 ± 3 S 1193–1273a AAUAAA (1263, 1281) 1283 7 44 ± 18 AAUAAA (1263, 1281) 1290 1 11 1294 1 39 M 2593 AUUAAA (2628) 2653 1 86 AUUAAA (2628) L 4013 AAUAAA (4076) 4093 1 16 AAUAAA (4076) 4109 2 16 ± 1 4112 1 46
XL 4943 AAUAAA (5049)c No RL-PAT confirmationd Not relevant Olfr15 S 902 AAUAAA (901) 924 2 87 ± 1 AAUAAA (901)
931 1 26
936 1 19
M1 2462 AUUAAA (2487), AAUAAA (2529) No RL-PAT confirmationd Not relevant M2 2742 AAUAAA (2665, 2675, 2685, 2806, 2798, 2806, 2814, 2822), AUUAAA (2790) 2816 1 22 AAUAAA (2798, 2806, 2814, 2822), AUUAAA (2790) 2820 1 28 2824 1 31 2836 1 48
L 4762-4837a AUUAAA (4717) No RL-PAT confirmationd Not relevant
aThe 3’ ends distant of less than 100 nt were merged as a single polyA site.bFor each putative polyA site, predicted canonical PAS matching in a [− 100;+ 100] window from the RNA-Seq-deduced 3′ end are indicated.c
Note that for Olfr1507 3’XL isoform, the closest canonical PAS is slightly outside the 100-nt precision window. The cleavage site and polyA tail length were experimentally mapped using RL-PAT on adult male OM, further confirming the polyA site usage for most of the 3’UTR isoforms.d
XL site of Olfr1507, M1 and L sites of Olfr15 could not be confirmed by RL-PAT because no specific forward primer could be designed due to repeat sequences upstream of these polyA sites.eFor each confirmed polyA site, predicted canonical PAS matching in a [− 100;0] window from the identified cleavage sites are indicated
To determine if our pipeline could introduce a bias ex-cluding rare alternative isoforms for Olfr genes expressed at low level, we analyzed the correlation be-tween expression level (based on reads quantification in the CDS) and annotation of multiple isoforms. It was important to determine if Olfr genes for which we
detected a single 3’UTR isoform were expressed at lower abundance as compared to Olfr genes for which we de-tected multiple 3’UTR isoforms. This statistical analysis shows that our pipeline can discriminate between single 3’UTRs and up to 3 multiple isoforms due to APA, inde-pendently of the expression level of the Olfr genes
A
B
C
Fig. 4 A large majority of Olfr mRNAs shows multiple 3’UTR isoforms produced through alternative polyadenylation. The whole male_IS2104 dataset was analyzed using our IsoSCM pipeline. a Distribution of numbers of 3’UTR isoforms per Olfr. b Distribution of length for 3’UTR groups; sUTR = single 3’UTR for Olfr genes without APA (purple); pUTR = proximal 3’UTR isoform (dark green) and dUTR = distal 3’UTR isoform(s) (light green) for Olfr genes with APA. One-way Kruskal-Wallis test (Chi square = 430.62,p < 0.0001, df = 2), followed by Nemenyi test (* p < 0.05, *** p < 0.001). c Distribution of Olfr genes in 4 distinct quantitative 3’UTR isoform profiles. P1 = Olfr genes without APA (their mRNAs present a single 3’UTR), P2 = Olfr genes with APA, the proximal 3’UTR isoform representing more than 80% of the mRNAs (typically, the proximal 3’UTR is the major isoform); P3 = Olfr genes with APA, the proximal 3’UTR isoform representing less than 80% and the sum of the most distal isoforms (dUTR2 to dUTR4) less than 10% (typically, the pUTR and dUTR1 are the main isoforms); P4 = Olfr genes with APA, the proximal 3’UTR isoform
representing less than 80% and the sum of the most distal isoforms (dUTR2 to dUTR4) more than 10% (typically, these Olfr genes have 3 or more isoforms of quantitative importance). Typical examples for these 4 quantitative profiles are shown in the right panel
(Additional file 5: Figure S3A). Nevertheless, we prob-ably underestimate the number of alternative isoforms for genes expressed at low level, as well as mRNA iso-forms expressed at very low levels.
The median length of the 3’UTR isoforms for Olfr mRNAs, deduced in silico with our IsoSCM pipeline, is 1576 nt. This value is however variable from one Olfr 3’UTR to another, with two of them being longer than 10 kb (Fig. 4b). The median length of Olfr 3’UTRs in our
IsoSCM analysis appears to be twice the 773 nt median length previously described by Shum and colleagues [27], and it is higher than the 1278 nt median length obtained with our Cufflinks pipeline on the same data (Mann Whit-ney, p < 0.0001). Considering that, among the 3’UTR iso-forms characterized by our IsoSCM pipeline, some are the only one detected for a given Olfr, while others belong to a group of multiple isoforms generated through APA from a given Olfr gene, we distinguished 3 categories of 3’UTRs. The first category corresponds to the single 3’UTRs (only 1 isoform produced by the Olfr gene; sUTR). We further distinguished 2 additional categories for the multiple iso-forms (as defined in [53]): the isoforms generated by the proximal APA site (pUTRs), and the ones generated by the other(s), thereafter called the distal UTR(s) (dUTRs). Depending on their number, dUTRs will be thereafter called dUTR1, dUTR2 etc., with the incremental number ordered according to their length. Among those 3 groups of 3’UTRs, both sUTRs (median length = 1088 nt) and dUTRs (median length = 2217 nt) annotated with the IsoSCM pipeline appear to be longer than the Olfr 3’UTRs previously described by others [27] (p < 0.001), whereas pUTRs (median length = 782 nt) reach similar length (p = 0.773). Strikingly, pUTRs are significantly shorter than sUTRs (One-way Kruskal-Wallis test, followed by Neme-nyi test, p < 0.01; Fig.4b). As expected, dUTRs are signifi-cantly longer than both pUTR and sUTRs (One-way Kruskal-Wallis test, followed by Nemenyi test, p < 0.001; Fig. 4b). The resultant median of length ratio dUTR1/ pUTR for Olfr genes with multiple 3’isofoms reaches 2.58. Thus, our analysis using our IsoSCM pipeline allowed us to uncover a previously unsuspected much higher global length of the annotated Olfr 3’UTRs produced by APA, and demonstrated that alternative polyadenylation of Olfr mRNAs generates a global lengthening of 150% of their 3’UTRs.
Further hierarchical clustering with Principal Compo-nent Analysis (PCA) analysis (see methods) of the in silico relative quantification data led us to consider 4 distinct relative-abundance profiles of 3’UTRs (Fig. 4c). Results from PCA based on the relative abundance and length of alternative isoforms demonstrated that three principal components (PCs) had eigenvalues more than 1 (Kaiser’s criteria) and were retained. Cumulative vari-ance explained by these three PCs was 86.51%. The P1
relative-abundance profile (22.7%) contains all Olfr genes producing a single 3’UTR (no APA). The P2 pro-file (48.3%) contains Olfr genes producing at least 2 iso-forms, including a major proximal isoform, the sum of the distal isoforms representing less than 20% of the mRNAs. For the remaining Olfr genes producing at least 2 isoforms including one representing less than 80%, we distinguished two additional classes: a P3 profile (24.4%) for Olfr genes presenting a proximal and one distal iso-form being of quantitative importance (the sum of the other distal isoforms representing less than 10% of all isoforms), and a P4 profile (4.6%) for Olfr genes produ-cing 3 or more isoforms of quantitative importance (the sum of dUTR2 to dUTR4 isoforms representing more than 10% of the mRNAs). Thus 29% of annotated Olfr genes produce several 3’UTR isoforms of quantitative importance (P3 or P4 profiles), as for Olfr15 (Figs. 4c and 3d and h). In 71% of annotated Olfr genes an iso-form represent more than 80% of the isoiso-form either be-cause it is a unique (P1 profile) or a major (P2 profile) isoform, as for the Olfr1507 pilot gene (Figs. 4c and 3d and g).
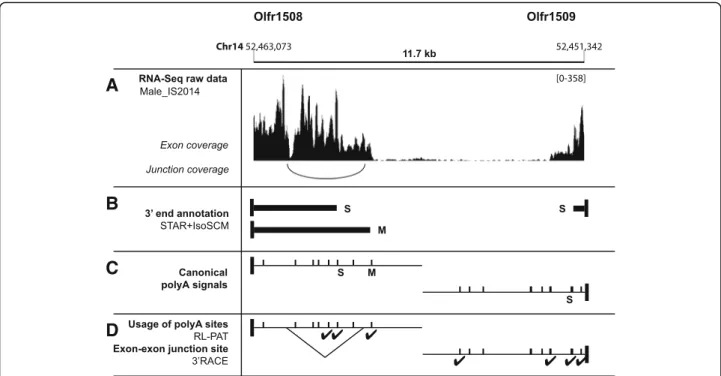
To characterize the contribution of alternative splicing to the 3′ alternative isoforms of Olfr mRNAs, we identi-fied the introns included in this new 3’UTR repertoire. It turned out that only 13 Olfr genes display an obligatory or optional intron in their 3’UTRs with a depth > 1 (male_ IS2014 dataset, Additional file6: Table S3). As an example, the 3’M isoform of Olfr1508 is subject to an optional in-tron excision detected by STAR (Fig.5a-c). This optional splicing was further confirmed by RT-PCR amplification (3’RACE, Rapid Amplification of cDNA Ends; Fig.5d).
Overall, although a large majority of Olfr mRNAs shows alternative 3’UTR isoforms, mostly produced by APA, we observed great diversity in terms of length and/or relative abundance of these multiple isoforms. Moreover, a subset of Olfr mRNAs showed no detectable alternative 3’UTR using our pipeline, suggesting possible diverse regulation of APA among the Olfr gene family.
Among the Olfr gene family, the Class I Olfr genes rep-resent a small sub-family (135 genes on chromosome 7) [14], and we wondered if APA was differently regulated for these Class I Olfr genes. Class I Olfr mRNAs are clearly less abundant than Class II Olfr mRNAs in the OM. However, we detected no bias associated with the ex-pression level in the detection of one or multiple 3’UTR isoforms for the Class I Olfr genes (Additional file7: Fig-ure S4A). We discriminate between single 3’UTRs and up to 3 multiple isoforms due to APA independently of the expression level for Class II Olfr genes (Additional file7: Figure S4B). We found 145 3’UTR isoforms produced from 72 Class I Olfr genes and 1400 3’UTR isoforms pro-duced from 643 Class II Olfr genes. Both Class I and Class II Olfr genes display the massive APA demonstrated above
(77.8 and 77.4% APA respectively; Fig. 6a). The median lengths of the sUTRs, pUTRs or dUTRs are not signifi-cantly different between Class I and Class II Olfr genes (Fig.6b; Wilcoxon rank sum test: sUTR (p = 0.93), pUTR (p = 0.39), dUTR (p = 0.48)). Likewise, the quantitative profiles of the 3’UTR isoforms do not show any difference between Class I and Class II Olfr genes (Fig.6c). Overall, these two Olfr gene sub-families display similar APA pro-files (p = 0.7).
Comparison of 3’UTR isoforms annotated from 4 datasets reveals robust 3’UTR isoforms in both sexes, and no sex-specific 3’UTRs
All the above analyses were done on the RNA-Seq data-set from 3 adult male OM published by Ibarra-Soria and colleagues in 2014 (male_IS2014) [26]. In the same paper, a second dataset was obtained from 3 adult fe-male OM (referred to as fefe-male_IS2014). An independ-ent experimindepend-ent with both adult male (male_IS2017) and adult female (female_IS2017) datasets was recently pub-lished by the same authors [40]. We took advantage of the availability of these 4 datasets produced by the same laboratory to evaluate the robustness of our IsoSCM pipeline and to compare the Olfr 3’UTR repertoires be-tween females and males.
Global comparative analysis of the annotations from the 4 datasets
We processed these data with our IsoSCM pipeline to annotate the Olfr 3’UTRs. While the absolute numbers of annotated Olfr genes and 3’UTR isoforms obtained in the 4 datasets differ (715, 834, 625 or 743 annotated Olfr genes and 1547, 1810, 1344 or 1565 3’UTR isoforms for the male_IS2014, male_IS2017, female_IS2014 or fe-male_IS2017 datasets, respectively), these repertoires display a large overlap from one sample to another (Additional file 8: Figure S5A-D). As was the case for the male_IS2014 dataset, the detection of multiple (up to 3) 3’UTR isoforms did not depend on the expression level of the Olfr genes in the 3 other datasets (Additional file5: Figure S3).
We however observed a differential expression of the Olfr genes between the samples from the 2 independent experiments (Additional file 8: Figure S5E-H). Whereas male and female samples from the same experiment had similar expression levels, samples from the same sex from different experiments show significantly different expression levels, with an increased normalized expres-sion in the 2017 experiment as compared to the 2014 experiment. This was not surprising because these 2 ex-periments are not biological replicates; they differ in ani-mal housing conditions, sample preparation (stranded
A
B
C
D
Fig. 5 New annotations for Olfr1508 and Olfr1509 3’UTR isoforms and experimental validation. a RNA-Seq raw data within a 11.7-kb region comprising both Olfr1508 and Olf1509 3’UTRs (see Fig.1b for legend). Junction coverage is shown for the Olfr1508 strand. b 3’UTRs identified using our IsoSCM pipeline processing the male_IS2014 dataset. Black vertical box: CDS end; black horizontal bar: 3’UTR. c In silico validation of the 3’UTRs annotated using our IsoSCM pipeline by the presence of canonical PASs. Vertical bar = predicted canonical (AAUAAA or AUUAAA) PAS. d Experimental validation by RL-PAT.✔ = genuine polyA site. The optional splicing in the 3’M of Olfr1508 has been confirmed by 3’RACE (3′ Rapid Amplification of cDNA ends). S: short, M: medium
vs. not), read length (100 vs. 75 nt) and sequencing tech-nology (Illumina HiSeq 2500 vs. 2000). This may explain the increased number of Olfr genes with annotated 3’UTRs in the second experiment.
In addition, because the uncertainty regarding the pos-ition of polyadenylation sites reaches 200 nt between 2
annotations, we considered 3’UTR isoforms as “con-served” between 2 datasets when the length difference be-tween the corresponding 3’UTRs annotated in the 2 datasets is less than 200 nt. According to this rule, 483 s/ pUTRs (of 639 Olfr genes annotated in both male data-sets) and 247 dUTR1s (of 561 Olfr genes with an
A
B
C
Fig. 6 Class I and Class II Olfr mRNAs show similar patterns of alternative polyadenylation. a Distribution of numbers of 3’UTR isoforms per Olfr. b Comparison between Class I and Class II Olfr genes’ distribution of length for 3’UTR groups. Mann–Whitney test (ns p > 0.05). See Fig.4for the definition of the groups. c Distribution of Olfr genes in 4 distinct quantitative 3’UTR isoform profiles. See Fig.4for the definition of the profiles. A Fisher-Freeman-Halton exact test shows no significant difference (p = 0.76)
annotated dUTR1 in at least one male dataset, and 446 in both male datasets) are conserved between the 2 male ex-periments (Additional file3: Table S2). Since the coverage decreases along the 3′ regions, the most distal 3’UTRs (dUTR2, dUTR3 and dUTR4) show higher probability to be either missed or misplaced (due to reduced precision of the assembly). Accordingly, the length of same-rank UTRs is better conserved between the 2 male datasets for single or proximal 3’UTR isoforms (75.6% “conserved” s/ pUTRs), than for the distal 3’UTR isoforms (55.4% “con-served” dUTR1s; 51.4% dUTR2s, 35.7% dUTR3s). The rare Olfr genes showing dUTR4 isoforms were not the same in the 2 male datasets. Therefore, we focused on sUTR, pUTR and dUTR1 3’UTR isoforms when compar-ing 3’UTR isoforms produced by individual Olfr genes in the different datasets.
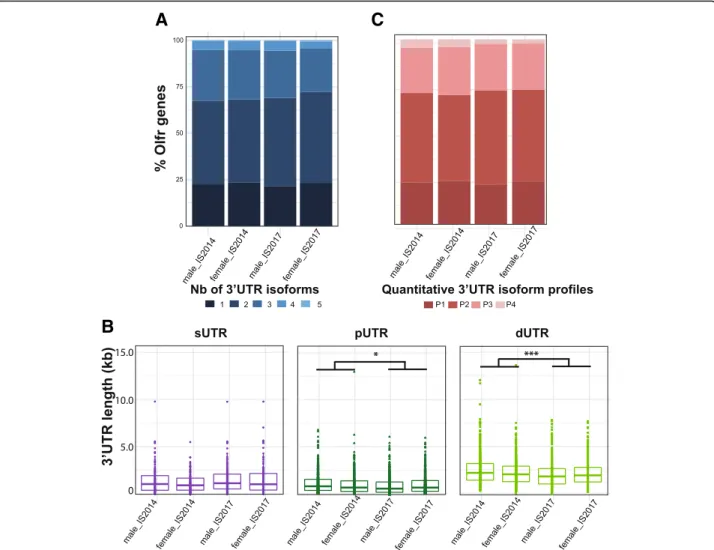
The global analysis of these 4 datasets confirmed a substantial APA for Olfr mRNAs both in male and fe-male (77.5, 78.4, 76.6 and 76.7% of the annotated Olfr genes in the male_IS2014, male_IS2017, female_IS2014 or female_IS2017 datasets; Fig.7a). As for the first data-set of male_IS2014, we observed a large diversity in the length of the 3’UTRs, with significantly different lengths between the sUTRs, pUTRs and dUTRs within each dataset. There was no difference between the 4 datasets in terms of 3’UTR length for either sUTRs or pUTRs (Fig.7b), or in their relative abundance profiles (Fig.7c). However, a significant difference in dUTR length was observed between the 2 experiments (2014 vs. 2017), al-though not between male and female datasets (Fig. 7b). For all parameters examined between the 4 datasets, these global investigations thus did not reveal striking differences, except a length difference for dUTRs be-tween the 2014 and 2017 experiments, probably due to the technical differences in these 2 experiments.
Comparative analysis of the annotations for individual Olfr genes common to the 4 datasets
Five hundred and one Olfr genes with at least one anno-tated 3’UTR isoform were retrieved in all 4 datasets. Our 2 pilot genes, Olfr1507 and Olfr15, turned out to belong to this group of 501 common Olfr genes. Their detailed in silico analysis globally confirmed the robust-ness of our pipeline across independent datasets, in terms of alternative 3′ ends and length of the 3’UTRs, even though minor differences were observed (Add-itional file9: Figure S6; Additional file10: Table S4). The absence of detection of 2 distinct 3′ ends for the 3’M1/2 PAS of Olfr15 could be attributed to the presence of a stretch of canonical PAS (see above). A very rare 3’XL was detected only in female_IS2014 but in neither male nor in female_IS2017 datasets. This discrepancy might be explained by the limit in sensitivity of our technique for isoforms expressed at a very low abundance. From a
quantitative point of view, the relative abundance pro-files of 3’UTR isoforms are not statistically different for these 2 genes across the 4 datasets (Fisher exact test Olfr1507 p = 1; Fisher exact test Olfr15 p = 0.24; Add-itional file9: Figure S6).
This robustness encouraged us to further compare the annotations of Olfr genes between the 4 datasets (Add-itional file 3: Table S2). We first searched for isoforms that are experiment-specific i.e. not conserved in same-sex comparisons (male_IS2014 vs. male_IS2017 and fe-male_IS2014 vs. female_IS2017) but conserved between males and females in both experimental series (male_ IS2014 vs. female_IS2014 and male_IS2017 vs. female_ IS2017 comparisons). Among the 501 common Olfr genes across the 4 datasets, we identified 27 experiment-specific s/pUTRs. Focusing on the 324 Olfr genes with multiple 3’UTR isoforms in the 4 datasets, we found 21 experiment-specific dUTR1s. On the other hand, we identified putative sex-specific isoforms, i.e. conserved in same-sex comparison but not conserved between males and females in both experimental series. Only 4 s/pUTRs (for Olfr133, Olfr1107, Olfr618 and Olfr1226) and 5 dUTR1s (for Olfr476, Olfr796, Olfr1226, Olfr653 and Olfr11271) display such an apparent sex difference (Additional file3: Table S2). Thus, as far as we can con-clude from this study of 501 Olfr genes, we identified only marginal possibilities of sex-associated APA events in the 3’UTRs of Olfr mRNAs, whereas some experiment-specific annotations of Olfr 3’UTRs may arise because of technical differences between the 2 sets of experiments. By contrast, we annotated 310 s/pUTRs and 114 dUTR1s that are fully conserved in the 4 data-sets analyzed (independently of the experiment series or the sex of the mice, Additional file 3: Table S2). These annotations constitute a list of very robust 3’UTR iso-forms for Olfr mRNAs. Finally, we found only 6 Olfr genes with introns in 3′ regions in the 4 datasets (Olfr1508, Olfr273, Olfr303, Olfr399, Olfr620, Olfr706), and no sex-specific splicing events (Additional file 6: Table S3).
Altogether, our data demonstrate that the new Olfr 3’UTR repertoire identified through our IsoSCM pipeline correspond to cognate 3’UTR ends expressed in the adult olfactory mucosa, and that the large majority of these in silico characterized 3’UTRs are robustly identified independently of the biological or technical variations introduced by the choice of the RNA-Seq datasets. Overall, it is likely that the few minor differences observed between male and female result from the intrinsic limits of our approach in terms of sensitivity and precision. In any case, there are no striking sex differences in the 3’UTR isoforms of Olfr mRNAs, for any of the parameters we examined.
Discussion
A new landscape of 3’UTRs for Olfr mRNAs Extensive alternative polyadenylation of Olfr mRNAs
The spectacular development of high-throughput se-quencing during the past decade uncovered the produc-tion of alternative mRNA isoforms from a growing number of genes. It turned out that alternative polyade-nylation is widely used in biological systems, and even more particularly in the nervous system [61]. Whereas previous RNA-Seq analyses already identified multiple isoforms through Cufflinks annotation for a large num-ber of Olfr mRNAs, these multiple isoforms were mostly the result of alternative transcription start sites and
alternative splicing in the 5’UTR [26, 27]. Using a dedi-cated pipeline, we uncovered extensive APA for Olfr mRNAs in the adult mouse olfactory mucosa (76.6– 78.4% of the annotated Olfr genes), allowing us to docu-ment a novel level of diversity of Olfr gene products. Im-portantly, we confirmed experimentally for the first time, for two representative Olfr genes, the repertoire of 3’UTR isoforms predicted by our computational pipe-line. We further showed that 3’UTRs of Olfr mRNAs are rarely subject to alternative or optional splicing, an ob-servation in line with the very low number of exons de-tected in the STAR output in the 3’UTRs of Olfr mRNAs (Additional file 6: Table S3). Thus, we
B
A
C
Fig. 7 Comparison of the Olfr 3’UTR annotations between 4 datasets from adult olfactory mucosa. The male_IS2104, female_IS2014, male_IS2017 and female_IS2017 datasets were analyzed using our IsoSCM pipeline. a Distribution of numbers of 3’UTR isoforms per Olfr. A Fisher-Freeman-Halton exact test shows no significant difference (p = 0.75). b Distribution of sUTR, pUTR and dUTR lengths. The length of sUTRs (left panel) does not appear statistically different between the 4 datasets (two-way ANOVA: experiment effect, F(1, 656)= 2.45,p > 0.05; sex effect, F(1, 656)= 0.88,p > 0.05; no interaction). Whereas the length of pUTRs (middle panel) is significantly lower in the 2017 experiment as compared to the 2014 one (two-way ANOVA: experiment effect, F(1, 2253)= 5.34,p = 0.03; sex effect, F(1, 2253)= 0.18,p > 0.05; no interaction), this difference falls into the 200-nt uncertai200-nty window and may thus not reflect a genuine difference between these 2 experime200-nts. The length of dUTRs (right panel) is statistically different between the 4 datasets (two-way ANOVA: experiment effect, F(1, 3319)= 17.38,p < 0.001; sex effect, F(1, 3319)= 3.06,p > 0.05; no interaction). c Distribution of Olfr genes in 4 distinct quantitative 3’UTR isoform profiles. See Fig.4for the definition of the profiles. A Fisher-Freeman-Halton exact test shows no significant difference (p = 0.37)
demonstrate that the diversity of the Olfr mRNAs in terms of 3’UTRs is essentially the result of APA events.
Longer Olfr 3’UTRs than previously proposed
In a recent study based on the use of Cufflinks, Shum and colleagues reported that the Olfr mRNAs have exception-ally short 3’UTRs, with a median length of 773 nt [27]. In the present study, we clearly disprove this view, thanks to the use of a more appropriate method for 3’UTR analyses. As compared to Cufflinks, IsoSCM not only allows much better detection of APA, but also improves the detection of full-length UTRs (e.g. by merging transcript fragments sep-arated by small gaps) [41]. We have established that the median length of single 3’UTRs is 1.0–1.2 kb (depending on the dataset considered). While the median length of proximal 3’UTRs ranges from 0.6 to 0.8 kb, the median length of the distal 3’UTRs reaches 1.9 to 2.2 kb in the adult OM. Thus, the 3’UTR length of the Olfr genes falls in the range of the 3’UTR length reported for other mouse genes in various studies [32,62,63]. Among the Olfr genes with multiple 3’UTR isoforms (in the male_IS2014 dataset), we noticed that the shortest isoform (pUTR) is generally the most highly expressed (true for 95% of Olfr genes with 2 or more 3’UTR isoforms; Additional file3: Table S2). Thirty-eight % of the Olfr genes with multiple 3’isoforms have dis-tal isoforms of quantitative importance (i.e. belongs to the P3-P4 quantitative profiles vs. P2). The fact that pUTRs are significantly shorter than sUTRs argues for a specific prox-imal UTR population, distinct from single UTRs.
Validation of our pipeline
Comprehensiveness of our 3’UTR annotations
In their original RNA-Seq analysis, Ibarra-Soria and col-leagues [26] reported the annotation of 913 Olfr full-length gene models. Focusing on the identification of 3′ ends, our pipeline allowed the accurate annotation of only 600–800 of Olfr genes, depending on the dataset (corre-sponding to 53.8–71% of the expressed Olfr genes). Con-sequently, our description of the 3’UTR landscape for Olfr mRNAs is not comprehensive. The analyses of the 4 data-sets presented here show many substantial variations in the number, length and/or relative abundance of 3’UTR isoforms for individual Olfr genes (Additional file3: Table S2; Additional file 9: Figure S6 and Additional file 10: Table S4 for the pilot genes), most probably for the follow-ing reasons. Even with the same genetic background (C57Bl6) and similar age of the 2 groups of adult males or females, unavoidable biological differences may arise in in-dependent same-sex datasets. In addition, some technical differences such as sample preparation (stranded vs. non-stranded) and Illumina sequencing system (2000 vs. 2500, with respective read length of 75 vs. 100 nt) are likely pro-ducing differences in the 3′ end annotations between the 2 experimental series. Overall, some intrinsic features of
the Olfr gene family and their regulated expression limit the depth of our analysis, as well as caveats of our pipe-line: 1) low coverage in 3′ regions as compared to the requisite of the IsoSCM method; 2) heterogeneity in coverage in 3′ regions; 3) biases due to the 100-nt preci-sion (such as those discussed below for very short 3’UTRs); and 4) interference between contiguous genes (such as improper fusions between 2 Olfr gene products).
Coverage in 3′ regions One major limitation of our study is the relatively low abundance of Olfr mRNAs within the entire olfactory mucosa, which may affect both the number of annotated genes and the precision of the annotation generated by IsoSCM. This is illustrated by the fact that the Olfr relative expression level is higher in the Ibarra-Soria 2017 experiment than in the 2014 one, and the resulting numbers of annotated Olfr genes are higher in the 2017 Ibarra-Soria et al. analysis (Additional file 8: Figure S5). Moreover, the RNA-Seq read coverage is not uniform due to experimental biases [41]. In particular, a positional bias has been observed, generating a lower coverage in 3′ regions of the mRNAs than in upstream re-gions [64]. Consequently, most of the distal UTRs are under the minimal expression threshold of 200 reads/kb required for a 100-nt precision of the IsoSCM annotation tool (with a 10% false positive rate) [41]. Accordingly, we observed that the dUTRs are less conserved at a fixed rank between the 2 male datasets than sUTRs or pUTRs, and that the conservation decreases with the rank of the dUTRs (dUTR1 > dUTR2 > dUTR3 > dUTR4). Moreover, non-coding sequences show an increased frequency of re-peat sequences as compared to CDSs, producing gaps in the UTR coverage [65]. Thus, a large part of the variability observed between the datasets may be attributed to this heterogeneous and low coverage in 3′ regions, even lower in distal isoforms.
Very short 3’UTRs In our pipeline, we excluded all 3′ ends occurring within the CDS, but we retained 3′ ends lo-cated downstream and very close to the stop codon of Olfr genes (3’UTR length < 100 nt). Some of these very short 3′ ends could actually occur within the CDS given the 100-nt precision window, or could be artifacts due to a dissimilar coverage between the CDS and the downstream sequence. It should be further noted that the relative abundance of these very short 3’UTRs may be inaccurate, due to the cal-culation method used. Therefore, the reliability of these very short 3’UTRs (representing 11.9% of the Olfr genes an-notated in both male datasets and 12.5% for both female datasets) is probably not as strong as that of longer ones. Accordingly, only half of these very short 3’UTRs are con-served in inter-experiment comparisons (51.3% for males, 49.3% for females), whereas 75% of the proximal or unique
3’UTRs (without length threshold) are conserved in these comparisons.
Fusion transcripts between adjacent Olfr genes Along the development of our pipeline dedicated to Olfr 3’UTRs’ characterization, we obtained transcripts corresponding to the fusion of 2 Olfr genes (18–61 Olfr genes concerned de-pending on the dataset considered; Additional file2: Figure S1E-H,). Chimeric mRNAs have been widely studied in pathological contexts, such as cancer [66], but their occur-rence in physiological situations is a matter of debate, and detection of these fusions is one of the challenges of RNA-Seq analyses. They are either technical artifacts (e.g. tem-plate switching of reverse transcriptase), or trans-splicing products and read-through events, especially in regions with higher gene density [67,68]. Olfr genes present many distinctive features including an expression pattern essen-tially restricted to OSNs, the rare possibility of 2 or more Olfr co-expression in one developing OSN [69–71] and high gene density as compared to the mean gene density in the mouse genome. Thus, the fusions observed in Olfr transcript annotation could result from: 1) technical arti-facts, 2) continuity in the coverage between independent transcripts from two adjacent Olfr genes, or 3) genuine chimeric RNAs. Evidence for such chimeric Olfr1030 and Olfr1031 RNA was recently obtained by single-cell RNA-Seq analysis [69]. However, in the case of the continuous coverage in the 3′-3′ inter-CDS region of Olfr1508 and Olfr1509 genes, we favor the hypothesis of the coverage superposition of 2 independent transcripts (Fig. 5a). Since these genes are on opposite strands, we can exclude a chimeric RNA leading to co-expression of both proteins. In our pipeline, we restricted trans-splicing possibilities (set-ting a maximal size for introns) and we limited the merge_ radius parameter to limit the creation of presumably artifactual fusions. Then, we decided to discard all fusion events involving Olfr 3’UTRs from our analysis. Conse-quently, we decreased the comprehensiveness of our study, and over-estimated the relative abundance of the remaining isoforms. For example, the 2 more distal 3’UTRs of Olfr1509 were experimentally validated by RL-PAT but were not annotated through our pipeline (Fig.5b-d). To go further, the discrimination between false positive and true positive fusion events would require a targeted and exten-sive experimental validation, or a dedicated study of single-cell RNA-Seq datasets.
Canonical polyA signals at 3′ ends
From our study, it emerged that only 66.8 to 69.7% of 3’UTRs (without merging the neighboring 3′ ends) can be generated by the use of canonical PASs (AAUAAA and AUUAAA) placed in the [− 100;+ 100] precision window. This raised the question of the validity of those other 3’UTRs generated by our pipeline, having no correlation
with well placed canonical PASs. In fact, these percentages perfectly fit with those previously characterized in other tissues. In mouse cDNA/EST, about 75% of polyA sites are associated with AAUAAA or AUUAAA hexamers [60]. In the brain, 40 to 70% of the 3′ ends are associated
with these hexamers, depending on the subsets of 3′ ends analyzed [62]. Additionally, up to 16 variant hexamers have been characterized in mouse [72]. In the mouse ret-ina analyzed at different developmental stages, 85% of the 3′ ends are associated with the AAUAAA hexamer or the most common 12 variants in human [33]. A residual part of the 3’UTRs is associated with neither canonical PASs nor variants, and there is growing evidence for functional non-canonical PASs [73]. Some Olfr 3′ ends may result
from the use of either a variant canonical signal or a non canonical signal, as this is most probably the case respect-ively for Olfr16 3’M and Olfr1507 XS 3’UTRs (Add-itional file10: Table S4). Thus, we can conclude that Olfr genes, like other genes and with roughly the same propor-tions, probably use canonical, variant and non-canonical PASs for generating diverse 3’UTRs.
Functional significance of Olfr APA Diverse APA profiles of Olfr mRNAs
Using our computational pipeline, we showed that only 21–23% of the Olfr genes unambiguously identified in the present study produce a single detectable 3’UTR. Of the remaining Olfr genes with multiple 3’UTR isoforms, 2/3 show a main isoform (relative abundance > 80%), whereas 1/3 show 2 or more main isoforms. Thus, APA seems to be widely used to generate alternative 3’UTR isoforms within the large Olfr gene family, and the extent to which APA is used is apparently differently regulated depending on the Olfr gene considered. We were surprised to notice that 3 Olfr genes belonging to the same OR sub-family, Olfr1507, Olfr1508 and Olfr1509 [14], show diverse APA profiles (Figs.3and5). The Olfr1507 and Olfr1508 genes were recently duplicated from an ancestral gene, with 92% identity in the coding regions [74]; however, their 3’UTR
isoforms differ in number, length and relative abundance profiles. Since Class I and Class II Olfr genes show no dif-ference in APA, the determinants for this diversification of APA profiles between subsets of Olfr genes remain to be identified.
We cannot exclude that the Olfr genes for which we detected a single 3’UTR isoform in the present study may be subject to APA at other developmental stages, or under different physiological circumstances (i.e. depend-ing on olfactory stimuli). Likewise, it remains to be de-termined if an Olfr characterized by one of the 4 profiles (P1, P2, P3 or P4), defined here depending on the rela-tive expression levels of the multiple isoforms, may switch to another profile under different circumstances. Our study focused on adult whole olfactory mucosa and
a choice of different physiological situations should now be investigated. Lengthening of 3’UTR by APA during mouse embryonic development has been reported [32]. Extension of 3’UTR occurs in a tissue-specific manner in mouse neural tissue and along the differentiation of neurons from pluripotent ES cells [62, 75]. In Drosoph-ila, lengthening of 3’UTR was observed during the devel-opment of the central nervous system [31]. More recently, extension of 3’UTR by APA was demonstrated during the mouse retinal development [33]. The neur-onal activity is also critical for the 3’UTR length regula-tion by APA [39, 76], as well as the pathological or lesion/regeneration contexts [77]. Even the relatively rare alternative isoforms may indeed be of physiological im-portance in the olfactory sensory neurons, if they have a specific role or subcellular compartmentalization (see below) as compared to the main isoform(s).
No clear evidence for sexual dimorphism in Olfr 3’UTRs
We took advantage of the availability of similar male and female datasets to investigate possible sex-specific differ-ence in the repertoires of 3’UTRs of Olfr mRNAs expressed in the adult olfactory mucosa. We observed no sex-specific introns and no global differences in APA, in terms of APA distribution, length of single proximal and distal 3’UTRs, or on the quantitative 3’UTR isoform profiles of Olfr mRNAs between male and female. More-over, 3 out of the 4 sex-specific pUTRs identified belong to the very short 3’UTR category (< 100 nt for at least one of the datasets), raising the question of their reliabil-ity. Therefore, while we cannot rule out the possibility of sex-specific 3’UTR isoforms for some individual Olfr genes, if these isoforms exist, they would involve a small number of these genes. It has already been shown that the Olfr expression level was highly similar between males and females [26], except for the Olfr1347 receptor. This particular Olfr is not annotated in 3 out of the 4 datasets, and the analysis of the coverage argues in favor of a conserved sUTR for Olfr1347 between males and females. Thus, it seems very unlikely that sex-specific 3’UTR isoforms of Olfr mRNAs play a role in sexually dimorphic behaviors linked to odor detection; these be-haviors were rather proposed to be due to sex-specific handling of olfactory information by central circuits [78].
Functional role for Olfr 3’UTR isoforms
The fact that the distal 3’UTRs of Olfr mRNAs are much longer than the proximal 3’UTRs opens new avenues for the discovery of regulating sequences or structures spe-cific to the alternative 3′ regions, such as sequences ded-icated to the regulation of the mRNA metabolism, translation or subcellular localization. Interestingly, sev-eral mRNAs transported in axons are specific alternative
isoforms with a long 3’UTR, which undergo regulated local translation [34–38, 79]. There is compelling evi-dence for the localization of Olfr mRNAs in OSN axons, and for their local translation [6, 7,80], and our present work demonstrates that they exhibit alternative polyade-nylation. Thus, the identification of any axon specific 3’UTR isoforms of the Olfr mRNAs should be investi-gated. Additionally, it will be of critical interest in future studies to determine if all multiple 3’UTR isoforms gen-erated by a given Olfr gene are co-expressed by the same OSNs, or if the different isoforms are differentially expressed by different neurons. This might well be the case, given the fact that, because of the continuous neurogenesis occurring in the OM, the adult OM con-tains both immature and mature OSNs. Because of the known regulation of APA occurring as a system de-velops, it is possible that immature and mature OSN ex-pressing the same Olfr may express different 3’UTR isoforms of the corresponding Olfr mRNA.
Conclusions
The family of odorant receptor genes is the largest gene family in mammals, which provides a unique opportun-ity to study the diversopportun-ity and variations of 3’UTRs for a large number of phylogenetically closely related genes within a given species. To study the 3’UTR isoforms of the Olfr genes, we developed a new dedicated pipeline and applied it to RNA-Seq datasets obtained from adult mouse olfactory mucosa of both sexes. The annotations obtained were further validated by multiple experimental approaches on pilot genes, and canonical or variant polyA signals were found associated with these 3′ ends identified in silico. Whereas most of the Olfr genes show variations in 3’UTR length, we detected only rare spli-cing events downstream stop codons. Thus, we demon-strated that a large number of Olfr genes produce multiple 3’UTR isoforms, mostly generated through al-ternative polyadenylation. Strikingly, the diversity in 3’UTRs for the Olfr gene family seems similar to the di-versity observed for the whole genome. This alternative polyadenylation is dependent neither on the sex of the animals, nor on the Class I vs. Class II Olfr gene sub-families. Thus, the determinants for the APA regulation of Olfr genes remain to be investigated.
In this study, we chose to explore publicly available RNA-Seq datasets from adult mouse whole olfactory mucosa. While RNA-Seq became the reference method for high-throughput characterization of the transcrip-tome, alternative dedicated methods now exist to char-acterized more specifically the 3′ ends of mRNAs, such as 3′-seq [81] or PAPERCLIP, even at a cell-type specific level [82,83]. However, the pipeline used in the present study could be extended to different situations for which RNA-Seq data is either available or easy to obtain, such
as: 1) subpopulation of cells in the olfactory mucosa (e.g. FACS-sorted OSNs from OMP-GFP mice); 2) whole ol-factory mucosa from animals of different ages or differ-ently exposed to olfactory stimuli; 3) mouse tissues where Olfr genes are ectopically expressed; 4) olfactory mucosa from other species (e.g. humans). These analyses are clearly beyond the scope of this paper, but they will provide valuable information regarding the regulation of Olfr APA in various circumstances, hence providing hy-potheses regarding the functions of Olfr alternative 3’UTR isoforms. Interestingly, the 3’UTR length of odor-ant receptor mRNAs was shown to be highly variable in human (2.8 ± 2.0 kb for a subset of genes annotated with Cufflinks) [84], and we anticipate that the alternative polyadenylation of odorant receptor mRNAs could be a common feature in Mammals. Our prediction is that al-ternative 3′ regions may include specific sequences or structures important for the different roles played by the odorant receptors in the development and function of the olfactory system.
Methods
RNA-Seq analysis Hardware and software
This pipeline was constructed on a GNU/Linux operat-ing system (Ubuntu 14) eight cores and 96 GB of RAM, as well as 2 TB of hard drive space.
The computational pipeline is a complete bash shell and perl scripts using internal implementation or exter-nal software for aexter-nalyzing RNA-Sequencing, available at
https://github.com/doulazmi/Olfr_RNAseq. The analysis steps are expressed in terms of parsing input files to out-put files as part of the overall workflow (Fig.2).
Data sets analyzed
Sequencing fastq raw files with RNA-Seq PRJEB1365 [26] and PRJEB5984 [40] were downloaded from the European Nucleotide Archive (ENA).
Preparation of reference genome
The reference genome for mouse (mm10) was downloaded in compressed FASTA format from UCSC’s genomes (Uni-versity of California, Santa Cruz). Furthermore, the com-prehensive gene annotation for mm10 was downloaded in the GTF format from GENCODE (Release M14; GRCm38.p5).
RNA-Seq data processing and alignment
Paired-end read files were aligned to version mm10 of mouse reference genome and transcriptome using STAR 2.5.1b [85] with the following flags -runThreadN 7 --outSAMtype BAM SortedByCoordinate --outSAM-strandField intronMotif --outFilterIntronMotifs Remove-Noncanonical --alignIntronMax 23,000.
Threshold for maximal intron size was set to 23 kb, since the largest coherent 5′ intron described for an Olfr in GRCm38.p5 reaches 22.628 pb (Olfr872).
STAR output files in BAM format were sorted and indexed with SAMtools 1.5 [86].
Preparing a mask file in bed format restricted to the Olfr loci in mouse
In order to reduce computational time, and to limit the impact of non-Olfr genes on Olfr transcript assembly, we applied a mask restricted to Olfr genomic regions be-fore IsoSCM and Cufflinks assemblies.
Starting with the GTF file downloaded from GEN-CODE (GRCm38.p5), and using an in-house perl script, we extracted Olfr CDS positions based on Olfr name. Consequently, most of Olfr pseudogenes (without known CDS) were discarded. To take into account the possibility of alternative CDSs, we defined CDS position for each gene as the maximal distance from start to stop codons of all isoforms. We then calculated the distance to upstream and downstream CDS for each Olfr. For Olfr190 and Olfr912, we retained the 2 distinct loci an-notated for each of these genes. In databases, Olfr643 presents an alternative transcript overlapping with mul-tiple Olfr genes (ENSMUST00000138055.1); since it was undergoing non-sense mediated mRNA decay, this par-ticular transcript was discarded from our list. As Olfr56 shows multiple transcripts in databases (some overlap-ping with multiple genes due to very large introns), we kept the whole region between Olfr1396 et Olfr1394, in-cluding the most probable Olfr56 CDS (CCDS24597.1 Chr11:49134290–49,135,141) and eliminating the longer Olfr56 transcripts.
We defined Olfr genomic regions as the regions in-cluding a single or consecutive Olfr CDSs from the proximal end of the closer upstream non-Olfr gene to the proximal end of the closer downstream non-Olfr gene. As Olfr161 has no upstream non-Olfr gene on chromosome 16, the upstream inter-CDS distance was arbitrarily set to 25 kb. Gene density in Olfr genomic re-gions was calculated as the distance from the down-stream end of the non-Olfr CDS updown-stream of the first Olfr CDS in the Olfr genomic region to the upstream end of the non-Olfr CDS downstream of the last Olfr CDS in the Olfr genomic region divided by the number of Olfr CDSs in this Olfr genomic region.
Additionally, we included in the dataset genes that were either overlapping with Olfr genes (and accepted to be iso-forms of the corresponding Olfr in Ensembl) or defined as Odorant Receptor genes. The predicted gene Gm20715 (undergoing non-sense mediated mRNA decay) was re-moved and upstream inter-CDS distance for Olfr1344 was calculated using the Smim17 gene [70]. Moreover, given the proximity of Olfr94 with the Ubd gene, its 3’UTR