HAL Id: ird-01715147
https://hal.ird.fr/ird-01715147
Submitted on 22 Feb 2018
HAL is a multi-disciplinary open access archive for the deposit and dissemination of sci-entific research documents, whether they are pub-lished or not. The documents may come from teaching and research institutions in France or abroad, or from public or private research centers.
L’archive ouverte pluridisciplinaire HAL, est destinée au dépôt et à la diffusion de documents scientifiques de niveau recherche, publiés ou non, émanant des établissements d’enseignement et de recherche français ou étrangers, des laboratoires publics ou privés.
Estimating babassu palm density using automatic palm
tree detection with very high spatial resolution satellite
images
Alessio Moreira dos Santos, Danielle Mitja, Eric Delaître, Laurent Demagistri,
Izildinha de Souza Miranda, Thérèse Libourel Rouge, Michel Petit
To cite this version:
Alessio Moreira dos Santos, Danielle Mitja, Eric Delaître, Laurent Demagistri, Izildinha de Souza Miranda, et al.. Estimating babassu palm density using automatic palm tree detection with very high spatial resolution satellite images. Journal of Environmental Management, Elsevier, 2017, 193, pp.40 - 51. �10.1016/j.jenvman.2017.02.004�. �ird-01715147�
1
Estimating babassu palm density using automatic palm tree detection with very high
1
spatial resolution satellite images
2
Alessio Moreira dos Santos ab*, Danielle Mitjac, Eric Delaîtrec, Laurent Demagistric, Izildinha de 3
Souza Mirandaa, Thérèse Libourelc, Michel Petitd. 4
5
a. Universidade Federal Rural da Amazonia (UFRA), CP.917, Belém, Pará, 66077-530, Belém, 6
Brazil. [email protected], [email protected] 7
b. Universidade Federal do Sul e Sudeste do Pará (UNIFESSPA), Folha 31, Quadra 07, Lote
8
Especial, Nova Marabá, 68507-590, Marabá, Brazil. 9
c. Institut de Recherche pour le Développement (IRD), UMR 228 ESPACE DEV, 500, Rue Jean 10
François Breton 34093 Montpellier, France. [email protected], [email protected], 11
[email protected], [email protected] 12
d. Institut de Recherche pour le Développement (IRD), 911 avenue Agropolis BP64501, 34394 13
Montpellier Cedex 05, France. [email protected] 14
15
*Corresponding author :
16 17
Alessio Moreira dos Santos : [email protected]
18 19
2
Abstract
20
High spatial resolution images as well as image processing and object detection algorithms
21
are recent technologies that aid the study of biodiversity and commercial plantations of forest
22
species. This paper seeks to contribute knowledge regarding the use of these technologies by
23
studying randomly dispersed native palm tree. Here, we analyze the automatic detection of
24
large circular crown (LCC) palm tree using a high spatial resolution panchromatic GeoEye
25
image (0.50 m) taken on the area of a community of small agricultural farms in the Brazilian
26
Amazon. We also propose auxiliary methods to estimate the density of the LCC palm tree
27
Attalea speciosa (babassu) based on the detection results. We used the “Compt-palm”
28
algorithm based on the detection of palm tree shadows in open areas via mathematical
29
morphology techniques and the spatial information was validated using field methods (i.e.
30
structural census and georeferencing). The algorithm recognized individuals in life stages 5
31
and 6, and the extraction percentage, branching factor and quality percentage factors were
32
used to evaluate its performance. A principal components analysis showed that the structure
33
of the studied species differs from other species. Approximately 96% of the babassu
34
individuals in stage 6 were detected. These individuals had significantly smaller stipes than
35
the undetected ones. In turn, 60% of the stage 5 babassu individuals were detected, showing
36
significantly a different total height and a different number of leaves from the undetected
37
ones. Our calculations regarding resource availability indicate that 6,870 ha contained 25,015
38
adult babassu palm tree, with an annual potential productivity of 27.4 t of almond oil. The
39
detection of LCC palm tree and the implementation of auxiliary field methods to estimate
40
babassu density is an important first step to monitor this industry resource that is extremely
41
important to the Brazilian economy and thousands of families over a large scale.
3
Keywords: Shadow detection; Mathematical morphology; Density estimate; Remote sensing;
43 Brazilian Amazon 44 45 1. Introduction 46
The babassu (Attalea speciosa Mart. ex Spreng.) is a palm tree species native to dense
47
and humid forests that is distributed across approximately 200,000 km2 of forests and
48
savannas in Brazil, with optimal development in secondary environments (Anderson and
49
Anderson, 1985; May et al., 1985; Barot et al., 2005; Santos and Mitja, 2011; Coelho et al.,
50
2012). Recent research emphasized the importance of this palm tree to industry, given its
51
potential for biodiesel production (Da Rós et al., 2014) and bioenergy (Protásio et al., 2014);
52
to ethnobotany, given its use diversity (Araujo and Lopes, 2012; Martins et al., 2014); to
53
anthropology, given its economic and social importance for small farmers (Porro and Porro,
54
2014); and to medicine because babassu palm trees can become infested with triatomines,
55
which transmit Chagas disease (Dias et al., 2014). Recently, babassu oleaginous almonds
56
were considered as the third most important non-wood product of plant extractivism in Brazil
57
(89,739 t/$56.7 million in 2013; IBGE, 2013). Nevertheless, a gap exists between the
58
knowledge of this species and use of technologies that might aid in its management and
59
sustainable exploitation.
60
In forest plantations, information on tree or palm tree density is obtained using
remote-61
sensing techniques that aid in productivity monitoring, planning and management of African
62
oil palm tree (Shafri et al., 2011; Srestasathiern and Rakwatin, 2014) and eucalypt (Whiteside
63
et al., 2011; Zhou et al., 2013) plantations. The spatial information provided regarding the
64
number of trees or palm trees enables (among other things) the identification of excessive
65
mortality areas (Zhou et al., 2013) and the prediction of production dates (Malek et al., 2014),
66
which are essential for resource management and conservation (Engler et al., 2013).
4
As an alternative to time-demanding tasks of individually counting trees or palm trees
68
in the field, automatic-detection methods were developed using high spatial resolution
69
images. The primary objective of this detection is to determine the location of the tree or palm
70
tree crowns in an image (Srestasathiern and Rakwatin, 2014). Studies apply different
71
techniques to delimit tree and palm tree crowns based on the value of each pixel in the image
72
(Erikson and Olofsson, 2005). Some of the techniques used include the marked-point process
73
(MPP) via Worldview 1 and Worldview 2 multispectral images (Zhou et al., 2013), the
74
maximum local detection method using Kodak DCS 460 CIR and UltracamD digital camera
75
images (Pouliot et al., 2002; Hirschmugl et al., 2007), and a technique based on the structure
76
of the elements using an airborne AISA hyperspectral image (Shafri et al., 2011). These
77
techniques are generally used for homogeneous forest plantations disposed along a line; not
78
having other species within the plantation avoids confusion when analyzing the images.
79
The mapping of tree crowns in non-planted areas (i.e., those dispersed in cultivated
80
areas or in homogeneous or heterogeneous natural forests) can be based on the detection of
81
crowns via object-oriented classification using IKONOS and GeoEye images (Aouragh et al.,
82
2013), the wavelet-transform technique (Zhang et al., 2006; Ghiyamat and Shafri, 2010), or
83
via supervised classification techniques such as spectral angle mapper, a linear discriminant
84
analysis, and the maximum likelihood method (Clark et al., 2005), both techniques use an
85
airborne HYDICE hyperspectral image.
86
Few studies have used image-based palm tree detection directed toward regular
87
African oil palm tree plantations. Currently, babassu plantations are not found in Brazil,
88
which might explain why this species has not yet been evaluated using automatic detection
89
via images from recent satellites such as GeoEye, Ikonos, Worldview or Quickbird (which
90
offer a spatial resolution of less than 1 m). The development of images with a resolution of
91
less than 1 m enabled the more precise detection of small objects such as tree crowns in
5
agricultural areas and their different shapes (Aouragh et al., 2013) using canopy delineation
93
algorithms (Culvenor, 2002).
94
Although the classic algorithms developed for crown delineation fundamentally
95
assume that the center of a crown appears radiometrically brighter than its edge (Culvenor,
96
2002), the algorithm developed by Demagistri et al. (2014), adapted for open environments,
97
extracts the image pixels that correspond to shadows using the mathematical morphology
98
technique (Serra, 1982; Haralick et al., 1987). This algorithm permits the detection of palm
99
trees in pastures and agricultural plantations with low-to-average palm tree density. This
100
image analysis technique is important (Soille and Pesaresi, 2002; Giada et al., 2003) for the
101
detection of individual trees (Jiang and Lin, 2013) and other objectives. This technique is
102
known as “morphology” because it analyses the content and shape of the object and called
103
“mathematical” because it is based on set theory, integral geometry, and algebraic structure
104
(Giada et al., 2003). Therefore, this algorithm has been used to detect the babassu palm tree in
105
open agricultural environments.
106
Studies on tree and palm tree-crown detection do not usually employ field methods to
107
validate the spatial information (Clark et al., 2005; Zhang et al., 2006; Hirschmugl et al.,
108
2007; Ghiyamat and Shari, 2010; Shafri et al., 2011; Aouragh et al., 2013; Malek et al., 2014;
109
Srestasathiern and Rakwatin, 2014). When used, these methods are typically restricted to
110
measure crown diameter and individual density (Pouliot et al., 2002, Zhou et al., 2013),
111
although other structural characteristics of the individuals might affect their detection using
112
the algorithm. Therefore, understanding these characteristics is an important step to improve
113
the reliability of spatial information.
114
A large diversity of palm trees exists in the Amazon region, including 195 species and
115
35 genera. The most important genera include Attalea and Astrocaryum, each with 28 species
116
(Pintaud et al., 2008). In addition to Attalea speciosa (babassu), other large circular crown
6
(LCC) species such as Attalea maripa (inajá), Astrocaryum aculeatum (tucumã), Oenocarpus
118
bacaba (bacaba) and Mauricia flexuosa (buriti) are distributed in an isolated and random
119
manner (D. Mitja, Personal communication). Because no methods are described in the
120
literature that enable differentiation among LCC palm tree types using a high-resolution
121
image, estimating the density of a species of interest (e.g., the babassu) using automatic
122
detection is a real challenge.
123
In the present study, we analyzed the automatic detection of LCC palm trees using a
124
high spatial resolution panchromatic image (GeoEye1 sensor, 0.50-m resolution, July/2013)
125
taken on a community of small farms in the Brazilian Amazon after validating the
remote-126
sensing data using photo-interpretation and field methods. Based on the automatic detection
127
results, we implemented auxiliary field methods to estimate babassu density.
128 129
2. Material and Methods
130
2.1. Characterization of the study area
131
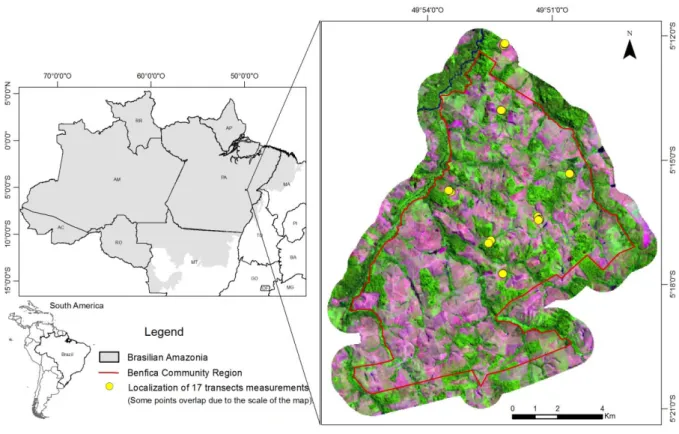
This study was conducted in small farmlands in Benfica (S 05°16’20”, W 49°50’25”),
132
(Itupiranga State of Pará (PA), southeast of the Brazilian Amazon) (Fig. 1). This site has
133
9,501 ha, and its occupation started in 1986 successively by farmers and settlers. Its land
134
regularization was consolidated by the National Institute of Colonization and Agrarian
135
Reform (Instituto Nacional de Colonização e Reforma Agrária; INCRA) in 1996 (Arnauld de
136
Sartre, 2004). The latest estimate indicated 183 agricultural establishments and approximately
137
1,000 people in the community (Ritter et al., 2009).
7 139
Fig. 1. The study area (Benfica, PA), located southeast of the Brazilian Amazon, shown by a
140
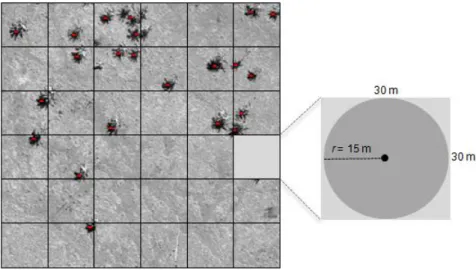
Landsat 8-OLI 2013 image (RGB: B6, B5, B4).
141
*Two transects were near but outside the limit of Benfica community.
142 143
The vegetation in this area is upland tropical forest, characterized by the presence of
144
lianas and palm trees (Mitja and Miranda, 2010). The dense forest has a canopy between 25
145
and 30 m in height, although some trees (e.g., Bertholletia excelsa H.B.K) reach a height of
146
over 50 m (Bertrand, 2009). Landsat 8-OLI images taken in 2013 (Fig. 1) showed that
147
primary and old secondary forests (in dark green colors) covered 34% of the area in Benfica,
148
whereas degraded pastures or pastures with little cover (in purple and pink colors) represented
149
31%; pastures in good states and young secondary forests (in light green colors) accounted for
150
31% of the area (Eric Delaître, Personal communication).
151
When forests are converted into pastures, some palm trees and timber species are
152
maintained (Mitja et al., 2008; Santos and Mitja, 2011), thereby contributing to the
8
composition of the local landscape that includes pastures containing woody species (15%) and
154
pastures with babassu (12%; Sampaio, 2008). The high reproductive plasticity of babassu
155
favors its development in agricultural areas (Barot et al., 2005) because the use of fire for
156
agricultural management contributes to the germination and regeneration of babassu
157
individuals (Mitja and Ferraz, 2001). Thus, the different densities of the babassu in the study
158
area are partially a result of its resilience to natural and anthropogenic disturbances, insofar as
159
(similar to some other species) it has particular morphological characteristics and reproductive
160
strategies that influence its phenology and gene flow (Montúfar et al., 2011).
161
The climate is tropical humid with average temperature of 26°C. The average annual
162
rainfall is 1,700 mm, distributed irregularly throughout the year. The region’s two seasons are
163
defined by the movements of the intertropical convergence zone: the rainy season, which
164
typically lasts approximately 8 months (October to May); and the dry season, which typically
165
lasts 4 months (June to September; Bertrand, 2009).
166
A variety of soils exists along the toposequences: (i) oxisol, with a thick B horizon
167
rich in ferruginous nodules; (ii) cambisol, with an incipient B horizon and a C horizon located
168
close to the surface; and (iii) gleysol, with an A horizon rich in organic matter, A and B
169
horizons with little clay, and hydromorphy along the entire profile (Ritter et al., 2009). As is
170
the norm for most arable lands in the Amazon, the soil fertility of the study area is low (Ritter
171 et al., 2009). 172 173 2.2. Field data 174
The information obtained in the field enabled the definition of the proportion of
175
babassu in the set of LCC palm trees. There are five LCC palm tree species in Benfica, three
176
are more frequent, babassu, inajá and tucumã, and two rare species, bacaba and buriti (Santos
9
and Mitja, 2011; Danielle Mitja, Personal communication). In a 487 ha pasture area of the
178
study site (=62-plots), we observed that 93.6% of the LCC palm trees found were babassu.
179
This result was used to estimate the babassu density based on the automatic LCC palm tree
180
detection results.
181
A total of 17 transects were sampled in pastures of different ages (1, 3, 5, 7 and 9
182
years), with a total sampling area of 1.3 ha (Fig. 1). In these transects, we noted that 46.51%
183
of the detected palm trees belonged to stage 5, whereas 53.49% belonged to stage 6.
184
A total of 150 babassu across three development stages were inventoried in the pasture
185
areas. Out of these babassu, 105 were in stage 6 (adults with an aerial stipe and signs of male
186
and/or female reproductive organs), 30 were in stage 5 (juvenile with an aerial stipe,
187
regardless of sheath coverage, and without the signs of male or female reproductive organs),
188
and 15 were in stage 4 (juvenile with a terminal bud at the soil surface level, with well-visible
189
leaf sheaths).
190
The structural information obtained in the field included circumference at breast
191
height, circumference at the base of the stipe, number of leaves, total height, stipe height, and
192
crown circumference (Fig. 2). This structural information was also obtained for two other
193
LCC palm trees species, inajá (31 individuals) and tucumã (30 individuals).
194
All these palm trees were georeferenced using the global positioning system (GPS;
195
model: GARMIN 62stc) to be located in the GeoEye 2013 image and identify the individuals
196
that had been detected using the detection algorithm.
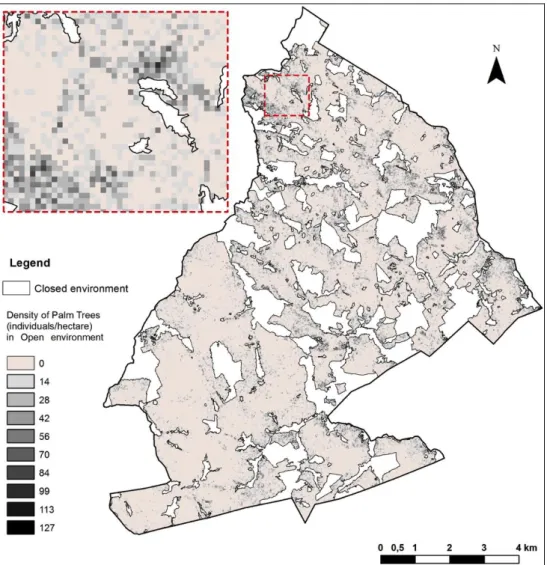
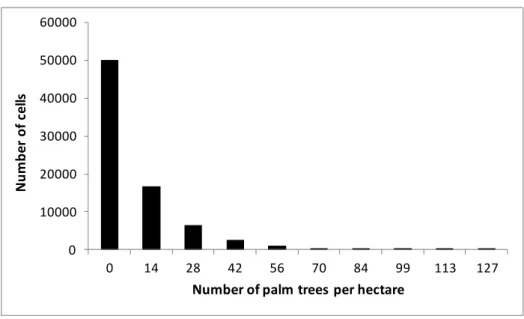
197 198
10 Crown Circumference (m) Stipe Height (m) Total Height (m) Number of Leaves Circumference at Breast Height at 1.30m (m)
Circumference at the Base of the Stipe at 0.30m (m)
Stage 4 Stage 5 Stage 6
199
Fig. 2. Life-cycle stages of the babassu palm trees studied in Benfica and the
200
structural information obtained
201
202
2.3. Remote sensing image
203
The present study used a GeoEye-1 satellite image in panchromatic mode (intrinsic
204
spatial resolution of 0.41 m resampled to 0.50 m, acquired on July 12, 2013 and
205
orthorectified. The image has 15 x 15 km of dimension, and the following angles: 56.09o of
206
sensor azimuth, 79.03o of sensor elevation, 42.575o of sun azimuth, and 56.09o of sun
207
elevation. The image encompasses the entire surface of Benfica (9,501 ha). To comply with
208
the requirements of the LCC palm tree detection algorithm, a radiometric correction was
209
applied to the 2013 image so as to get the same dynamic range as the 2009 one (spatial
210
resolution of 0.50 m), which was used to obtain the palm tree detection algorithm.
211 212
2.4. LCC palm tree detection algorithm development and evaluation
11
An “Compt-palm” algorithm adapted to open environments was developed to detect
214
the following LCC palm trees: babassu, inajá, tucumã, bacaba and buriti (Demagistri et al.,
215
2014). A panchromatic GeoEye 2009 image of Benfica was used in the
algorithm-216
development process. At first, shadows palm trees are extracted using mathematical
217
morphology techniques; then each shadow object (which corresponds to a potential palm tree)
218
undergoes a supervised classification by calculating a decision coefficient used to assign that
219
object a particular class label between “palm tree shadow” and “other shadow”.
220
The shadow extraction protocol proceeds as follows:
221
i) Smoothing of the panchromatic image: this first filter removes the noise from the
222
image;
223
ii) Local adaptive filtering based on the mean and standard deviation of a moving
224
window: zones with a strong local contrast (i.e. the shadows) are extracted;
225
iii) Morphological closing: the first step in cleaning the shadow extraction results;
226
iv) Connected components extraction: labeling of independent shadow objects;
227
v) Object size thresholding: the second step in cleaning the shadow extraction results.
228
Afterwards, shadow objects are classified using a supervised classification based on a
229
distance criterion and a decision rule process. These steps are detailed below:
230
i) Classifier training with two sets of shadow images: 75 cropped images of “palm
231
tree shadows” and 75 cropped images of “other shadows”; 25 normalized shape
232
characteristics and invariants are computed on the whole set of the cropped images
233
(see below for some details).
234
ii) Calculation of classifier entry parameters for each potential palm tree shadow and
235
selection of the 5 closest shadow objects (Euclidian distance computation) within
236
the training set.
12
iii) Score calculation, according to the class of the closest shadow objects, enabling
238
appropriate classification of each shadow.
239
To characterize the palm tree shadows, we worked with the shape characteristics and
240
invariant described in Torres-Méndez et al. (2000). For each shadow image, we first compute
241
its moment of inertia (1 parameter). Then, using 12 concentric circles centered on the shadow
242
centroid we count for each circle the number of intensity changes that occur
(shadow/no-243
shadow) and the normalized difference of the two largest arcs that are not part of the shadows
244
(12x2 parameters).
245
The result is a list of points in image or cartographic coordinates that can be compared
246
with data obtained using image photo-interpretation. The steps by which the LCC palm tree
247
detection algorithm proceeds are shown in Fig. 3.
248 249
1.
2.
3. 1. Panchromatic Image GeoEye 2009 (0.50 m)
2. Shadows extraction Smoothing Local adaptative binarization Morphological closing Connected component labeling Component size filtering
3. Palm tree shadows template matching Decision rules based on training sets Object recognition using 25 invariant features 4. Validation: photo-interpretation
5. Automatic LCC-Palm trees detection 250
13
Fig. 3. Representation of the steps of the LCC palm trees automatic detection
251
algorithm (adapted from Demagistri et al., 2014)
252 253
The algorithm was validated using image photo interpretation via a sample of 334
254
points observed over 16 cells of 1-ha, distributed in pastures of low and average babassu
255
density in the study area.
256
To evaluate the precision and quality of the algorithm used, were considered the
257
factors adopted by Shufelt (1999) and Luo et al. (2014); these factors can be based on image
258
pixel classifications or on object shape and consider the numbers of true positives (TP), false
259
positives (FP), and false negatives (FN). The first factor is the extraction percentage, given by
260
the expression 100*TP/(TP+FN), which can be understood as a measure of shadow extraction
261
performance. The second factor is the branching factor, given by FP/TP, which measures
262
delineation performance. The third factor is the quality percentage, given by
263
100*TP/(TP+FP+FN), a general measure of method performance. According to Shufelt
264
(1999), the use of these three measures completely evaluates model performance.
265 266
2.5. Density map and calculation of the babassu resource estimate
267
The palm tree location map produced by applying the algorithm to open environments
268
on the GeoEye-1 2013 image was processed using ArcGis 10.2.2 with the Point Density tool
269
to obtain the palm tree density map. The parameters used were the size of the raster cells
(30-270
m) and the size and shape of the point search neighborhood (a 15 m radius circle, Fig. 4). The
271
number of individuals per ha was used to calculate palm density.
14 273
Fig. 4. Representation of the parameters used to elaborate the density map
274 275
The number of LCC palms actually present (B) was defined as:
276
B=A–(A×FP)/100+(A×FN)/100; where: A = number of points indicated by the
277
algorithm as corresponding to LCC palm trees; FP = False Positive; FN = False Negative.
278
Then, based on information from Santos and Mitja (2011) was calculated the number of
279
babassu as 93.6% of the total number of palm trees.
280
Therefore, we can calculate the number of babassu palm trees (C) from the total LCC
281
palm trees (B).
282
C=(B×93.6)/100
283
To obtain the proportion of stage 5 and 6 individuals in the pastures we use a total
284
density of palm trees in of 17 transects, with 46.51% of stage 5 and 53.49% of stage 6.
285
Therefore, we calculated the total numbers of babassu palm trees (detected and undetected) in
286
stage 5 (V) and stage 6 (W) present in open areas in Benfica.
287
Adult palm trees (stage 6):
288 C=V+W 289 With V=(46.51% of C), and 290 W=(53.49% of C) 291
15
Finally, despite the high variation in the amount of oil extracted according to the used
292
method, we estimated the annual potential productivity of almond oil of Benfica, using (i) the
293
estimated density of adults at Benfica and (ii) literature data on fruit production (24 kg of
294
fruits / palm / year on average - Anderson, 1983), seed production (1 kg of seeds from 13 kg
295
of fruits – Gonsalves, 1955), and oil production (1 kg of crude oil from 1.68 kg of almonds -
296 Frazão, 2001). 297 298 2.6. Statistical analyses 299
A principal components analysis (PCA) was used to verify differences in the structural
300
characteristics of LCC palm trees species. The significance of the PCA was determined using
301
the Monte Carlo permutation test at p < 0.05.
302
The structural characteristics of babassu palm trees at stages 5 and 6 were compared
303
using the non-parametric Wilcoxon test, as were the structural characteristics of the
304
individuals at each stage based on whether they were detected or not, using the algorithm. All
305
statistical analyses were performed using the software R 3.1.2 (R Core Team, 2014) with the
306
packages ADE-4 (Dray and Dufour, 2007; Dray et al., 2007).
307 308
3. Results
309
3.1. Structural characteristics of the LCC palm trees
310
The use of the shadow-detection algorithm detected the babassu palm trees and also
311
other palm tree, especially those dominant in Benfica, such as inajá and tucumã.
312
In contrast, the PCA of the structures of the babassu, inajá and tucumã palm trees (all
313
belonging to stage 6, i.e., adults) showed that the LCC palm trees differed structurally. The
314
first two PCA axes explained 75.77% of the variance in the scatterplot. Axis 1 explained
16
39.71% of the variance, and the structural variables that contributed the most to this axis were
316
circumference at breast height, circumference at the base of the stipe, number of leaves. The
317
second axis explained 36.06% of the variance, and its most important variables were total
318
height, stipe height (Fig. 5).
319 Axis 1 (39.71%) Axis 2 (36.06%) H SH NL CBH CC 0.0 0.5 1.0 1.5 2.0 Eigenvalues CBS 320
Fig. 5. The PCA using the structural variables of three palm tree species in Benfica.
321
Circumference at breast height (CBH), circumference at the base of the stipe (CBS),
322
number of leaves (NL), total height (H), stipe height (SH), and crown circumference (CC).
323 324
In the PCA formed by the first and second axes, the structural variables were grouped
325
according to palm tree type: babassu, inajá, and tucumã. According to a Monte Carlo test with
326
999 permutations, 44% of the data variance was explained by palm tree species, and this value
327
was significant (p=0.001; Fig. 6).
328 329
17 d = 2 Babassu Inajá Tucumã Observation 44% p-value = 0.001 Monte-Carlo test Axis 1 (39.71%) Axis 2 (36.06%) 330
Fig. 6. The first and second axes of the PCA regarding the structural variables of the species
331
Attalea speciosa (Babassu), Attalea maripa (Inajá) and Astrocaryum aculeatum (Tucumã) in
332
Benfica.
333 334
3.2. The structural characteristics of the individuals detected/undetected by the algorithm
335
The algorithm did not detect any of the stage 4 babassu palm trees identified in the
336
field.
337
When comparing the morphological characteristics of the stage 5 and 6 palm trees
338
using a boxplot (Fig. 7), we observed that the stage 6 palm trees had higher values and
339
significantly differed from those in stage 5 (Wilcoxon test, p<0.0001) for all the structural
340
characteristics analyzed.
341 342
18 343
Fig. 7. A comparison of the morphological characteristics of stage 5 (n=30) and stage 6
344
(n=105) Attalea speciosa palm trees. Each box of the plot extends from the data of quartiles 1
345
and 3; the horizontal lines within each box represent the median; and the circles at the
346
extremities represent the values close to the box. The different letters indicate that the means
347
are significantly different (Wilcoxon test, p<0.0001). CBH, circumference at breast height;
348
CBS, circumference at the base of the Stipe.
349 350
Approximately 96% of the stage 6 palm trees identified in the field were detected
351
using the algorithm based on their shadows; only 4% remained undetected. The comparison
352
between the mean structural characteristics of the detected and undetected individuals
353
revealed a significant difference (Wilcoxon test, p<0.05) only for the mean stipe height,
354
which was greater for detected palm trees than undetected palm trees (Table 1).
355
Approximately 60% of the stage 5 babassu palm trees identified in the field were
356
detected using the algorithm, and 40% were not detected (Table 1). The total height and the
357
number of leaves values of the detected and undetected individuals significantly differed
19
(Wilcoxon test, p<0.05), with detected individuals having larger morphological characteristic
359
values than their undetected counterparts.
360 361
Table 1. The morphological characteristics of stage 5 and 6 babassu palm trees, regardless of
362
detection using the algorithm in open areas. The means were compared using the
non-363
parametric Wilcoxon test. Ns: not significant; *: p<0.05
364 Stage 5 (n=30) % Individuals Total Height (m) Stipe Height (m) Number of Leaves Circumference at the Base of the Stipe (m) Circumference at Breast Height (m) Crown Circumference (m) Undetected 40 7.33 0.00 9.33 0.00 0.00 20.37 Detected 60 8.25 0.38 14.61 1.66 1.21 21.32 * Ns * Ns Ns Ns Stage 6 (n=105) % Individuals Total Height (m) Stipe Height (m) Number of Leaves Circumference at the Base of the Stipe (m) Circumference at Breast Height (m) Crown Circumference (m) Undetected 4 11.25 0.50 15.75 1.68 1.54 28.63 Detected 96 12.38 3.94 19.76 1.60 1.26 31.87 Ns * Ns Ns Ns Ns 365 366
3.2. Algorithm quality and LCC palm tree density
367
When evaluating the performance of the algorithm used to automatically detect the
368
LCC palm trees, we considered 334 points, in which 252 (75.45%) had been correctly
369
identified by the algorithm (true positives), 55 (16.47%) points indicated by the algorithm that
370
did not correspond to palm trees (false positives), and 27 (8.08%) points corresponding to
371
palm trees that were not identified by the algorithm (false negatives). This analysis resulted in
372
90.32% of Extraction, 0.218 of Branching factor, and 75.45% of Quality.
20
A palm tree density map (Fig. 8) was created after applying the open area algorithm to
374
the GeoEye1 2013 image. A total of 54,540 palm trees were detected in open vegetation in
375
Benfica communities (6,870 ha). In the study area, 65% of the cells had a null density, less
376
than 35% of the cells had a low LCC palm tree density (1 to 3 palm trees in a circle with a15
377
m-radius, corresponding to 14 to 42 palm trees per ha), and less than 2% of the cells had an
378
average LCC palm tree density (4 to 9 palm trees in a circle with a 15 m-radius,
379
corresponding to 56 to 127 palm trees per ha) (Fig. 9). The average-density areas were
380
localized and dispersed, whereas the low-density and null-density areas occupied a large
381
surface characterized by continuous areas.
382
383
Fig. 8. The LCC palm tree density map in Benfica based on the application of automatic
384
detection using the open areas algorithm with regard to the GeoEye1 2013 image
21 0 10000 20000 30000 40000 50000 60000 0 14 28 42 56 70 84 99 113 127 N u m b er o f ce lls
Number of palm trees per hectare
386
Fig. 9. A histogram of the number of cells as a function of palm tree density per ha in the
387
density map obtained from the GeoEye1 2013 image
388 389
3.3. Babassu resource density productivity estimate
390
The 54,540 LCC palm tree points detected using the GeoEye1 2013 image of Benfica
391
were corrected with regard to the algorithm’s errors, resulting in 49,964 LCC palm trees
392
actually present. By applying the 93.6% rate, we obtained 46,766 babassu palm tree based on
393
the total number of LCC palm trees. Based on the field data of the proportion of stage 5
394
(46.51%) and 6 (53.49%) palm trees in the study areas, we calculated 25,015 of babassu
395
individuals in stage 6 (adults). Finally, we estimated that the adults in the open areas of
396
Benfica have an annual potential productivity of 27.4 t of almond oil.
397 398
Discussion
399 400
4.1. The contribution of the field methods to validate the remote-sensing data
401
The local densities obtained via automatic detection are accurate; however, this
402
information becomes much more efficient when combined with the data obtained via field
22
measurements (Zhou et al., 2013). In the present study, the measurements of the
404
morphological characteristics of palm trees and their cartographic coordinates were essential
405
to validate the remote-sensing data obtained using automatic detection.
406
As expected, it was not possible to differentiate between the LCC palm tree species in
407
images with a resolution of 0.50 m. However, these species have different structures. As Kahn
408
(1986) reported, the genera Astrocaryum and Attalea have a variety of forms: the species
409
Astrocaryum aculeatum has well-developed stipes (15 to 20 cm in diameter and 15 to 25 m in
410
height), and its leaflets are always placed on different planes (Kahn, 1986). Conversely,
411
Attalea speciosa has leaflets along the same plane (Kahn, 1986). Attalea speciosa can reach a
412
height of 10 to 30 m and have a stipe diameter of 30 to 60 cm (May et al., 1985; Lorenzi et
413
al., 2010), whereas Attalea maripa can reach a height of 7 to 24 m, have a stipe diameter of 20
414
to 40 cm, and leaves that are disposed in five directions (Lorenzi et al., 2010).
415
All of these forest palm trees grow in pastures and secondary vegetation (May et al.,
416
1985; Anderson and Anderson, 1985; Kahn, 1986) where they usually reach sexual maturity
417
earlier and grow to a smaller height than their counterparts in forests (Kahn, 1986). As palm
418
trees increase in height, their crowns become relatively narrower (Rich et al., 1986).
419
The PCA of the structure of the LCC palm trees (Attalea speciosa, Attalea maripa and
420
Astrocaryum aculeatum) present in the study area reinforces the differences in the architecture
421
among the species and suggests that stipe circumference (axis 1) and height (axis 2) are the
422
most important variables. Wang and Augspurger (2006) investigated the influence of palm
423
tree crown architecture on seedling recruitment on Barro Colorado Island in Panama and La
424
Selva forest in Costa Rica; based on a PCA, they concluded that the four palm tree species
425
studied at each site had different growth forms and crown architectures, with the number of
426
leaves and leaf area having the greatest influence on one axis and crown area influencing the
427
other two axes.
23
All of the structural variables analyzed in the present study influenced the shape of the
429
shadow of each species because different architectures can have more or less impact on the
430
way light propagates through vegetation (Wang and Augspurger, 2006). Because we used a
431
shadow-detection algorithm that also considers the shape of the shadow, differentiating
432
among LCC palm tree species might be possible if an image with a better spatial resolution
433
(i.e., less than 0.50 m) is used, given that these species have different structures. Moreover, it
434
might be possible to create a density map specific for the babassu palm tree (Attalea speciosa)
435
by extracting only the shadows that correspond to this species.
436
The validation of the information concerning stage 4, 5, and 6 of babassu palm tree,
437
with the aid of field methods (i.e., structural census and georeferencing) regardless of the
438
detection algorithm, enabled us to report which structural characteristics have a stronger
439
influence on their detection using a high spatial resolution image.
440
Almost all (96%) of the stage 6 babassu palm tree were detected using the high spatial
441
resolution satellite images, and only 4% did not have visible shadows and were not
442
automatically detected. The numbers of leaves and the crown widths of these individuals did
443
not significantly differ from those detected; however, their stipes were significantly smaller.
444
In turn, the stage 5 babassu palm tree were partially detected (60%). The 40% that
445
were not detected were shorter and had fewer leaves than those detected. However, it is
446
difficult to individually characterize the undetectable palm trees that belong to this stage
447
based on their morphological characteristics, as was done for stage 6. Some individuals with
448
similar morphological characteristics might not be detected because unmeasured factors might
449
also influence shadow formation. These factors might include i) the orientation of the palm
450
trees in relation to the sun when the image was captured by the sensor, ii) the leaf area (i.e.,
451
leaf width by blade length) of each individual (Wang and Augspurger, 2006), and iii) the
452
average distance between leaflets (Wang and Augspurger, 2006).
24
The algorithm most likely failed to detect stage 4 babassu palm trees because of the
454
spatial resolution of the image used (0.50 m), given that the shadow of these individuals is
455
nearly imperceptible or nonexistent under this resolution.
456
The babassu palm trees were divided into developmental stages to monitor the plant
457
growth over time across different environments (i.e., forests, pastures, and secondary forests).
458
Although this organization is biologically artificial, a continuum in babassu growth exists
459
from the seedling to adult stages. The significant difference in the structure of individuals
460
between stages 5 and 6 indicates that the separation of individuals into these life stages was
461
well established. Although certain stage 5 individuals were similar to those in stage 6, stage 6
462
palm tree usually have higher morphological characteristic values that explain their
463
predominance among the detected plants. Because this species is native, non-cultivated, and
464
non-domesticated where no selection is yet practiced, significant between-plant variability
465
exists in the babassu population (Danielle Mitja, Personal communication).
466 467
4.2. Algorithm performance for the automatic detection of LCC palm trees
468
The result of the detection via the algorithm (75.45% quality) was promising given
469
that it was applied to natural, non-planted areas. In commercial plantations of the African oil
470
palm tree, organized along lines and without other species besides the cultivated one, the
471
detection precision reaches 90% (Srestasathiern and Rakwatin, 2014); when high spatial
472
resolution satellite images are used, this rate is approximately 95% (Shafri et al., 2011). Even
473
in homogeneous commercial plantations, however, issues might exist with the methods used
474
because of the presence of objects other than the cultivated species, which are often detected
475
as false positives (Srestasathiern and Rakwatin, 2014). Future studies should use texture
476
information to suppress the presence of objects other than the species of interest
477
(Srestasathiern and Rakwatin, 2014).
25
In the present study, 75.45% of the LCC palm trees were successfully detected.
479
However, this rate might be improved by decreasing the number of false positives (as reported
480
above) and that of false negatives (for groups composed of 2 or 3 palm trees, only 1 palm tree
481
is detected). In the case of a false negatives, the palm tree crowns might overlap, resulting in a
482
single shape that differs from that of an isolated palm tree. Zhou et al. (2013) also faced the
483
challenge of crown overlap; these authors were unable to detect the canopies of closely
484
spaced trees on a Eucalyptus plantation. Moreover, Shari et al. (2011) noted that the
crown-485
detection method applied worked well only for isolated African oil palm trees. All these
486
studies used a spatial resolution of 0.50 m or greater. Better resolutions (0.10 – 0.30 m) for
487
example using drones, and the improvement of the algorithm should decrease this error.
488
Using the LCC palm tree density map, we observed that this algorithm might be used
489
to estimate the occurrence of palm trees present in the open area of interest using a high
490
spatial resolution image (0.50 m). One of the major advantages of mapping species of interest
491
via high-resolution images compared with forest censuses is that this information can be
492
obtained for large areas (Zhou et al., 2013), as it is the case in the present study, especially
493
because multispectral and hyperspectral images are becoming more accessible.
494 495
4.3. The potential use of this technique for babassu productivity monitoring, planning, and
496
management
497
Automatic mapping in commercial plantations seeks to identify high-mortality points
498
(Zhou et al., 2013) and the plants affected by disease (Shari et al., 2011; Johansen et al., 2014)
499
to define management practices. In turn, the density map of the LCC palm trees over large
500
areas proposed here, provides a wide view of resource distribution along the entire basin and
501
enables the identification of areas with greater densities, access and productive potential,
502
favoring the planning of resource exploitation and management based on the interests of land
26
owners or producer associations. In addition, given the risk of overexploitation and species
504
extinction, environmental agencies might use this tool to aid in the inspection of areas where
505
babassu felling is prohibited by law (Porro et al., 2011) or to monitor the variation in resource
506
density over time, as suggested by Aouragh et al. (2013) and Zhou et al. (2013) with regard to
507
tree species.
508
Remote sensing, very high spatial resolution images, image processing, and object
509
detection algorithms have become some of the major technologies in geospatial research,
510
exploitation and monitoring of biodiversity (Bai et al., 2005; Clark et al., 2005; Schmidtlein et
511
al., 2012; Engler et al., 2013; Garrity et al., 2013; Lin, 2013; Laurin et al., 2014), and
512
commercial plantations of forest species of interest (Zhou et al., 2013; Srestasathiern and
513
Rakwatin, 2014). The present paper seeks to contribute to the use of this technology by
514
studying the native palm trees naturally and randomly dispersed and mixed with numerous
515
other species.
516
Because babassu is a native species that is adapted to secondary environments (May et
517
al., 1985; Anderson and Anderson, 1985), the expansion of the areas occupied by this species
518
is directly related to the advancement of the agricultural frontier in the Amazon through
519
deforestation (Teixeira, 2003). For many decades, this species has been the primary source of
520
income for farmers in North and Northeast Brazil (Teixeira, 2003; Porro et al., 2011; Porro
521
and Porro, 2014). However, the major hindrances within the production chain of babassu oil
522
in Brazil are the lack of a regular supply system for quality raw materials and the scarcity of
523
strategic partnerships with small farmers (Teixeira, 2003). The methods proposed in this study
524
regarding the density and production capacity estimates based on the results of automatic
525
detection will provide more precise results that might be used to simulate numerous
526
exploitation scenarios based on different systems of fruit harvest, adult density management
27
and species regeneration time. These systems might provide farmers with better plans of
528
action for the constant and sustainable use of the production potential of this palm tree.
529 530
5. Conclusions
531
The result of the automatic detection using the algorithm on a very high spatial
532
resolution image (75.45% quality) was promising, given that it was applied to natural,
non-533
planted areas.
534
The validation of the information concerning stage 4, 5, and 6 Attalea speciosa
535
(babassu) palm trees using field methods (i.e., structural census and georeferencing),
536
regardless of algorithm detection, provided information regarding which structural
537
characteristics have a greater influence on their detection in a very high spatial resolution
538
image. This step is important in the study of automatic detection using remote sensing images
539
of palm trees.
540
By itself, the use of the algorithm on very high spatial resolution images does not yet
541
deliver researchers a density map exclusively for babassu for farmers, associations or public
542
policies. However, the detection of LCC palm trees and the implementation of auxiliary field
543
methods to estimate the density of the species of interest is an important first step toward the
544
large-scale monitoring of this important resource, not only by the Brazilian industry and
545
economy but also by the thousands of families who depend on babassu extraction for
546 subsistence. 547 548 Acknowledgments 549
The authors thank the Institut de Recherche pour le Développement, whose support enabled
550
the development of this study. This project was also funded within the RELAIS
551
(CNPq/IRD/UFRJ) and CNES TOSCA/Babaçu projects. Thanks go to the farmers for their
28
receptivity and to Mr. Deurival da Costa Carvalho for his dedication to the fieldwork. This
553
study was performed with support from the Brazilian National Council for Scientific and
554
Technological Development (with a PhD scholarship sandwich in French) and the Brazilian
555
Federal Agency for the Support and Evaluation of Graduate Education (with a PhD
556 scholarship in Brazil). 557 558 References 559
Anderson, A.B., 1983. The biology of Orbignya martiana (Palmae), a tropical dry forest
560
dominant in Brazil. Thesis (PhD), University of Florida. 196 p.
561
Anderson, A.B., Anderson, S., 1985. A ‘tree of life’ grows in Brazil. Nat. Hist. 94 (12), 40-47.
562
Aouragh, M., Lacaze, B., Hotyat, M., Ragala, R., Aboudi, A.E., 2013. Cartographie et suivi
563
de la densité des arbres de l’Arganeraie (Sud-ouest du Maroc) à partir d’images de
564
télédétection a haute resolution spaciale. Revue Française de Photogrammétrie et de
565
Télédétection 203, 3-9.
566
Araujo, F.R., Lopes, M.A., 2012. Diversity of use and local knowledge of palm trees
567
(Arecaceae) in eastern Amazonia. Biodivers Conserv 21, 487–501. DOI:
568
10.1007/s10531-011-0195-9
569
Arnauld de Sartre, X., 2004. A Ruralisation of an Amazonian Frontier? In: SLAS Annual
570
conference. Society for Latin American Studies, 19 p.
571
Bai, Y., Walsworth, N., Roddan, B., Hill, D.A., Broersma, K., Thompson, D., 2005.
572
Quantifying tree cover in the forest–grassland ecotone of British Columbia using crown
573
delineation and pattern detection. Forest Ecol Manag 212, 92-100.
574
http://dx.doi.org/10.1016/j.foreco.2005.03.005
575
Barot, S., Mitja, D., Miranda, I., Meija, G.D., Grimaldi, M., 2005. Reproductive plasticity in
576
an Amazonian palm. Evol Ecol Res 7, 1051–1065.
29
Bertrand, G., 2009. Characterization of adaptive responses to water stress in the Southeast
578
Amazon in three forage species grown in monoculture and in association: Brachiaria
579
brizantha, Leucaena leucocephala et Arachis pintoi. Thesis (PhD), University of
Paris-580
Est. 181 p.
581
Clark, M.L., Roberts, D.A., Clark, D.B., 2005. Hyperspectral discrimination of tropical rain
582
forest tree species at leaf to crown scales. Remote Sens Environ 96, 375-398.
583
Coelho, R.F.R., Miranda, I.S., Mitja, D., 2012. Description of sucessional process at Benfica
584
Settlement Project, Southeastern of State of Pará, Eastern Amazon. Bol Mus Para Emílio
585
Goeldi, Cienc Nat 7(3), 251-282.
586
Culvenor, D.S., 2002. TIDA: An Algorithm for the Delineation of Tree Crowns in High
587
Spatial Resolution Remotely Sensed Imagery. Computer & Geosciences 28, 33-44.
588
http://dx.doi.org/10.1016/S0098-3004(00)00110-2
589
Da Rós, P.C.M., Silva, W.C., Grabauskas, D., Perez, V.H., Castro, H.F., 2014. Biodiesel from
590
babassu oil: Characterization of the product obtained by enzymatic route accelerated by
591
microwave irradiation. Ind Crop Prod 52, 313-320.
592
http://dx.doi.org/10.1016/j.indcrop.2013.11.013
593
Demagistri, L., Mitja, D., Delaitre, E., Shahbazkia, H., Petit, M., 2014. Palm trees detection
594
with very high resolution images, comparison between Geoeye and Pléiades sensors.
595
http://www.pleiades2014.com/presentations-2014 (accessed 14.01.17).
596
Dias, F. B., Quartier, M., Diotaiuti, L., Mejía, G., Harry, M., Lima, A. C., Davidson, R.,
597
Mertens, F., Lucotte, M., Romaña, C.A., 2014. Ecology of Rhodnius robustus Larrousse,
598
1927 (Hemiptera, Reduviidae, Triatominae) in Attalea palm trees of the Tapajós River
599
Region (Pará State, Brazilian Amazon). Parasit Vectors. 7, 154.
600
Dray, S., Dufour, A.B., 2007. The ade4 package: implementing the duality diagram for
601
ecologists. Journal of Statistical Software 22(4), 1-20.
30
Dray, S., Dufour, A.B., Chessel, D., 2007. The ade4 package-II: Two-table and K-table
603
methods. R News 7(2), 47-52.
604
Engler, R., Waser, L.T., Zimmermann, E., Schaub, M., Berdos, S., Ginzler, C., Psomas, A.,
605
2013. Combining ensemble modeling and remote sensing for mapping individual tree
606
species at high spatial resolution. Forest Ecol Manag 310, 64-73.
607
Erikson, M., Olofsson, K., 2005. Comparison of three individual tree crown detection
608
methods. Mach Vision Appl 16(4), 258-265.
609
Frazão, J.M.F., 2001. Alternativas econômicas para agricultura familiar assentadas em áreas
610
de ecossistemas de babaçuais. Relatório Técnico, Governo do Estado do Maranhão, São
611
Luis. 120pp.
612
Garrity, S.R., Allen, C.D., Brumby, S.P., Gangodagamage, C., McDowell, N.G., Cai, D.M.,
613
2013. Quantifying tree mortality in a mixed species woodland using multitemporal high
614
spatial resolution satellite imagery. Remote Sens Environ 129, 54-65.
615
http://dx.doi.org/10.1016/j.rse.2012.10.029
616
Ghiyamat, A., Shafri, H.Z.M., 2010. A review on hyperspectral remote sensing for
617
homogeneous and heterogeneous forest biodiversity assessment. Int J Remote Sens 31(7),
618
1837-1856.
619
Giada, S., Groeve, T.D., Ehrlich, D., Soille, P., 2003. Information extraction from very high
620
resolution satellite imagery over Lukole refugee camp, Tanzania. Int. J. Remote Sens 24
621
(22), 4251–4266.
622
Gonsalves, A.D., 1955. O Babaçu, considerações científicas, técnicas e econômicas.
623
Ministério da Agricultura, Rio de Janeiro, Série Estudos e Ensaios n° 8, 321p.
624
Haralick, R.M., Stenberg S.R., Zhuang X., 1987. Image analysis using mathematical
625
morphology. IEEE T Pattern Anal PAMI-9(4), 532-550. DOI:
626
10.1109/TPAMI.1987.4767941.
31
Hirschmugl, M., Ofner, M., Raggam, J., Schardt, M., 2007. Single tree detection in very high
628
resolution remote sensing data. Remote Sens Environ 110, 533–544.
629
IBGE, 2013. Produção da Extração vegetal e da silvicultura. IBGE, Rio de Janeiro, v. 28, 69p.
630
Jiang, M., Lin, Y., 2013. Individual deciduous tree recognition in leaf-off aerial ultrahigh
631
spatial resolution remotely sensed imagery. IEEE Geosci Remote Sens Lett. 10, 38–42.
632
Johansen, K., Sohlbach, M., Sullivan, B., Stringer, S., Peasley, D., Phinn, S., 2014. Mapping
633
Banana Plants from High Spatial Resolution Orthophotos to Facilitate Plant Health
634
Assessment. Remote Sensing 6, 8261–8286. doi:10.3390/rs6098261.
635
Kahn, F., 1986. Adaptation en forêt tropicale humide: le cas des palmiers amazoniens. in:
636
Hallé, F. (ed.), L'arbre: compte-rendu du colloque international. Naturalia Monspeliensia,
637
Montpellier, p. 171-189.
638
Laurin, G.V., Chan, J.C.W., Chen, Q., Lindsell, J.A., Coomes, D.A., Guerriero, L., Frate, F.
639
D., Miglietta, F., Valentini, R., 2014. Biodiversity Mapping in a Tropical West African
640
Forest with Airborne Hyperspectral Data. PLoS ONE 9(6), e97910.
641
http://dx.doi.org/10.1371/journal.pone.0097910
642
Lin, M.J.Y., 2013. Individual Deciduous Tree Recognition in Leaf-Off Aerial Ultrahigh
643
Spatial Resolution Remotely Sensed Imagery. IEEE Geosci Remote Sens Lett 10(1),
38-644
42.
645
Lorenzi, H., Noblick, L.R., Kahn, F., Ferreira, E., 2010. Flora brasileira – Arecaceae
646
(Palmeiras). Plantarum, São Paulo, 384 p.
647
Luo, L., Wang, X., Guo, H., Liu, C., Liu, J., Li, L., Du, X., Qian, G., 2014. Automated
648
Extraction of the Archaeological Tops of Qanat Shafts from VHR Imagery in Google
649
Earth. Remote Sensing 6(12), 11956-11976.
650
Malek, S., Bazi, Y., Alajlan, N., Alhichri, H., Melgani, F., 2014. Efficient Framework for
651
Palm Tree Detection in UAV Images. IEEE J-STARS 7(12), 4692-4703.
32
Martins, R.C., Filgueiras, T.S., Albuquerque, U.P., 2014. Use and Diversity of Palm
653
(Arecaceae) Resources in Central Western Brazil. The Scientific World Journal ID
654
942043, 14 pages. http://dx.doi.org/10.1155/2014/942043
655
May, P.H., Anderson, A.B., Balick, M.J., Frazão, J.M.F., 1985. Subsistence benefits from the
656
babassu palm (Orbignya martiana). Econ Bot 39,113-129.
657
Mitja, D., Miranda, I.S., Velasquez, E., Lavelle, P., 2008. Plant species richness and floristic
658
composition change along a rice-pasture sequence in subsistence farms of Brasilian
659
Amazon, influence on the fallows biodiversity (Benfica, State of Pará). Agr Ecosyst
660
Environ 124(2), 72-84.
661
Mitja, D., Ferraz, I., 2001. Establishment of babassu in pastures in Pará, Brazil. Palm
662
trees 45(3), 138-147.
663
Mitja, D., Miranda, I.S. 2010. Weed community dynamics in two pastures grown after
664
clearing Brazilian Amazonian rainforest. Weed Res 50, 163–173.
665
Montúfar, R., Anthelme, F., Pintaud, J.C., Balslev, H., 2011. Disturbance and Resilience in
666
Tropical American Palm Populations and Communities. The Botanical Review 77(4),
667
426-461.
668
Pintaud, J.-C., Galeano, G., Balslev, H., Bernal, R., Borschenius, F., Ferreira, E., Granville, J.
669
J., Mejía, K., Millán, B., Moraes, M., Noblick, L., Stauffer, F.W., Kahn, F., 2008. Las
670
palmeras de América del Sur: diversidad, distribución e historia evolutiva. Revista
671
Peruana de Biologia 15(Supl. 1), 7–29.
672
Porro, N., Veiga, I., Mota, D., 2011. Traditional communities in the Brazilian Amazon and
673
the emergence of new political identities: the struggle of the quebradeiras de coco babaçu
674
- babassu breaker women. Journal of Cultural Geography 28 (1), 123-146.
675
Porro, R., Porro, N.S.M., 2014. Social roots of resource use routes in rural Maranhão, Brazil.
676
Journal of Rural Studies 36, 64-76.
33
Pouliot, D.A., King, D.J., Bell, F.W., Pitt, D.G., 2002. Automated tree crown detection and
678
delineation in high-resolution digital camera imagery of coniferous forest regeneration.
679
Remote Sens Environ 82, 322-334.
680
Protásio, T.P., Trugilho, P.F., César, A.A.S., Napoli, A., Melo, I.C.N.A., Silva, M.G., 2014.
681
Babassu nut residues: potential for bioenergy use in the North and Northeast of
682
Brazil. SpringerPlus 3 (1), 1. Doi:10.1186/2193-1801-3-124
683
R Core Team, 2014. R: a language and environment for statistical computing. R Foundation
684
for Statistical Computing. http://www.R-project.org/ (accessed 14.01.17).
685
Rich, P.M., Helenurm, K., Kearns, D., Morse, S.R., Palmer, M.W., Short, L., 1986. Society
686
Height and Stem Diameter Relationships for Dicotyledonous Trees and Arborescent Palm
687
trees of Costa Rican Tropical Wet Forest. B Torrey Bot Club 113 (3), 241-246.
688
Ritter, L., Martins, P., Cooper, M., Grimaldi, C., 2009. Variação e possibilidades de uso do
689
solo sobre rochas cristalinas na Amazônia oriental. Novos Cadernos NAEA 12(1),
225-690
246.
691
Sampaio, S.M.N., 2008. Dinâmica da paisagem e complexidade espacial de um Projeto de
692
Assentamento da Amazônia Oriental. 2008. Thesis (PhD), Universidade Federal Rural da
693
Amazônia. 175 p.
694
Santos, A.M., Mitja, D., 2011. Wooded cattle pasture in the benfica seetling project in
695
Itupiranga, Pará, Brazil. Rev Arvore 35(4), 919-930.
696
Schmidtlein, S., Feilhauer, H., Bruelheide, H., 2012. Mapping plant strategy types using
697
remote sensing. J Veg Sci 23, 395–405.
698
Serra, J., 1982. Image analysis and mathematical morphology. Academic Press, New-York.
699
Shafri, H.Z.M., Hamdan, N., Saripan, M.I., 2011. Semi-automatic detection and counting of
700
oil palm trees from high spatial resolution airborne imagery. Int J Remote Sens 32(8),
701
2095-2115. http://dx.doi.org/10.1080/01431161003662928
34
Shufelt, J.A., 1999. Performance evaluation and analysis of monocular building extraction
703
from Aerial imagery. IEEE T Pattern Anal 21, 311–326. DOI: 10.1109/34.761262
704
Soille, P., Pesaresi, M., 2002. Advances in mathematical morphology applied to geoscience
705
and remote sensing. IEEE T Geosci Remote 40, 2042–2055.
706
Srestasathiern, P., Rakwatin, P., 2014. Oil Palm Tree Detection with High Resolution
Multi-707
Spectral Satellite Imagery. Remote Sensing 6(10), 9749-9774.
708
Teixeira, M.A., 2003. Uma Agenda para o Babaçu. Revista Econômica do Nordeste 34(4),
709
562-575.
710
Torres-Méndez, L.A., Ruiz-Suárez, J.C., Sucar, L.E., Gómez, G., 2000. Translation Rotation
711
and Scale-Invariant Object Recognition. IEEE T Systems Man and Cybernetics,
30:125-712
130. DOI: 10.1109/5326.827484.
713
Wang, Y.H., Augspurger, C., 2006. Comparison of seedling recruitment under arborescent
714
palm trees in two Neotropical forests. Oecologia 147(3), 533-45.
715
Whiteside, T., Boggs, G., Maier, S., 2011. Extraction of tree crowns from high resolution
716
imagery over Eucalypt dominant tropical savanna. Photogramm Eng Rem S 77 (8),
813-717
824.
718
Zhang, J., Rivard, B., Sánchez-Azofeifa, A., Castro-Esau, K., 2006. Intra- and inter-class
719
spectral variability of tropical tree species at La Selva, Costa Rica: Implications for
720
species identification using HYDICE imagery. Remote Sens Environ 30 105(2), 129-141.
721
http://dx.doi.org/10.1016/j.rse.2006.06.010
722
Zhou, J., Proisy, C., Descombes, X., Le Maire, G., Nouvellon, Y., José-Luiz, S., Viennois, G.,
723
Zerubia, J., Couteron, P., 2013. Mapping local density of young Eucalyptus plantations
724
by individual tree detection in high spatial resolution satellite images. Forest Ecol Manag
725
301, 129-141. http://dx.doi.org/10.1016/j.foreco.2012.10.007