ASSESSING INTEGRATION BETWEEN EMERGING AND
CONVENTIONAL OPERATIONS IN URBAN AIRSPACE
Parker D. Vascik and R. John Hansman
This report presents research originally published under the same title at the 19
thAIAA Aviation
Technology, Integration, and Operations Conference in Dallas, TX. Citations should be made to
the original work.
Report No. ICAT-2019-08
June 2019
MIT International Center for Air Transportation (ICAT)
Department of Aeronautics & Astronautics
Massachusetts Institute of Technology
Cambridge, MA 02139 USA
1 Ph.D. Candidate, ICAT, MIT, 77 Massachusetts Avenue, 33-115, Student Member, AIAA. 2 Professor of Aeronautics and Astronautics, MIT, 77 Massachusetts Avenue, 33-303, AIAA Fellow.
1
American Institute of Aeronautics and Astronautics
Assessing Integration Between Emerging and Conventional
Operations in Urban Airspace
Parker D. Vascik1 and R. John Hansman2
Massachusetts Institute of Technology, Cambridge, Massachusetts, 02139
This paper investigates the use of low altitude airspace by conventional flight operations in proximity to the San Francisco, Boston, and Atlanta international airports. The purpose of the investigation is two-fold. First, the study presents an approach to develop lateral and vertical containment boundaries for arrival and departure flight trajectories. The boundaries describe the extent of the airspace actively used to support the flights. Second, the study develops containment boundaries for large transport aircraft operations at the three airports to demonstrate how these conventional operations may influence where and when emerging Unmanned Aircraft Systems (UAS) or Urban Air Mobility (UAM) networks may operate.
180 days of ASDE-X radar tracking data were analyzed to determine the location and traffic density of large transport aircraft, helicopters, and four other classes of operators. The flight trajectories for each operator class were sorted into arrivals, departures, and missed approaches to or from each runway. Containment boundaries were first developed for transport aircraft with greater than 100 passenger seats. Airspace that remained outside the containment boundary could potentially support simultaneous but non-interfering UAS or UAM operations. Variations in containment size due to airport-specific attributes were investigated. Containment boundary expansion to accommodate regional and commuter aircraft operations was assessed. Finally, airport access for UAM or UAS operators based upon conventional flight operations was considered.
I. Introduction
HE emergence of Unmanned Aircraft System (UAS) and Urban Air Mobility (UAM) operations may introduce an unprecedented number of new aircraft into metropolitan airspace, especially at altitudes below 3000 ft. The number of these new operations, their use of droneports and vertiports in urban settings, and the altitudes at which they may operate will exacerbate the Air Traffic Control (ATC) challenge of providing safe and efficient flight [1,2].
The airspace integration of these new operators will be most difficult near major airports where large transport aircraft operate on complex, relatively static approach and departure procedures. As a second mover into an industry with a regulatory-enforced safety-based culture, UAM and UAS operations will be required to integrate into low altitude metropolitan airspace in a manner that is minimally interfering with current airport operations [2]. Developing a data-centric understanding of the location and traffic density of current air transport operations is a first step to enable the design of simultaneous but non-interfering routes for these emerging operators.
To this end, this paper assesses how airspace above urban areas is currently utilized for flight by the incumbent aviation operators and airspace management systems. Flight operations from 2015 and 2016 are evaluated for Boston, Atlanta, and San Francisco. The primary airports in these cities have different runway configurations, aircraft fleet mixes, proximity to the urban core, and weather conditions. These qualities of the airport and operating environment were anticipated to influence the airport’s concept of operations and result in different utilization of the airspace.
To determine airspace utilization, current flight operations as recorded in radar tracking data from Airport Surface Detection Equipment, Model X (ASDE-X) are evaluated. The radar data provides information on all flights that occur within approximately ten nautical miles of the airports. The flight tracks of large transport aircraft, regional jet and turboprop aircraft, business aircraft, commuter airline aircraft, General Aviation (GA) aircraft, and helicopters are distinguished from one another.
2
American Institute of Aeronautics and Astronautics
The position (latitude, longitude, altitude) and traffic density of the flight tracks over approximately 180 days of operations provides an impression of how each of these categories of conventional operators uses the airspace above cities and near major airports. Furthermore, analysis of large numbers of flight trajectories to or from a specific runway enables the definition of containment boundaries that describe the lateral and vertical extremes of as-flown approach and departure procedures. By varying the coverage of the containment boundaries from the 95th percentile flight up to
the 100th percentile flight, the concentration of the trajectories and influence of off-nominal operations is discerned.
Finally, the utility of the flight trajectory containment analysis to support the design of UAS or UAM operations to, from, or in proximity to large commercial airports is considered. Opportunities for simultaneous but non-interfering UAS and UAM procedures in various configurations of each airport are discussed.
This work is anticipated to support civil aviation authorities, air navigation service providers, Unmanned Aircraft System Traffic Management (UTM) service providers, airports, and emerging aircraft operators.
II. Background
The integration of UAS or UAM operations in metropolitan airspace is critical to the success of their implementation and scaling. Airspace integration affects what surface locations these operators may access, when they may access them, the directness of routing between them, the surface or airborne delay that may be applied at them, and even the training of pilots and equipage of aircraft required for the service. Furthermore, many of the projected near-term markets for UAM and UAS operations require flight to, from, or in proximity to large airports located near the city centers. Interaction with high volumes of transport aircraft will add an additional level of complication for integration.
Any future air traffic management approach to support UAM and UAS will need to evolve from today’s system as these emerging operators are second movers into a system that:
1. has an intense safety culture where the burden of proof is on the change agent 2. is highly regulated creating resistance to quick changes
3. primarily supports a current user (commercial aviation) who fulfills a unique social need that is unmet by any other form of transportation
4. is managed by an external gate keeper (the FAA) who has less incentive for risk taking
Considering this, it is reasonable to assume that initial UAM and UAS operations must integrate into the existing airspace system without requiring substantial changes to conventional operations. This leads to the need to have a high-resolution and data-driven understanding of how aircraft currently utilize airspace where UAS and UAM may desire to operate. Because there may be greater flexibility to adjust the flight operations of helicopter, general aviation, commuter, and business aircraft operators as opposed to regional and large transport aircraft, this research will consider the airspace utilization of these different categories of operators separately with an initial focus on transport aircraft with more than 100 passenger seats.
Characterizing airspace availability for emerging low altitude operators has been a focus of numerous recent research efforts. Georgia Tech [3] and MIT researchers [4] displayed how surface-level controlled airspace and commercial flight operations may impact or even exclude new operators in significant portions of major cities. NASA researchers [5] compiled a list of airspace integration challenges for UAM that will affect airspace access including terrain/obstructions, controlled airspace, and transport aircraft on airport procedures. Various researchers also introduced tools to assess airspace availability when provided three dimensional definitions of no-fly zones as inputs [6–8]. This paper compliments these studies by developing an approach to create three dimensional containment bounds for the flight trajectories of conventional aircraft operations.
In addition to research, the FAA has begun the large-scale integration of small UAS into the national airspace. Part 107 of Title 14 of the Code of Federal Regulations (CFR)1 enables UAS less than 55 lbs in gross weight to operate in many areas up to 400 ft Above Ground Level (AGL). As a first step to allow UAS operation in close proximity to
1 All Title 14 references in this paper were from the electronic Code of Federal Regulations, http://www.ecfr.gov,
3
American Institute of Aeronautics and Astronautics
manned aircraft, the FAA also implemented the Low Altitude Authorization and Notification Capability (LAANC) in May, 2018. LAANC enables third party UAS service suppliers to access FAA airspace data and grant near real-time authorization for UAS operations in pre-designated airspace volumes within controlled airspace near airports. As of the beginning of 2019, LAANC had handled over 50,000 UAS operations at 500 airports [9] and represented the foundation for a more comprehensive UAS Traffic Management (UTM) system [2].
The fundamental concept of LAANC was to identify airspace where conventional aircraft rarely operate and in which simultaneous UAS operations could be authorized with a low risk of interference; the efforts of this paper support this operational principle.
III. Methodology
One year of radar flight tracking data spanning from April 2015 to March 2016 was collected from the FAA’s Airport Surface Detection Equipment Model X (ASDE-X) at Boston, San Francisco, and Atlanta international airports. Of this initial data set, approximately 180 days had a full 24 hours of flight tracking records and were utilized for the analysis. ASDE-X data was selected for this analysis as it combines surface surveillance radar, multilateration sensors, airport surveillance radars, and Automatic Dependent Surveillance - Broadcast (ADS-B) data in order to provide a high-fidelity record of aircraft operations with as low as a one second update rate. ASDE-X was the best data option to capture helicopter and GA operations (which may not be equipped with an ADS-B), as well as provide resolution for maneuvers in terminal airspace. The flight tracks were smoothed where necessary and incomplete or infeasible trajectories were discarded.
The flight tracks were sorted into the six operational categories listed below based upon the reported type of aircraft and callsign (i.e. flight number). Because GA and helicopter operators did not often report either of these data, the flight tracks for these operators were identified based upon altitude and speed characteristics.
1. large transport aircraft: >100 passengers (eg. B737, E170) 2. regional aircraft: 20-100 passengers (eg. E145, CRJ7) 3. business aircraft: (eg. GLF6, LJ70)
4. commuter aircraft: 6-19 passengers (eg. C402, BE80) 5. general aviation aircraft: <5 passengers (eg. SR22, C172) 6. helicopters
Departing and arriving flights were distinguished by identifying if the initial or final data points in the flight track were located on the surface of the airport, respectively. Transiting flights were distinguished if no part of the flight track came within 100 ft AGL over any runway. Finally, aircraft that executed a missed approach were distinguished from the normal arriving or transiting flights by identifying flight tracks that either descended at least 1000 ft below their initial altitude or below 3000 ft AGL, and then rose at least 400 ft above their minimum altitude. Potential missed approach paths were manually checked for validity and assigned to the approach runway. Arriving and departing operations were assigned to the runway they touched down or lifted off from, respectively.
The purpose of grouping the trajectories by runway was to give insight into how airspace utilization is contingent upon airport configuration and active runways. The number of transiting operations (as opposed to arrivals and departures) that occurred below 3000ft was <1% for the large transport, regional, and commuter categories, therefore only arrival and departure operations were evaluated for these operators. General aviation and helicopter operations were not divided into arrivals, departures, and transits, but rather all trajectories were evaluated together.
The main contribution of the analysis was to define three dimensional bounding boxes that contained a desired percentile of the flight trajectories in each of the runway groups. These “trajectory containment boundaries” support the evaluation of how airspace is utilized by specific arrival and departure procedures. For the initial analysis presented in this paper, the containment boundaries were developed only for large transport flight trajectoreis, except in Section IV-F where regional and commuter aircraft are evalauted as a sensitivity anaysis.
Figure 1 presents the notional development of a trajectory containment boundary for a set of flight trajectories. The containment boundary is developed as a chosen number of “sample boxes” that are defined normal to the mean (i.e. centerline) trajectory. The height and width of each sample box are defined to include a specified percentile of the flight tracks at the along-track distance of the box. Along-track distance is measured for all trajectories from the
4
American Institute of Aeronautics and Astronautics
demarcation bar or threshold at the far end of the runway for arrivals, and from the starting end of the runway for departures. This reference point on the runways accomodates different starting or ending points of the radar tracking data and calculates trajectory dispersion at equal distances from the airport. A limitation of defining the containment boundaires through sequential along-track square areas, however, is that trajectories that conduct greater than 90˚ turns away from the centerline trajectory are not accuratley represented. Future work may explore alternative approaches to accurately account for procedures with these types of flight trajectories.
Figure 2 displays an example of a single sample box viewed normal to the centerline flight trajectory. If the containment boundary was specified to capture the 95th percentile flight, then
the lower altitude would correspond to the 2.5th
percentile trajectory and the upper altitude would correspond to the 97.5th percentile trajectory.
It should be noted that excluding points that were beyond the specified percentile in both the vertical and lateral direction actually results in the containment boundary inscribing fewer total points than the specified percentile. However, this was deemed to be appropriate as air traffic is
managed by providing either vertical or lateral separation, so the two dimensions may be considered separately. Trajectory containment boundaries were developed and evaluated for operations at Boston, San Francisco, and Atlanta international airports. The containment boundaries were developed for various aircraft types, runway configurations, and percentile containments. The evaluation of these containments provided insight into how accurately conventional operators currently fly, the airspace they use, and how UAS or UAM could potentially to, from, or in proximity to airports in a non-interfering way. The lateral and vertical minima for radar separation were also applied around the trajectory containment boundaries and their effect on airspace usage was considered.
IV. Analysis A. ASDE-X Flight Tracking Analysis
Boston Logan International Airport (BOS), San Francisco International Airport (SFO), and Hartsfield-Jackson Atlanta International Airport (ATL) were selected as case studies as they have different runway configurations, traffic mixes, and weather; these differences drive variation in their air traffic management approaches and airspace usage.
Figure 2. Example trajectory containment sample box displaying calculation approach at one along-track location.
radar trajectories
lower percentile altitude upper percentile altitude
right percentile lateral distance containment boundary left percentile lateral distance mean trajectory
Figure 1. Notional development of a trajectory containment boundary.
Radar Trajectories
Mean Trajectory
Containment Boundary
along-track length
between sample boxes
trajectory outside
containment
height of final
sample box
width of 16
thsample box
5
American Institute of Aeronautics and Astronautics
Figure 3 displays the airport runway layout and location with respect to the population density of the surrounding areas. The population density in proximity to the three airports is markedly different. BOS is located closest to the city center (to the west of the airport) and has multiple runways that create overflight of highly population-dense regions. SFO is located south of the primary city center with approaches and departures conducted primarily over water and occasionally over less densely populated areas. ATL is located furthest from the city center (to the north of the airport) and flights land or depart exclusively to the east or west of the airport over much less densely populated areas.
Table I displays characteristics of the three airports and flight tracking analyses conducted for them. The “total flight tracks evaluated” parameter represents the total number of valid flight tracks for all aircraft and operational types identified in the ASDE-X data set. The differences between the number of arrivals and departures at each airport represent limits of data availability rather than actual differences in operations.
Table I. Airport operations and flight tracking analysis details for three case study airports.
Boston San Francisco Atlanta
Runway Layout 6 crossing runways
with 2 parallel sets
2 sets of parallel
crossing runways 5 parallel runways
Primary Runway Configurations1 4 2 2
Total Flight Tracks Evaluated2 198,000 210,000 432,000
Large Transport Aircraft Arrivals (Departures)2 37,000 (56,000) 57,000 (46,000) 99,000 (173,000)
Regional Aircraft Arrivals (Departures)2 21,000 (14,000) 6900 (9200) 13,000 (6600)
Commuter Aircraft Arrivals (Departures)2 9400 (3800) 500 (400) 600 (300)
GA Operations2 5200 5600 5700
Helicopter Operations2 4400 1800 1300
1 configurations active >10% annually based on FAA Aviation System Performance Metrics from 2015-2017 2 flight trajectories remaining after sorting and removing poor quality data for 180 days of radar tracks
A few insights into current air traffic operations at these airports may be gathered directly from the sorted flight trajectories as displayed in Figure 4. Of note, the complexity of fixed-wing arrivals and departures to the airports varies significantly. Over a five day period Boston operated with numerous runway configurations and utilized airspace in all directions. The use of multiple flow configurations is the result of variable wind patterns. Conversely, San Francisco operated in a more stable configuration that utilized airspace primarily to one side of the airport. Atlanta’s parallel runway configuration saw flights approach or depart only from two directions.
Boston San Francisco Atlanta
Figure 3. Airport runway configuration (green) and proximity to populated regions of each case study city.
5NM
5NM
5NM
10NM
6
American Institute of Aeronautics and Astronautics
Although Figure 4 does not provide any quantitative estimation of airspace utilization, it does suggest that different strategies may be needed to integrate UAS or UAM at different airports. Fixed-routs may be appropriate at airports like SFO or ATL, while dynamic routes that respond to configuration changes may be more appropriate at airports like BOS. Considering this, airspace utilization was evaluated for various flow configurations of each airport which themselves have differentiated runway configurations. The appendix contains further detail on the general aviation and helicopter operation flight trajectories at each of the three case study airports.
B. Trajectory Containment Boundary Development
Trajectory containment boundaries were developed for large transport aircraft arrival and departure operations to each runway of the three case study airports. Each containment boundary inscribes the airspace volume within which a specified percentage of the flight tracks remain. The utility of the containment boundary is as a data-based measure of the current usage of airspace by a particular operator. As a first application of the analysis method, this paper developed containment boundaries only for aircraft of the large transport category except during the sensitivity analysis in Section IV-F.
Figure 5 displays flights to the primary SFO arrival runways and the resultant containment boundaries developed for each runway with a 99.5th percentile
trajectory inclusion specification. The containment boundaries are three dimensional and represent the width and height of the cluster at various along-track distances from the runway. In this case, the 99.5th percentile arrival to runway 28R
(pictured in green) has a lateral and vertical variance at five NM from the threshold of less than 4700 ft and 1200 ft, respectively.
C. Containment Boundary Variation with Percentile Inclusion
Before the containment boundaries could be generated and compared for each runway and airport, it was necessary to understand how the size of the boundaries varied with the specified percentile inclusion of the flight trajectories.
arrival trajectories sorted into runway groups
trajectory containment boundaries with 99.5% inclusion
Figure 5. 99.5th percentile trajectory containment boundary development for 56,000 large transport aircraft arrivals to SFO.
28L – 21k flights
19R – 90 flights
28R – 34k flights
19L – 1.6k flights
Boston San Francisco Atlanta
Figure 4. Large transport aircraft arrivals (red) and departures (blue) below 3000ft AGL for 120 hours of operation in April, 2015.
7
American Institute of Aeronautics and Astronautics
Selecting too low a percentile inclusion could potentially exclude low-frequency alternative routes or deviations from the procedure. On the other hand, selecting too high a percentile inclusion could unnecessarily increase the size of the containment boundary to capture poor quality data or off-nominal flight operations. Considering this, the analysis first conducted a sweep of percentile inclusion from 95% to 100% for all runways at each airport to identify how the containment boundaries changed.
Figure 6 presents the 95th, 99th, 99.5th, 99.9th and 100th percentile containment boundaries for arrivals to BOS
runway 27. From the figure, a dramatic expansion in containment width is visible in the 99.9th (magenta) and 100th
(cyan) percentile containments. The 99.5th and lower percentile containment boundaries have similar widths,
especially within four NM of the runway threshold. Considering that only 1 in 1000 flights or fewer use the additional airspace within the 99.9th or 100th percentile
containment boundary, it is reasonable to assume these flights were non-standard approach operations. These non-standard trajectories could potentially be attributed to more aggressive ATC vectoring during night-time or low-traffic periods, or perhaps to poor navigational performance. In any case, the 99.5th
percentile containment would seem appropriate to use for analysis of airspace usage by BOS runway 27 arrival procedures. Future work could enhance the validity of this assumption by isolating the cause of flight deviations for these marginal percentiles.
A second comment on Figure 6 concerns the “fanning” of the containment boundaries that is apparent beyond roughly four NM from the threshold. The fanning is the result of aircraft turning onto final approach rather than conducting
straight-in arrivals. The asymmetric shape of the 95th percentile containment (grey) compared to the other
containments reveals that nearly all aircraft that turn onto final approach to runway 27 do so from the south, with no overshoot of the procedure centerline. The expansion of the containment boundary to the north of the procedure centerline is accounted by the final 5th percentile of flights. This information is possible to discern through the
comparison of containment boundaries at different percentile inclusion specifications.
Compared to BOS arrival procedures, Figure 7 presents containment boundaries for the primary arrivals runways at ATL. The fanning effect of the containment boundary is not apparent out to eight NM, even at the 100th percentile
containment. This suggests arrivals to ATL operate more precisely with a longer stabilized approach on final and fewer off-nominal operations. This increased precision may be the result of triple simultaneous parallel arrival operations at ATL which require special approach procedures. Despite the differences in flight dispersion between ATL and BOS, the 99.9th and 100th percentile containment boundaries at ATL also appear to be an inflection point for
containment width.
Figure 8 and Figure 9 display the average lateral width of the containment boundaries as a function of along-track distance from the threshold for arrivals and departures to each airport, respectively. The first takeaway is that the 99.5th
percentile corresponds to an inflection in the containment boundary width for arrivals and departures at all three airports. Considering this, the 99.5th percentile containment is used for all visualizations and analysis in this paper.
Similar to what was observed in Figure 7, ATL exhibits greater flight concentration at all along-track distances than the other airports in Figure 8. BOS had a small number of aircraft that turn onto final within the last 2 NM resulting in the greatest lateral containment of the three airports at the 99.9th and 100th percentile containments. An
Figure 6. Containment boundary variation with percentile for 9,000 large transport aircraft arrivals to
BOS runway 27. 4 NM 100thPercentile 99.9thPercentile 99.5thPercentile 99thPercentile 95thPercentile
8
American Institute of Aeronautics and Astronautics interesting observation,
however, is that the width of the 95th percentile containment
boundary at BOS is smaller than that of SFO and similar to that of ATL out to approximately three NM of the threshold. This suggests that the large majority of aircraft arriving to BOS fly as accurately as those at ATL, but a small number of other operations utilize a disproportionally large volume of airspace.
Departure operations exhibit larger trajectory dispersion than arrivals for all three airports at all containment specifications as shown in Figure 9. This difference is the result of different navigational requirements and ATC concepts of operation for arrivals and departures. For example, controllers may assign various departure procedures from the same runway, or even authorize aircraft to depart the published procedure soon after takeoff to accommodate more direct routings or reduce noise exposure [10]. Arrival procedures, on the other hand, require aircraft to acquire final approach guidance before descending beyond specific altitudes resulting in high navigational consistency.
The following sections discuss in greater detail the containment boundaries and airspace utilization at each airport.
Figure 7. Containment boundary variation with percentile for 63,000 ATL large transport aircraft arrivals to runways 26R, 27L, and 28.
4 NM 100thPercentile 99.9thPercentile 99.5thPercentile 99thPercentile 95thPercentile
Figure 9. Lateral width of the trajectory containment boundaries for departures at the case study airports. The reported width for each airport is a weighted average based on the number of flights each runway supported.
0 2 4 6 8 10 0 1 2 3 4 La te ra l Co n ta in m e n t W id th (10 00 f t)
Along-Track Distance from Threshold (NM)
BOS Departures 95th Percentile 99th Percentile 99.5th Percentile 99.9th Percentile 100th Percentile 0 2 4 6 8 10 0 1 2 3 4 La te ra l Co n ta in m e n t W id th (10 00 f t)
Along-Track Distance from Threshold (NM)
SFO Departures 95th Percentile 99th Percentile 99.5th Percentile 99.9th Percentile 100th Percentile 0 2 4 6 8 10 0 1 2 3 4 La te ra l Co n ta in m en t W id th (10 00 f t)
Along-Track Distance from Threshold (NM)
ATL Departures 95th Percentile 99th Percentile 99.5th Percentile 99.9th Percentile 100th Percentile
Figure 8. Lateral width of the trajectory containment boundaries for arrivals to case study airports. The reported width for each airport is a weighted average based on the number of flights each runway supported.
0 2 4 6 8 10 1 2 3 4 5 6 La te ra l Co n ta in m e n t W id th (10 00 f t)
Along-Track Distance from Threshold (NM)
BOS Arrivals 95th Percentile 99th Percentile 99.5th Percentile 99.9th Percentile 100th Percentile No data past 4 NM 0 2 4 6 8 10 1 2 3 4 5 6 La te ra l Co n ta in m en t W id th (10 00 f t)
Along-Track Distance from Threshold (NM)
ATL Arrivals 95th Percentile 99th Percentile 99.5th Percentile 99.9th Percentile 100th Percentile
9
American Institute of Aeronautics and Astronautics
D. 99.5th Trajectory Containment Boundary Analysis at Case Study Airports
Figure 10 displays the 99.5th percentile containment boundaries for each group of arrival and departure trajectories
at the three case study airports. The ASDE-X radar tracks from which the containments were developed are presented as Figure 30 in the appendix.
Viewing Figure 10 it is clear that departure operations display greater variance in the lateral spread of their flight trajectories and require substantially larger containment volumes than arrivals. In sub-figure 1a the fanning effect for arrivals to Boston display is also visible. This affect for arrivals is primarily the result of aircraft vectoring onto the final approach procedure. Aircraft approaches such as those to runway 4R (yellow) and 15R (magenta) in sub-figure
(1a) – BOS arrivals (1b) – BOS departures
(2a) – SFO arrivals (2b) – SFO departures
(3a) – ATL arrivals (3b) – ATL departures
Figure 10. 99.5th percentile containment boundaries for 180 days of ASDE-X radar tracking data sorted by runway usage at Boston (BOS), San Francisco (SFO), and Atlanta (ATL) airports.
10
American Institute of Aeronautics and Astronautics
1a are nearly exclusively vectored onto the procedure from only one direction resulting in an asymmetric fan, while the other runways accept aircraft from both directions.
Arrivals to SFO (sub-figure 2a) do not display a pronounced fanning affect as the data only extends to approximately four NM from the threshold; a majority of fanning in BOS occurred at further along-track distances as presented in Figure 8. Arrivals to ATL (sub-figure 3a), on the other hand, have less fanning and smaller containment boundaries than either SFO or BOS. Future work may investigate in more detail what operational factors cause differences in the containment size on final approach for these airports. These factors may include fleet mix of aircraft, type of approach system, turn onto final intercept, and weather, among others.
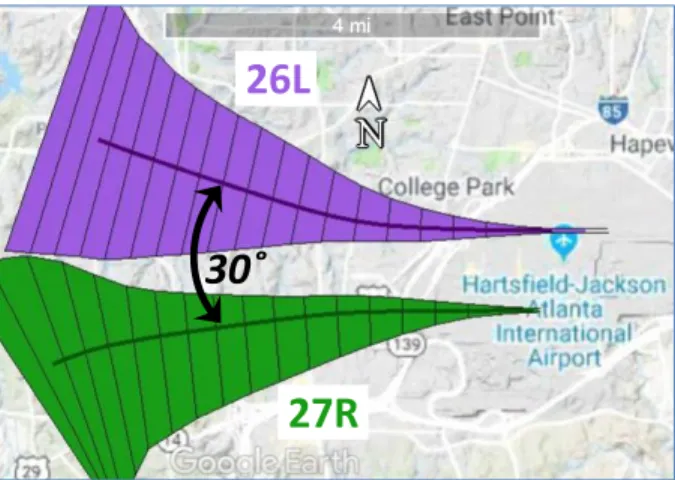
The centerline of the containment boundaries for departures from parallel runways at ATL exhibit a 30˚ divergence angle from one another as displayed in Figure 12. This divergence angle is the manifestation of air traffic control requirements for simultaneous departures or simultaneous arrivals and departures as laid out in FAA Joint Order 7110.65W, sections 5-8-3 and 5-8-5, respectively [11]. BOS also supports numerous turning departure procedures as shown in subfigure 1b of Figure 10, however these turns are conducted for noise abatement purposes to move departing flights over the Boston harbor.
As a final note on departure containment modeling, BOS and SFO both implemented area navigation (RNAV) departure procedures beginning in 2013 (this analysis covered April 2015 – March 2016). The use of RNAV increased the actual navigational performance of aircraft which flew on these new procedures. Figure 11 displays how the 95th
percentile containment boundary for departures from BOS runway 27 is tightly fitted around the RNAV procedure centerline. The remaining flights, however, either were not equipped to fly the RNAV procedure or intentionally departed from it resulting in the large dispersion of flights represented in the 99th percentile containment boundary in
Figure 11.
Future work should repeat the analysis shown in this paper using more recent flight tracking data. This would capture the proliferation of RNAV and Required Navigation Performance (RNP) procedures at airports and their adoption by operators. As displayed in previous research by MIT [10], the adoption of RNAV procedures has led to a concentration of flight trajectories at Logan airport. The adoption of these procedures may have significantly reduced the containment boundary size of current operations compared to those presented in this analysis
Figure 11. Concentration of 95th percentile flights on RNAV departure from BOS runway
27 and the dispersion of the remaining 5th percentile of flights.
99thPercentile
95thPercentile RNAV Centerline
Figure 12. Divergence of departure mean trajectories from primary runways in ATL westerly flow.
30˚
26L
11
American Institute of Aeronautics and Astronautics
E. Missed Approach Operations
The trajectory containment boundaries presented in this paper excluded aircraft that executed missed approach procedures. Missed approach procedures may be initiated at either the controller’s or pilot’s discretion for a variety of situations including lack of runway visual acquisition at the missed approach point or departure from the glideslope. Pilot instructions for missed approaches are published with the instrument approach procedure and describe a route designed to exit the aircraft from the airport area through the use of protected airspace that does not interfere with any other arrival or departure operation.
While approach procedures are precisely defined and flown as displayed in Figure 8 resulting in the use of relatively little airspace, aircraft may initiate a missed approach from any point in the arrival sequence leading to a large dispersion of trajectories. Furthermore, ATC will frequently vector aircraft off the missed approach procedure to rejoin the arrival flow before the aircraft has reached the final hold point; this leads to even greater dispersion and airspace usage for missed approaches.
Figure 13 displays 70 missed approach operations identified for Atlanta’s westerly flow configuration; the 99.5th
percentile approach and departure containment boundaries for this runway configuration have plotted for perspective. Turn-offs onto the missed approach procedure from runway 26R (the most northerly runway) occur over approximately a seven NM span extending from three NM before the runway threshold to four NM after the threshold. All but two of the missed approach trajectories to 26R turn northward and are either vectored to rejoin the downwind of the arrival sequence (approximately five NM north of the runway) or proceed further north to a holding pattern.
The result, as may be seen in Figure 13, is the dispersion of the flights over a large volume of airspace that is not used by the containment boundaries for arrival or departures. The as-flown missed approach trajectories are not concentrated on a procedure centerline, but rather exhibit over five nautical miles of variance from the published missed approach procedure centerline in their turn-off phase. Furthermore, nearly all the flights are vectored off the procedure by ATC before reaching the procedure-specified holding pattern.
Trajectory containment boundaries were not developed for missed approach procedures in this initial study. Considering that missed approach operations utilize
airspace around the airport not used by other procedures, their impact on airspace availability should be considered in future work. UAM and UAS operations may be challenged to integrate effectively with these unpredictable, off-nominal operations. Potential integration approaches include the design of UAM and UAS procedures that do not interact with missed approach procedures, such as the Los Angeles International Airport (LAX) Special Flight Rules Area (SFRA) depicted in Figure 14. Alternatively, performance-based access to dynamically allocated airspace may be possible if UAM or UAS can vacate airspace needed to protect a missed approach within a minimum time period [4].
Figure 13. Missed approach trajectories for Atlanta in westerly flow configuration. 99.5th percentile arrival (green) and departure
(blue) containments for active runways.
Figure 14. A SFRA supports GA and helicopter crossings of Los Angeles International Airport
above the missed approach procedures.
Special Flight Rules Area is:
3500 - 4500ft above runways;
500 ft above missed approaches;
12
American Institute of Aeronautics and Astronautics
F. Sensitivity of Containment Boundary to Other Types of Flight Operations
The initial trajectory containment boundary analysis presented in this paper was only developed for transport category aircraft with greater than 100 passenger seats. This type of aircraft was chosen as it was perceived to be the most critical operator class for UAM or UAS operations to be separated from. However, large transport aircraft are likely to operate more precisely than any other class of operator due to less maneuverability of the aircraft and less willingness on the pilots to fly off-nominal procedures.
Considering this, a sensitivity study was conducted to provide an impression for how the containment boundaries may change in size and shape if the flight trajectories of regional aircraft with between 20-100 passenger seats and commuter aircraft with between five and 19 passenger seats were included. The sensitivity study was conducted for all arrival and departure procedures at BOS.
BOS was selected for the sensitivity study as it was anticipated to have the greatest differences (i.e. represent a worst-case scenario) between large transport aircraft and the small aircraft operations. BOS supports a much larger number of commuter aircraft flights and a higher percentage of regional aircraft flights than either ATL or SFO as shown in Table I. This is primarily due to Cape Air which seasonally operates as many as 140 flights per day using Cessna 402 aircraft. Furthermore, BOS displayed the most aggressive vectoring of arrival and departure procedures for large transport aircraft, and it was assumed this routing flexibility may be even more pronounced for smaller operators. Finally, BOS also has two runways which are exclusively used to support small aircraft operations.
1. Regional and Commuter Aircraft Influence on Primary Runway Containment Boundaries
Figure 15 displays the influence of including regional and commuter aircraft trajectories in the containment boundary definition for departures and arrivals at BOS runway 27. Runway 27 supported approximately 21% of arrivals and 27% of departures making it the third most commonly utilized runway. The containment boundaries for runway 27 display little difference when accounting for regional and commuter aircraft departures, but expanded significantly to accommodate commuter aircraft arrivals. This trend was consistent for all four of the most commonly used runways at BOS.
The trajectories of some regional aircraft, and especially commuter aircraft, joined the approach path closer to the runway threshold leading to the expansion of the containment envelopes. These categories of aircraft are more maneuverable and may have lower approach speeds than the large transport jets enabling their pilots to execute shorter stabilized approaches on arrival. Commuter aircraft were also found to intersect the glideslope from a lower altitude on average than either the regional or large transport aircraft; this resulted in a lowering of the containment boundary floor to accommodate these operations. Commuter aircraft were also responsible for lowering the containment boundary floor for departure operations as they stopped climbing or climbed more slowly than the larger aircraft in some cases,
99.5th percentile departure containment 99.5th percentile arrival containment
Figure 15. Arrival and departure containment boundaries for BOS runway 27 for large transport aircraft, regional aircraft, and commuter aircraft (A/C).
Large Transport A/C Only
Large Transport & Regional A/C
13
American Institute of Aeronautics and Astronautics
2. Regional and Commuter Aircraft Influence on Secondary Runway Containment Boundaries
The impact of regional and commuter aircraft on airspace utilization for non-primary runways was found to be more significant than their impact on the primary runways at BOS. Non-primary or secondary runways were considered as those which supported less than 10% of the large transport operations at the airport. The two critical impacts on airspace usage by regional and commuter aircraft at secondary runways identified at BOS were:
1. The use of runways that supported few to no large transport aircraft operations
2. The use of a visual approach route that used airspace outside the standard arrival pattern
To elaborate on the first impact, runway 4L at BOS supported less than 1000 large transport aircraft arrivals in this data set, and over 4000 regional and commuter aircraft arrivals. Not only was runway 4L was not outfitted with a precision approach system (which resulted in greater flight dispersion for all aircraft types runways equipped with such systems), but both commuter and regional aircraft were found to use a visual approach to the runway that was not used by any large transport aircraft. The alternative visual approach brought aircraft in from the north and merged onto the runway centerline within one mile of the threshold. This approach is displayed in Figure 17 and requires the use of airspace not represented in the containment boundary of the larger aircraft.
In terms of the second impact, commuter and regional aircraft operated to and from two runways at BOS that supported no large transport aircraft operations due to their short length and noise restrictions. Much of airspace used by these flight operations was not accounted for within the transport aircraft containment boundaries. These additional operations represent further potential interaction challenges for UAM or UAS operations. Figure 16 displays the 99.5th
percentile containment boundaries for regional and commuter aircraft on runways 33R and 32 alongside (and intersecting) the boundaries of the primary runways.
Considering the dramatic difference in airspace usage by regional and commuter aircraft to and from secondary runways at some airports, future research should explicitly develop containment boundaries based upon these additional operators.
Figure 17. Alternative approach path to BOS runway 04L utilized by regional and commuter aircraft.
Standard Arrivals Alternative Regional
and Commuter Aircraft Arrivals
Figure 16. Regional and commuter aircraft conduct operations to runways 33R and 32 in a Northwest flow configuration at BOS
resulting in the use of additional airspace.
Rwy 33L – all A/C
Rwy 33R – commuter A/C only Rwy 27 – all A/C
Rwy 32 – regional & commuter A/C only
14
American Institute of Aeronautics and Astronautics
V. Discussion
The trajectory containment analysis for large transport aircraft presented in Section IV was used to evaluate airspace utilization for the primarily flow configurations of the cases study airports. A discussion is presented of their implications for the operation of UAM or UAS flights to, from, or in proximity to these airports. Furthermore, the influence of the radar separation minima for Visual Flight Rules (VFR) and Instrument Flight Rules (IFR) in Class B airspace on airspace utilization is displayed. When radar separation is applied, aircraft operating under VFR must remain either 500 ft vertically or 1.5 NM laterally from other aircraft (operating either VFR or IFR); aircraft operating under IFR must remain either 1000 ft vertically or 3.0 NM laterally from other IFR aircraft.
The analysis presented in this paper complements previous work that evaluated airspace availability based upon procedure centerlines and the U.S. Standards for Terminal Instrument Procedure (TERPS) obstacle clearance surfaces [8]. The unique value of the approach presented in this paper is that it empirically accounts for the deviation of conventional aircraft flights from published procedures. Such a deviation may occur due to degraded navigational performance, the use of visual flight operations, or due to vectoring by the controllers. With this capability, the approach presented in this paper may support emerging operators to identify airspace and design flight routes that have a low probability of interaction with conventional flight operations.
A. San Francisco International Airport (SFO)
SFO operates nearly exclusively in two configurations as a result of stable wind patterns and metroplex interactions with nearby Oakland and San Jose international airports. Based upon airport configuration reporting data gathered for the radar sample period from the FAA’s Aviation System Performance Metrics (ASPM) database, SFO operated in a western flow configuration approximately 83% of the time with aircraft arriving to runways 28L and 28R, and departing from 1L and 1R. An alternative western flow configuration was utilized approximately 13% of the time where aircraft both arrived and departed from 28L and 28R due to strong winds from the WNW. Finally, for less than 3% of the time SFO operated in a southeastern flow configuration where aircraft arrived to 19L and 19R, and departed from 28L and 28R. Figure 18 displays the three configurations.
The various runway configurations result in different airspace utilization. Figure 19 displays the lateral extent and floor altitudes of the 99.5th percentile containment boundaries for the active runways when SFO is in the low wind
western flow configuration. The second and third subfigures display the influence of applying the VFR and IFR radar separation minima to the containment boundaries.
Images like Figure 19 provide a wealth of information concerning the potential integration of UAM or UAS operations near major airports and may be useful for planning purposes. The edges of the containment boundaries may be considered as the worst-case scenario location for conventional flights at a specific confidence level (i.e. the percentile). With this viewpoint, the first sub-figure indicates that emerging operators could fly west of SFO with no Western Flow (Low Wind) – 83% Western Flow (Strong Wind) – 13% Southeastern Flow – 3%
Figure 18. SFO primary runway configurations. 28L 28R 1R 1L 28L 28R 28R 28L 19L 19R 28R 28L
15
American Institute of Aeronautics and Astronautics
anticipated interactions with conventional aircraft. Emerging operators may also be able to pass below departing operations east of the airport as the containment boundary floor rises rapidly over the bay.
The second two sub-figures are perhaps more useful to understand integration opportunities as they display the en-route separation requirements as applied to the edge of the containment boundaries (a worst-case scenario separation assumption). Air traffic controllers could anticipate a low probability of loss of separation if UAS and UAM flights remain below the altitude floors or outside the lateral bounds displayed in these sub-figures. This implies that when SFO is in the westerly flow configuration, UAM and UAS aircraft could operate in a simultaneous, non-interfering manner to the west of the airport. However, emerging operations may be restricted to altitudes below 300 ft AGL if they desire to operate over the bay to the east of the airport in instrument conditions.
Figure 20 and Figure 21 present the 99.5th containment boundaries for conventional aircraft operations at SFO in
the high wind western flow and southeastern flow configurations, respectively. In the high wind western flow, both arrivals and departures occur on runways 28L and 28R. This shifts departing operations to the northwest of the airport potentially impacting UAM or UAS flights connecting from San Francisco to the south bay via routes west of the airport. Flight beneath the departures may be possible in visual conditions, however the required vertical separation and mountainous terrain west of SFO may prevent underflight of these departures in instrument conditions. Finally, the shift of departures opened up airspace to the northeast of the airport over the bay where UAM or UAS aircraft could potentially operate. A crossing route overtop SFO may also be possible in this configuration.
Containment Boundary Extent with VFR Radar Separation Minima with IFR Radar Separation Minima
Figure 19. SFO low wind western flow configuration displaying the 99.5th percentile containment boundaries for the active runway procedures with various radar separation minima applied.
Containment Boundary Extent with VFR Radar Separation Minima with IFR Radar Separation Minima
Figure 20. SFO high wind western flow configuration displaying the 99.5th percentile containment boundaries for the active runway procedures with various radar separation minima applied.
16
American Institute of Aeronautics and Astronautics
When SFO operates in the southeastern flow configuration as displayed in Figure 21, UAM and UAS have increased opportunity to operate in a non-interfering manner south of the airport. However, conventional operations utilize much of the airspace north of the airport. Flight in this area may require circuitous routing to San Francisco or very low altitude flight over the bay. Access to and from SFO may potentially be supported from the south.
B. Boston International Airport (BOS)
BOS operates with four common runway flow configurations due to the frequent shifting of predominant wind direction that it experiences.
According to the airport operator for BOS, the use of each flow configuration varies between 17% and 37% as shown in Figure 22.
Figures 23 through 26 present the 99.5th containment boundaries for
conventional aircraft for the four BOS flow configurations. Of note is the dramatic difference airspace usage over the city of Boston in the different configurations. The southeast and southwest configurations both route departures over the water to the east while the northeast and northwest configurations route departures over portions of the city. Since departures are far more dispersed than arrivals for most runways, this results in a reduction of available airspace for UAM or UAS operations over Boston in these latter two airport configurations.
Containment Boundary Extent with VFR Radar Separation Minima with IFR Radar Separation Minima
Figure 21. SFO southeast flow configuration displaying the 99.5th percentile containment boundaries for the active runway procedures with various radar separation minima applied.
Northeast Flow – 18% Southwest Flow – 28%
Northwest Flow – 37% Southeast Flow – 17%
Figure 22. BOS primary runway configurations. 4L 4R 9 4L 4R 22L 27 22R 22L 22R 33L 32 33L 27 27 33R 15R 14 15L 15R 15L 9
17
American Institute of Aeronautics and Astronautics
The southwest flow configuration at BOS in Figure 23 provides the least overflight of the city as arrivals occur over the bay or shoreline and departures are turned out over the harbor. This configuration could potentially enable simultaneous and non-interfering UAM or UAS access to a majority of the city center and surrounding populations. Emerging operators may also be able to access BOS from the northwest towards runway 15R. The application of VFR separation minima to the containment boundaries reduces access to the central business district, and the IFR separation minima influence access to much of the city.
The southeast flow configuration for BOS in Figure 24 enables non-interfering access for UAS or UAM to Boston’s central business district when VFR separation minima area applied, and access to a greater portion of the city when IFR minima are applied. However the use of runway 15R for arrivals potentially limits routing from the south of the city to the north of the city, especially in instrument conditions when under flight of the arrivals may not be possible. Routing aircraft over the airport may be a potential means to address this issue.
The northeast and northwest flow configurations for BOS present greater challenges for the integration of UAM or UAS operations in a non-interfering manner. The containment boundaries for these configurations are shown in Figure 25 and Figure 26, respectively. It should be noted that Figure 25 only displays the containment boundaries for large transport jet arrivals, and it was shown in Figure 17 that regional and commuter aircraft operations to runway 4L use additional airspace not represented in this image. Similarly, the use of runways 33R and 32 by regional and commuter aircraft will also expand the airspace utilization of the northwest configuration compared to that shown in Figure 26.
Containment Boundary Extent with VFR Radar Separation Minima with IFR Radar Separation Minima
Figure 23. BOS southwest flow configuration displaying the 99.5th percentile containment boundaries for the active runway procedures with various radar separation minima applied.
Containment Boundary Extent with VFR Radar Separation Minima with IFR Radar Separation Minima
Figure 24. BOS southeast flow configuration displaying the 99.5th percentile containment boundaries for the active runway procedures with various radar separation minima applied.
18
American Institute of Aeronautics and Astronautics
C. Atlanta International Airport (ATL)
ATL operates in two primary runway configurations that mirror one another based upon wind direction as displayed in Figure 27. Simultaneous, triple parallel arrivals are frequently in effect in either configuration. Due to the parallel runway layout, the location of the airport in less densely populated areas, and the higher level of navigational
Containment Boundary Extent with VFR Radar Separation Minima with IFR Radar Separation Minima
Figure 25. BOS northeast flow configuration displaying the 99.5th percentile containment boundaries for the active runway procedures with various radar separation minima applied.
Containment Boundary Extent with VFR Radar Separation Minima with IFR Radar Separation Minima
Figure 26. BOS northwest flow configuration displaying the 99.5th percentile containment boundaries for the active runway procedures with various radar separation minima applied.
Western Flow – 64% Eastern Flow – 36%
Figure 27. ATL primary runway configurations.
28
26L
27R
26R
27L
10
8L
9R
8R
9L
19
American Institute of Aeronautics and Astronautics
precision observed for both arrivals and departures, it appears non-interfering UAS or UAM operations may be more readily integrated into the airspace surrounding ATL than at BOS or SFO.
Figure 28 and Figure 29 present the 99.5th containment boundaries for conventional aircraft operations in the
western and eastern flow configurations at ATL, respectively. The central business district of Atlanta is located seven miles north of the airport’s closest runway and neither arrival nor departing flights to this runway influence potential UAM or UAS operations in the city. Emerging operators could potentially approach the airport perpendicularly to the runways as is currently conducted by small aircraft and helicopters as discussed in the appendix. Alternatively, due to
99.5th Percentile Containment Boundary Extent
with VFR Radar Separation Minima
with IFR Radar Separation Minima
Figure 28. ATL western flow 99.5th percentile configuration containment boundaries with various
radar separation minima applied.
99.5th Percentile Containment Boundary Extent
with VFR Radar Separation Minima
with IFR Radar Separation Minima
Figure 29. ATL eastern flow 99.5th percentile configuration containment boundaries with various
20
American Institute of Aeronautics and Astronautics
the greater navigational precision of arrivals at ATL compared to at BOS or SFO, emerging operators may also be able to approach the airport with vertical separation beneath the arrival procedures and then fly with reduced lateral separation between or next to the conventional arrivals on final.
VI. Conclusion
An approach to evaluate the usage of airspace by aircraft arrival and departure operations through the use of radar trajectory data was presented. Containment boundaries were developed to define the lateral and vertical extrema within which a specified percentage of flight trajectories remained. The approach to develop containment boundaries was demonstrated for 180 days of large transport aircraft operations at the Boston, Atlanta, and San Francisco international airports. The approach is extensible to other major airports and other categories of aircraft.
The development of containment boundaries is useful for airspace management and planning as they provide an empirical measure of the location and flight density of actual, as-flown aircraft operations. Traditional methods for airspace design assume aircraft remain within a specified tolerance of a flight procedure centerline. However, this assumption may result in an underestimate of how precisely aircraft are actually flying with the use of advanced navigation systems. Alternatively, this assumption may also not account for large deviations from published procedures due to vectoring action by air traffic controllers or the use of visual approaches instead of precision approaches.
The approach presented in this paper enables the evaluation of as-flown procedures and may identify opportunities to take credit for advanced navigational systems in airspace design, or identify areas where actual operations differ from procedure design. This information may support the integration of emerging airspace users including Urban Air Mobility (UAM) and Unmanned Aircraft Systems (UAS). If the assumption is made that conventional, transport class aircraft will have priority usage of airspace, especially near airports, then UAM and UAS will need to identify airspace and routes that support simultaneous and non-interfering operations.
The case studies presented in this paper display the application of the containment boundary approach and provide initial findings. First, all arrival procedures equipped with a precision approach were found to utilize significantly less airspace than corresponding departure procedures. Arrivals to Atlanta demonstrated the least cross-track variance with an average containment width of less than 1000ft at four nautical miles from the runway threshold for 99.5% of flights. Arrival operations to San Francisco and Boston were found to have larger cross-track variance than those at Atlanta. This is possibly the result of the greater flexibility by air traffic controllers at BOS and SFO to vector aircraft onto final approach closer to the threshold; ATL controllers must comply with special requirements necessary to support simultaneous arrivals to parallel runways. Emerging operators may potentially support simultaneous departures through the use of routes that immediately diverge from those of conventional operators. Simultaneous arrivals require specific centerline offset distances, however the high level of navigational performance identified may form a basis to enable more closely spaced arrival operations.
Second, the opportunity for UAS or UAM operations to access airspace in proximity to the case study airports in a simultaneous and non-interfering manner was found to be highly dependent upon the layout of the airports’ runways and the flow pattern in effect. Two of the four flow configurations at Boston were found to provide ample opportunity for the integration of emerging operators, while the other two may hinder their access to the city center. Atlanta International Airport was found to be the most promising airport for UAS or UAM integration due to its location further away from the city center, its use of only two flow configurations, and its parallel runway layout.
Finally, the work presented in this paper was an initial investigation of the use of radar tracking data to evaluate airspace usage and integration. Sensitivity studies revealed that the use of radar tracking data only for large transport aircraft was not representative of the airspace usage by smaller aircraft, especially those that may operate from shorter runways or frequency conduct visual arrivals. Future work should expand this study to other categories of operators. Other areas of future work include a more detailed investigation of the airspace required to support missed approach
21
American Institute of Aeronautics and Astronautics
procedures. Additionally, the approach presented in this paper does not accurately accommodate trajectories that diverge in heading more than 90˚ from the centroid of the procedure. A different approach to handle widely diverging routes should be considered for future work. Finally, viable integration strategies for UAS or UAM operators is not simply about avoiding conflicts and meeting separation minima, but is also about adhering to requirements of existing flight equipment such as the Traffic Collision Avoidance System (TCAS). Future work may seek to combine TCAS restrictions with the available airspace identified through this paper to define potentially viable flight routes.
Acknowledgments
This material is based upon work supported by the National Aeronautics and Space Administration under contract NNL13AA08B. The authors would like to thank Nicolas Meijers, Jacquie Thomas, Mayara Condé Rocha Murça, Alison Yu, and Luke Jensen for their intellectual and material contributions to the development of this paper.
References
[1] Vascik, P. D., Balakrishnan, H., and Hansman, R. J., “Assessment of Air Traffic Control for Urban Air Mobility and Unmanned Systems,” 8th International Conference on Research in Air Transportation, Castelldefels, Barcelona, Spain: ICRAT, 2018.
[2] ICAO, “UTM – A Common Framework with Core Boundaries for Global Harmonization,” 2019.
[3] Locascio, D., Levy, M., Ravikumar, K., Briceno, S., German, B., and Mavris, D., “Evaluation of Concepts of Operations for On-Demand Package Delivery by Small Unmanned Aerial Systems,” 16th AIAA Aviation Technology, Integration,
and Operations Conference, AIAA, 2016, pp. 1–15, doi: 10.2514/6.2016-4371.
[4] Vascik, P. D., and Hansman, R. J., “Evaluation of Key Operational Constraints Affecting On-Demand Mobility for Aviation in the Los Angeles Basin: Ground Infrastructure, Air Traffic Control and Noise,” 17th AIAA Aviation
Technology, Integration, and Operations Conference, Denver, CO: AIAA, 2017, doi: 10.2514/6.2017-3084.
[5] Mueller, E. R., Kopardekar, P. H., and Goodrich, K. H., “Enabling Airspace Integration for High-Density On-Demand Mobility Operations,” 17th AIAA Aviation Technology, Integration, and Operations Conference, Denver, CO: AIAA, 2017, pp. 1–24, doi: 10.2514/6.2017-3086.
[6] Cho, J., and Yoon, Y., “How to assess the capacity of urban airspace: A topological approach using in and keep-out geofence,” Transportation Research Part C, vol. 92, 2018, pp. 137–149, doi: 10.1016/j.trc.2018.05.001.
[7] Ma, J., Delahaye, D., Sbihi, M., and Scala, P., “Integrated Optimization of Arrival, Departure, and Surface Operations,”
International Conference on Research in Air Transportation, Castelldefels, Barcelona, Spain: ICRAT, 2018.
[8] Vascik, P. D., Cho, J., Bulusu, V., and Polishchuk, V., “A Geometric Approach Towards Airspace Assessment for Emerging Operations,” Thirteenth USA/Europe Air Traffic Management Research and Development Seminar
(ATM2019), Vienna, Austria: 2019.
[9] Schaufele, R. D. J., and Lukacs, M., “FAA Aerospace Forecast: Fiscal Years 2019-2039,” 2019.
[10] Thomas, J., Yu, A., Li, C., Toscano, P. M. M., and Hansman, R. J., “Advanced Operational Procedure Design Concepts for Noise Abatement,” Thirteenth USA/Europe Air Traffic Management Research and Development Seminar
(ATM2019), Vienna, Austria: 2019.
[11] Federal Aviation Administration, “JO 7110.65W: Air Traffic Control,” 2015.
[12] Fitzek, R. A., “Lessons Gained in Helicopter Air Traffic Control from Federal Aviation Agency Activities,” Journal of
1 Ph.D. Candidate, ICAT, MIT, 77 Massachusetts Avenue, 33-115, Student Member, AIAA. 2 Professor of Aeronautics and Astronautics, MIT, 77 Massachusetts Avenue, 33-303, AIAA Fellow.
22
American Institute of Aeronautics and Astronautics
VII. Appendix A. Image of ASDE-X Radar Tracks Sorted by Runway Usage
(1a) – 37,000 BOS arrivals (1b) – 56,000 BOS departures
(2a) – 57,000 SFO arrivals (2b) – 46,000 SFO departures
(3a) – 99,000 ATL arrivals (3b) – 173,000 ATL departures
Figure 30. Large transport aircraft flights sorted by runway usage for 180 days of ASDE-X radar data. Flight tracks limited to 3000 ft AGL for visualization purposes.