HAL Id: tel-03230845
https://tel.archives-ouvertes.fr/tel-03230845
Submitted on 20 May 2021
HAL is a multi-disciplinary open access
archive for the deposit and dissemination of sci-entific research documents, whether they are pub-lished or not. The documents may come from teaching and research institutions in France or abroad, or from public or private research centers.
L’archive ouverte pluridisciplinaire HAL, est destinée au dépôt et à la diffusion de documents scientifiques de niveau recherche, publiés ou non, émanant des établissements d’enseignement et de recherche français ou étrangers, des laboratoires publics ou privés.
Machine Learning for the distributed and dynamic
management of a fleet of taxis and autonomous shuttles
Tatiana Babicheva
To cite this version:
Tatiana Babicheva. Machine Learning for the distributed and dynamic management of a fleet of taxis and autonomous shuttles. Networking and Internet Architecture [cs.NI]. Université Paris-Saclay, 2021. English. �NNT : 2021UPASG023�. �tel-03230845�
Thè
se de
doctorat
: 2021UP ASG023Machine Learning pour la gestion
distribuée et dynamique d’une flotte
de taxis et navettes autonomes
Machine Learning for the distributed and
dynamic management of a fleet of
autonomous taxis and shuttles
Thèse de doctorat de l’université Paris-Saclay
École doctorale n° 580, Sciences et Technologies de l’Information et de la Communication (STIC) Spécialité de doctorat : Informatique Unité de recherche : Université Paris-Saclay, UVSQ, Données et Algorithmes pour une ville intelligente et durable, 78035, Versailles, France. Référent : Université de Versailles Saint-Quentin-en-Yvelines
Thèse présentée et soutenue à Paris-Saclay, le 10 mars 2021, par
Tatiana Babicheva
Composition du jury
Jakob Puchinger Président Professeur des universités, CentraleSupélec
Alain Quilliot Rapporteur Professeur des Universités, Université Clermont
Au-vergne
Akka Zemmari Rapporteur MCF (HDR), Labri, Université de Bordeaux
René Mandiau Examinateur Professeur, LAMIH
Direction de la thèse
Leila Kloul Directrice de thèse Maître de Conférences, HDR, Université de Versailles
Saint-Quentin-en-Yvelines (UVSQ)
Dominique Barth Coencadrant Professeur, Resp., Université de Versailles
Saint-Quentin-en-Yvelines (UVSQ)
Wilco Burghout Coencadrant PhD, Director of Centre for traffic research, KTH Royal
In-stitute of Technology
Never send a human to do a machine’s job Agent Smith
In this era of digitalisation and smart technologies, the use of autonomous vehicles as a mode of transport is not a question of ’if’ but ’when’
Professor Chen Tsuhan
Neo. . . nobody has ever done this before. Trinity
I know. That’s why it’s going to work. Neo
Let’s see if you ... can do 90
Marty
Of course machines can’t think as people do. A machine is different from a person. Hence, they think differently. The interesting question is, just because
something thinks differently from you, does that mean it’s not thinking?
Alan Turing
I need your clothes, boots and your motorcycle
Abstract
In this thesis we investigate methods to manage electric autonomous taxi urban systems. We consider an online context in which customer demands occur over time, and where vehicles are available for ride-sharing and require electric recharging management. The goal of the investigated system is to satisfy the customers which require the taxi service. The problem belongs to the class of NP hard problems, thus, only heuristic solutions are possible. We propose the heuristics based on problem decomposition which include road network repartition and highlighting of subproblems such as charging management, empty vehicle redistribution and dynamic ride-sharing. The main methods used in these works are based on reinforcement learning.
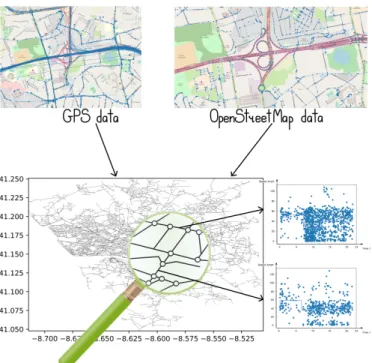
The first main contribution of the thesis is a set of precalculation tools. For this purpose, the methods of obtaining the exact network structure from GPS data of vehicle movements combined to OSM data are studied. The resulting graph, constructed from both OSM and GPS polyline data, allows obtaining velocity patterns on the arcs, which are the necessary components for aTaxi management. We propose methods of city graph partitioning and we provide a module for the graph covering based on this partitioning.
The second main contribution of the thesis is the development of heuristic methods for local optimi-sation problems. The set of new methods for empty vehicle redistribution is proposed, both proactive, meaning to take into account both current demand and anticipated future demand, in contrast to reactive methods, which act based on current demand only. One of the main methods uses indexing which is calculated from information on currently waiting passengers, predicted near-future demand and projected arrival of vehicles. The ride-sharing methods aim to identify passengers which can be grouped in one vehicle in order to serve more passengers using smaller fleet. For them, we provide a solution based on city partitioning.
The third main contribution is the reinforcement learning approach. We consider the learning at different levels depending on the targeted granularity of the system. The set of proposed solutions is designed for use in various transport networks. For example, for small networks we propose a station-based RL model, whereas for huge ones, we propose a zone-station-based RL model, where the agents are subzones of the city obtained by partitioning. The centralised models can show better performances in terms of execution time and stability. We provide also a complete information optimisation in order to analyse the system performances a-posteriori in offline optimisation.
The evaluation of the performances of the proposed methods is provided considering a set of road networks of different natures and sizes. The vehicle-based and station-based reinforcement learning methods, as well as heuristic and exact solutions, were compared on artificial networks of ring and grid structures. The methods for empty vehicle redistribution were compared on test cases in Saclay, France and in Stockholm, Sweden. We then evaluate the performances of zone-based reinforcement learning on a use case of the city of Porto, Portugal. The totality of the results show that proposed methods allow a better scalability and immediate functioning of the electric autonomous taxi system. On all the test cases, the proposed methods provide promising results outperforming the other tested methods and the real data on the taxi system performances in terms of the number of satisfied passengers under
fixed fleet size.
Keywords: autonomous vehicles, taxi management, traffic optimisation, reinforcement learning, empty vehicles redistribution, ride-sharing, electric vehicles.
Résumé
Dans cette thèse, nous étudions les méthodes de gestion des systèmes urbains de taxi autonomes électriques. Nous considérons un contexte en ligne dans lequel les requêtes des clients se produisent au fil du temps, et où les véhicules sont disponibles pour le covoiturage et nécessitent une gestion de la recharge électrique. Le but du système développé est de satisfaire les clients qui ont besoin d’un service de taxi. Le problème appartient à la classe des problèmes NP difficiles, ainsi, seules des solutions heuristiques sont possibles. Nous proposons des heuristiques basées sur la décomposition de problème qui inclue la répartition du réseau routier et la mise en évidence de sous-problèmes tels que la gestion de la charge, la redistribution des véhicules vides et le partage de trajet dynamique. Les principales méthodes utilisées dans ces travaux sont basées sur l’apprentissage par renforcement.
La première contribution principale de la thèse est un ensemble d’outils de précalcul. À cette fin, les méthodes d’obtention de la structure exacte du réseau à partir des données GPS des mouvements de véhicules combinées aux données OSM sont étudiées. Le graphe résultant, construit à partir de données de OSM et GPS, permet d’obtenir des modèles de vitesse sur les arcs, qui sont les composants nécessaires à la gestion des taxis autonomes. Nous proposons des méthodes de partitionnement de graphe de ville et nous fournissons un module de recouvrement de graphe basé sur ce partitionnement. La deuxième contribution principale de la thèse est le développement de méthodes heuristiques pour des problèmes locaux d’optimisation. L’ensemble des nouvelles méthodes de redistribution des véhicules vides est proposée, à la fois proactives, c’est-à-dire qui prennent en compte la demande actuelle et la demande future anticipée, contrairement aux méthodes réactives, qui agissent uniquement sur la demande actuelle. L’une des principales méthodes utilise l’indexation qui est calculée à partir d’informations sur les passagers actuellement en attente, la demande prévue dans un proche avenir et l’arrivée prévue des véhicules. Les méthodes de partage de trajet visent à identifier les passagers qui peuvent être regroupés dans un seul véhicule afin de servir plus de passagers en utilisant une flotte de taxis plus petite. Pour eux, nous proposons une solution basée sur le partitionnement de ville.
La troisième contribution principale est l’approche d’apprentissage par renforcement. Nous consid-érons l’apprentissage à différents niveaux en fonction de la granularité ciblée du système. L’ensemble des solutions proposées est conçu pour être utilisé dans différents réseaux de transport. Par exem-ple, pour les petits réseaux nous proposons un station-agent modèle RL, alors que pour les grands, nous proposons un zone-agent modèle RL, où les agents sont des zones de la ville obtenues par parti-tionnement. Les modèles centralisés peuvent montrer de meilleures performances en termes de temps d’exécution et de stabilité. Nous fournissons également une optimisation sous information complète afin d’analyser les performances du système a-posteriori en optimisation hors ligne.
L’évaluation des performances des méthodes proposées est fournie en considérant un ensemble de réseaux routiers de natures et de tailles différentes. Les méthodes d’apprentissage par renforcement basées sur véhicule et station, ainsi que des solutions heuristiques et exactes, ont été comparées sur des réseaux artificiels de structures en anneau et en grille. Les méthodes de redistribution des véhicules vides ont été comparées sur des cas de test à Saclay, France et à Stockholm, Suède. Nous évaluons ensuite les performances de l’apprentissage par renforcement par zone sur un cas de test de la ville
de Porto, au Portugal. L’ensemble des résultats montre que les méthodes proposées permettent une meilleure évolutivité et un fonctionnement immédiat du système de taxis autonomes électriques. Sur tous les cas de test, les méthodes proposées fournissent des résultats prometteurs surpassant les autres méthodes testées et les données réelles sur les performances du système de taxi en termes de nombre de passagers satisfaits sous une taille de flotte de taxis fixe.
Mots Clés : véhicules autonomes, gestion des taxis, optimisation du trafic, apprentissage par renforcement, redistribution des véhicules vides, partage de trajet, véhicules électriques.
Acknowledgements
First of all, I would like to thank my UVSQ supervisors Dominique Barth and Leïla Kloul, as well as VEDECOM supervisors Wilco Burghout and Hassan Mahdavi. Their guidance and ability to explain difficult concepts in easy words is the quality, which helped me through all my Ph.D. Their support of me during all these 3 years was inestimable. I am also grateful to my thesis reporters for reviewing my work. And, of course, I thank all the members of comity for accepting to evaluate my work.
The thesis is made in the collaboration with VEDECOM and is a part of the lot 2 of the MOB03 project (multimodal hubs) of VEDECOM that addresses the issue of managing a fleet of autonomous vehicles in the city’s infrastructure. Therefore, I would like to thank all my VEDECOM team of MOB03, currently, SYNTONIE, and my colleagues, part of whom become my good friends. I am grateful to Abhishek Jandial for his immense support through all good and bad days. I would also like to express my sincere gratitude to Toussaint Hoche, my table neighbour in both UVSQ and VEDECOM, for his help with my French and administrative problems, as well as for some inspiring conversations. I thank Bofei Chen, Maxime le Guilloux, Najeh Ikram, Maxime Redondin, Vincent Cagnard and Jaâfar Berrada for our discussions in our open-space.
I am grateful to the DAVID team of USVQ for their ambiance. I thank my M1 students who I taught algorithms on graphs, it was a real pleasure to teach you, even if it was in French.
I thank ASFR for the honor they provided to me by awarding me The French-Swedish Prize for young researchers in the PhD student category, as well as for the possibility to visit KTH Stockholm as a visiting researcher. I am grateful to Matej Cebecauer, Erik Jenelius and David Leffler, and other members of KTH Urban Mobility Group who provided me the data of Stockholm and inspired me to new ideas.
Also, I am grateful to all my friends with whom I spent a lot of joyful hours and days and who share my hobbies. I am immense grateful to my friends from ENS Cachan, Veronika Gavrilenko, Ekaterina Katia, Julien Christophe, and Adrien Ditrick, who helped me from my first days in France. I would like to thank Tatiana Shpakova, Vadim Kantorov, Ivan Mitrofanov, Elena Tverdokhlebova, Anna Saraikina, Ivan Novikov, my teammates in the intellectual game “What? Where? When?”. I thank my friends all over the world, and, of course, Rina Sheinkin, Maiia Botova, Alexander Kilianov, Alexander Digurov, Liia Sharafutdinova, and the family of Alena, Sergey and Evgeniia Logvinovs for their love and our long conversations. I am grateful for all the team of MIPT Olympiad School, and especially Ilya Mescherin, for their support. I thank my young future colleagues Sonia Soldatova, Sofia Sergeeva, Danila Zhabenko and Alexandre Capdevielle-Fidel for the inspiration they always give to me. I thank Natalia Kilianova for her help with beautiful pictures. And, of course, I am immense grateful to my co-author in the area of history mathematical modelling of traffic flows Ira Ulianova for our historic discussions and her poems.
I would also like to express my sincere gratitude to my parents who opened for me a wonderful world of mathematics and their faith in me. I say thank my brother Dmitry for all his brother care, force, and readiness to come to the rescue at any moment.
Last but not least, I am very grateful to my boyfriend Alexey Novoselov for his love and who was always there in easy and difficult times.
Contents
1 Introduction 1
1.1 Smart cities and smart transport . . . 1
1.2 aTaxi management issues . . . 2
1.3 Problem definition . . . 3
1.4 Contributions and thesis outline. . . 3
2 State-of-the-art 7 2.1 Introduction . . . 7
2.2 Existing approaches in transportation problems . . . 8
2.2.1 Customer preferences in transportation systems . . . 8
2.2.2 Electrical vehicle charging and discharging . . . 10
2.2.3 Empty vehicle redistribution . . . 11
2.2.4 Ride-sharing research. . . 14
2.2.5 Machine learning techniques in traffic optimisation . . . 18
2.3 Used methods and benchmarks . . . 25
2.3.1 Empty vehicle redistribution . . . 25
2.3.2 Dynamic ride-sharing . . . 26
2.3.3 Taxi management in complete information case . . . 28
2.4 Conclusion. . . 29
3 Modelling the electrical aTaxi system 31 3.1 Introduction . . . 31
3.2 System description and hypothesis . . . 31
3.2.1 Environment . . . 32
3.2.2 Passengers and demands . . . 32
3.2.3 Taxi system . . . 33
3.2.4 Objectives . . . 33
3.2.5 Hypothesis . . . 34
3.3 Static components of the model . . . 34
3.3.1 Environment . . . 34
3.3.2 Demand . . . 36
3.3.3 Vehicle. . . 36
3.4 Dynamic components of the model . . . 37
3.4.1 Environment . . . 37
3.4.2 Trips in the system . . . 37
3.4.3 Vehicle. . . 38
3.4.4 Client . . . 38
3.4.5 Trips from client and vehicle perspectives . . . 38
3.4.6 Client utilities. . . 39
3.5 Optimisation problem definitions . . . 43
3.5.2 Charging management problem . . . 43
3.5.3 Empty vehicle redistribution problem. . . 44
3.5.4 Dynamic ride-sharing problem. . . 44
3.6 Conclusion. . . 44
4 Functional architecture of aTaxi system management 47 4.1 Introduction . . . 47
4.2 Zone decomposition of road network graph . . . 47
4.2.1 Fill Clustering Method . . . 48
4.2.2 Spill Clustering Method . . . 49
4.3 Charging management . . . 51
4.3.1 Station empty slot probabilities . . . 51
4.3.2 Station location distributions . . . 52
4.3.3 Charging strategies . . . 52
4.4 Empty vehicle redistribution methods . . . 53
4.4.1 Empty vehicle redistribution without time windows . . . 53
4.4.2 Empty vehicle redistribution with time windows . . . 56
4.4.3 Comparison of empty vehicle redistribution methods . . . 57
4.5 Ride-sharing methods . . . 60
4.6 Zone-based Empty Vehicle Redistribution . . . 62
4.6.1 Surplus/deficit zone-based EVR. . . 63
4.6.2 Zone Index-Based EVR (IBR). . . 63
4.7 Conclusion. . . 63
5 Reinforcement learning for aTaxi system optimisation 65 5.1 Introduction . . . 65
5.2 Framework description and learning levels in the model. . . 66
5.3 Microlevel: vehicle-based and station-based decision models . . . 67
5.3.1 Vehicle behaviour in the system . . . 67
5.3.2 Vehicle-based learning algorithm . . . 70
5.3.3 Station-based reinforcement learning model . . . 73
5.3.4 Convergence. . . 74
5.4 Mesolevel: zone-based decision model . . . 75
5.4.1 Zone characteristics and actions. . . 76
5.4.2 Central system level . . . 76
5.4.3 Learning algorithm . . . 77
5.5 Macrolevel: centralised decision models . . . 80
5.5.1 Centralised Station-based model . . . 80
5.5.2 Centralised Zone-based model . . . 82
5.6 Complete information and the price of anarchy . . . 83
5.6.1 Exact method of system optimum search. . . 83
5.6.2 Heuristical method for system optimum search . . . 84
5.7 Conclusion. . . 85
6 Evaluation scenarii 87 6.1 Introduction . . . 87
6.2 Construction of a relevant consistent weighted city road graph . . . 88
6.2.1 Methodology . . . 89
6.2.2 Porto taxi data set analysis . . . 90
6.2.3 Building the Porto network . . . 91
6.3 Client generation . . . 94
6.5 Scenarii generation . . . 96 6.5.1 Ring network . . . 96 6.5.2 Grid network . . . 97 6.5.3 Saclay network . . . 97 6.5.4 Stockholm network . . . 98 6.5.5 Porto network. . . 100 6.6 Conclusion. . . 101
7 Numerical evaluation of aTaxi systems 103 7.1 Introduction . . . 103
7.2 Used methods and performance measures . . . 104
7.2.1 Performance measures . . . 105
7.3 Evaluation scenario 1: Ring network . . . 105
7.4 Evaluation scenario 2: Grid network . . . 106
7.4.1 Deterministic optimisation evaluation . . . 107
7.4.2 Station-based RL evaluation. . . 107
7.4.3 Vehicle-based RL evaluation . . . 110
7.4.4 Centralised station-based RL evaluation . . . 111
7.4.5 Complete information . . . 111
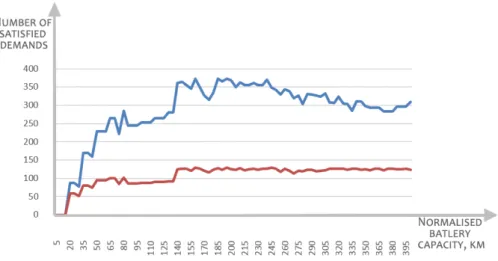
7.4.6 Fleet-size evaluation . . . 112
7.4.7 Summary . . . 113
7.5 Evaluation scenario 3: Saclay network . . . 113
7.5.1 Evaluation on the greedy mixed algorithms . . . 113
7.5.2 The matching problem . . . 118
7.5.3 Impact of ride-sharing . . . 118
7.5.4 Impact of vehicle fleet-size . . . 120
7.5.5 Generalised costs . . . 120
7.5.6 Summary . . . 121
7.6 Evaluation scenario 4: Stockholm network . . . 121
7.6.1 Stationary Poisson Process based Simulation . . . 122
7.6.2 Simulation on real demand data . . . 124
7.6.3 Summary . . . 125
7.7 Evaluation scenario 5. Porto network . . . 126
7.7.1 Zone decomposition . . . 126
7.7.2 Deterministic clients preferences . . . 127
7.7.3 Stochastic clients preferences . . . 131
7.7.4 Summary . . . 134
7.8 Conclusion. . . 134
8 Conclusion and discussion 135 Appendices 151 A Expended description and discussion of used methods . . . 152
A.1 Differential evolution . . . 152
A.2 Comparison of empty vehicle redistribution methods . . . 152
B OSM and GPS data analysis and processing . . . 155
B.1 Kaggle Porto GPS data set . . . 155
B.2 OSM data . . . 157
B.3 Mixed data usage . . . 158
C Scenarii evaluation . . . 159
C.1 Ring network. Additional results . . . 159
C.3 Saclay network. Additional results . . . 159
C.4 Stockholm network. Additional results . . . 160
D Abbreviations . . . 164
Chapter 1
Introduction
1.1 Smart cities and smart transport
According to WHO, half of the modern world’s population lives in cities. According to the UN forecast, by 2050, about 85 % of the world’s population will prefer an urban lifestyle [263]. Citizens will account for about 80 % of world GDP1. Rapid urbanization is a challenge for municipalities, which must create the conditions for the expected quality of life, especially in terms of comfort and safety. This is a very difficult task, because the urban infrastructure is already working with extreme load, and with the growth of the population of city agglomerations, there is a threat of its collapse. The concept of Smart City, which is one of the attempts to solve this challenge, is being widely discussed in the literature [45].
Smart city means the integration of information and communication technologies for the manage-ment of urban infrastructure: transport, education, healthcare, housing systems and security. The goal of a smart city is to improve the quality of life through the introduction of urban information technologies and increase the efficiency of meeting the needs of residents.
An unhealthy transportation system can transform a city from a comfortable living environment into a giant trap. Citizens will not be able to rely on timely medical care, firefighters will not have time to get to the fires on time, and utilities will no longer cope with emergencies. Transport collapse will paralyze the city’s economy, and the first companies to be hit will be fleets of public transport, cargo transportation and delivery services. Then the city suffocating in traffic jams and exhaust gases will finally become unsuitable for living.
One of the key tasks of the city authorities is the introduction of technological solutions to create a reserve capacity of transport infrastructure, taking into account the growing load. However, it is important not only to modernize and build new elements of the transport ecosystem, but also to effectively use existing ones.
Transport is changing in accordance with the requirements of the time and the trend towards universal digitalization. With the development of the Internet of Things (IoT) and the advent of smart cities, vehicles will not be able to do without an Internet connection. Connecting a smart vehicle to the network can be beneficial for city authorities. If they collect and use the accumulated data correctly, they will open up new opportunities for working and improving the transport situation in the city. These changes in transportation are referred to as to “smart mobility”.
Intelligent and environmentally friendly (electric) transport is one of the essential elements of smart mobility. The ride-sharing in its basis is a collective trip of several fellow travellers sharing expenses by private car. This movement exists now and has gained popularity due to the availability of mobile technologies. Through online applications, people find those who are with them along the way, for example, to work and even like-minded people to travel. Thus, people get to the right place with great comfort and unload roads and public transport.
Given the recent rapid development of self-driving (also called autonomous) vehicles, organising the ride-sharing will be simplified. Of course, the implementation of the car of the future requires a good software, machine vision, automotive sensors and other advanced systems. For the popularity of such a service among customers, it is important that it turns out to be more comfortable, faster and more economical than standard transport. In addition, autopilots have hopes to reduce accident mortality and improve transport safety.
1.2 aTaxi management issues
The objective of this thesis is concentrated around electric aTaxis2 development. More precisely, the goal is to design the reservation strategies allowing for a dynamic sharing of these vehicles by several customers. The basic idea of these strategies is to identify the customers whose requests can be grouped and assigned to the same vehicle while guaranteeing a certain quality of service.
In order of the formalisation of the research problem, the question is “what do we need to be able to evaluate the system?” This leads to the following first research issue. How do we define both the quality of service to be guaranteed to the customer in electrical aTaxi system and the quality of service for the system itself.
This issue leads to the need of customer profiles identification by recognising the patterns of tem-poral and spatial distributions of the runs made by autonomous vehicles from data collected in big cities (New York, Stockholm, ..). Customer demand can vary greatly from day to day and week to week. In addition, commuting can be very directional at specific times. These factors lead to an imbalance between the number of available vehicles in different regions. Thus, efficient service requires a redistribution of empty vehicles to match the supply of vehicles to passenger demand. Analysis of displacement data can improve statistical prediction of future displacement demands.
In order to provide the relevant mathematical and computational model, we need to formalise the environment of the taxi system. Thus, there is a need to represent and to generate consistent road network graph.
Autonomous vehicle reservation strategies rely on grouping and machine learning techniques with distributed agents (autonomous vehicles, potentially capable of exchanging information) and a cen-tralised system with knowledge of the environment. Depending on the required quality of service and locations of the vehicles, the system will propose to process the received customers requests according to its own utility. The strategies of all these actors will be refined through the use of automatic learning and prediction methods. This autonomous taxi system faces two major management problems: “Which vehicles to assign to which passengers?”, and “How to redistribute empty vehicles?”. Both problems are NP-hard. Therefore, classical optimisation methods are limited to heuristic or “greedy” solutions, especially for networks with big size and real structure. In addition, the electrical nature of the taxis leads to the question “How to model and manage the charging of the vehicles?”.
Evaluation of the gap between the user equilibrium and system optimum is another challenge. In order to deal with it, we should answer the question “Is it necessary to model the reservation management system at different levels?”, and, if yes, “Which levels should be investigated?”. The same gap reveals the optimisation problem in the case of complete information and expands it to the gap between global and local optimums. This leads to the question “How to evaluate the performance of the system in the approach of “price of anarchy””.
All these research questions should be addressed based on realistic scenarios in the context cited above.
1.3 Problem definition
This thesis addresses the issue of managing a fleet of autonomous vehicles in the city’s infrastructure. We consider an area such as city or city region with the stations of the transport system. The city offers a service of autonomous taxis and shuttles moving on a road infrastructure shared with other types of vehicles (public transport, vehicles with human driver). A set of parking spaces equipped with electric charging stations, accessible not only to autonomous taxis, but potentially to any electric vehicle, is spread throughout the region. The traffic is known or approximated by the global management system that interacts with all aTaxis.
This system will allow customers to book an autonomous vehicle, either in advance or on the fly (for a trip as soon as possible). The proposed route may be shared with other passengers or may require the client to walk a certain distance to get the taxi. The main objective of a transport operator offering aTaxi service is to efficiently use the available vehicles. The operator seeks to maximise effectively the quality of service while minimising total operational costs, which include reducing energy consumption, vehicle maintenance and other expenses.
The problem setting of the thesis is the following. Given the city or city region with all the structure and demand patterns, how to manage effectively the electric aTaxi system? Thus, given the certain level of quality of the service, how to determine the best strategies for the vehicles and the system to reach the user equilibrium and system optimum?
1.4 Contributions and thesis outline
The results presented in this thesis have diverse nature but are combined into a single framework. This thesis consists of 7 chapters.
Chapter 2 is dedicated to state-of-the-art. The focus is made on searching answers or approaches that exist in literature to our research questions, such as empty vehicle redistribution, ride-sharing, taxi charging and taxi system management. The state-of-the-art reveals the patterns in taxi systems and provides a justification of the chosen methodology. The main accent is made on machine learning approaches to different transportation modelling problems, including the taxi system simulation.
In Chapter 3 we describe the model of electrical aTaxi system and formulate the real-time aTaxi management problem. This problem highlights optimisation subproblems such as charging manage-ment, empty vehicle redistribution and dynamic ride-sharing.
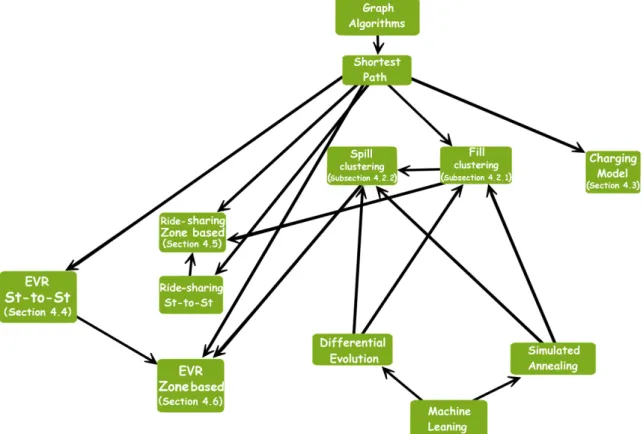
In Chapters4and5we present our management optimisation methods of the aTaxi system. These methods are based on the reinforcement learning and are provided at different levels, called micro (where agents are the vehicles), meso (where agents are the city zones, obtained by clustering), and macro (where the shared learning is between agents). These methods use different additional modules based on heuristics, which aim to provide improvements in the solution performance.
Chapter 6 is devoted to the evaluation scenarii description, including a new method of relevant weighted city road graph construction. This method is based on OpenStreetMap (OSM) network data and real vehicle movement GPS data sets together. We obtain a graph that combines strong points of both data types: the exact geographical structure of OSM data and the real movements of vehicles of GPS data. Then we describe clients and vehicles characteristics and generation patterns. The last sections of this chapter describe the networks and the scenarii to investigate further.
Chapter 7 is dedicated to the evaluation of proposed methods on scenarii proposed in Chapter
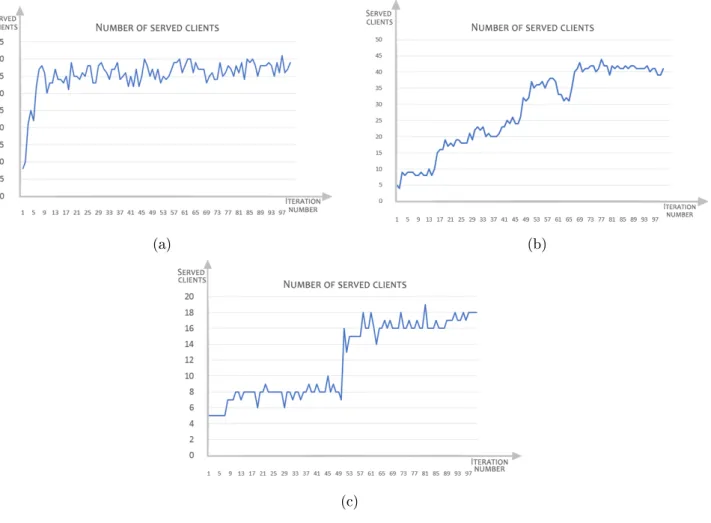
6. We provide the characteristics of the convergence and performances of proposed methods on five different networks. The methods based on clustering showed faster convergence and less computational complexity. We illustrate our findings using simulations on real and synthetic data, and classical benchmarks with many observations.
In Chapter 8we provide the thesis conclusion where we resume our contributions and explore some research perspectives. Part of the results provided in this thesis was published and presented in several journals, conferences and seminars.
Publications during the thesis
Published journal papers1. Tatiana Babicheva, Matej Cebecauer, Dominique Barth, Wilco Burghout, and Leïla Kloul. Empty Vehicle Redistribution with Time Windows in Autonomous Taxi Systems. ACM/IMS Transactions on Data Science, January 2021, Article No.: 5 https://doi.org/10.1145/3416915, 22 pages.
2. Tatiana Babicheva and Wilco Burghout (2019). Empty vehicle redistribution in autonomous taxi services. EURO Journal on Transportation and Logistics, 8(5), 745-767.
3. Tatiana Babicheva, Wilco Burghout, Ingmar Andreasson, and Nadege Faul (2018). The matching problem of empty vehicle redistribution in autonomous taxi systems. Procedia computer science, 130, 119-125.
4. Tatiana Babicheva, Wilco Burghout, Ingmar Andreasson, and Nadege Faul (2018). Empty vehicle redistribution and fleet size in autonomous taxi systems. IET Intelligent Transport Systems, 13(4), 677-682.
5. Matej Cebecauer, Wilco Burghout, Erik Jenelius, Tatiana Babicheva and David Leffler. Inte-grating Demand Responsive Services into Public Transport Disruption Management. IEEE Open Journal of Intelligent Transportation Systems, doi: 10.1109/OJITS.2021.3057221.
6. Tatiana Babicheva, Wilco Burghout, Ingmar Andreasson, Nadege Faul. ‘The matching prob-lem of empty vehicle redistribution in autonomous taxi systems (extended version). Special Issue in the International Journal of Traffic and Transportation Management (JTTM). doi: 10.5383/JTTM.01.01.001
International conferences
1. Tatiana Babicheva and Irina Ulianova.The history of mathematical modelling of traffic flows in the 1920-1970s. Kazan digital week - 2020, September 2020
2. Matej Cebecauer, Erik Jenelius, Tatiana Babicheva, David Leffler, and Wilco Burghout. Public Transport Disruption Management by Collaboration with Demand Responsive Services. Trans-portation Research Board 2020 Annual Meeting, Washington, D.C., January 12–16 2020
3. Tatiana Babicheva and Irina Ulianova. The history of mathematical modelling of traffic flows in the 1920-1970s. International Conference of Transport, Traffic and Mobility, Paris, Sorbonne, October 2019
4. Tatiana Babicheva, Wilco Burghout, Dominique Barth, and Leïla Kloul. Construction and anal-ysis of a weighted city road graph using OpenStreetMap and statistical GPS data. ITS World Congress, Eindhoven, June 2019
5. Tatiana Babicheva, Wilco Burghout, Ingmar Andreasson, and Nadège Faul. Empty vehicle redistribution and fleet-size in autonomous taxi systems. 25th ITS World Congress, Copenhagen, September 2018
Seminars and workshop talks
1. Tatiana Babicheva. Machine learning for the distributed and dynamic management of a fleet of taxis and autonomous shuttles. Journée de doctorants of VEDECOM, 10 October 2019
2. Tatiana Babicheva. Methods for the distributed and dynamic management of a fleet of au-tonomous taxis and shuttles. Interdisciplinary Research Program on Urban Mobility, September-October 2019, Université Paris-Saclay.
3. Tatiana Babicheva. Distributed and dynamic management of a fleet of autonomous taxis. The French-Swedish workshop on Smart cities and mobility, 11-12 June 2019
4. Tatiana Babicheva. Ridesharing and empty vehicle management in autonomous taxi systems. The Conference Scientifique Annuelle SMIV (Smart Mobility and Intelligent Vehicle), 27 Novem-ber 2018
5. Tatiana Babicheva. Machine learning for the distributed and dynamic management of a fleet of taxis and autonomous shuttles. Journée de doctorants of VEDECOM, 12 October 2018
Scientific visit and collaboration
Visit to KTH Stockholm granted by ASFR, Mai 2019.
Moderator of the section “ITS development in the World changing context”, Kazan digital week - 2020, September 2020
Participation in development of VIPSIM program in VEDECOM. Implementation of algorithms for the optimization of a fleet of autonomous taxis (redistribution of empty vehicles, ride-sharing).
Chapter 2
State-of-the-art
2.1 Introduction
Personal Rapid Transit (PRT) [108], also referred to as “podcars”, is an on-demand transportation system that uses a set of small driverless (and often electric) vehicles to transport people on demand from point to point (or station to station). Research within PRT [17] has traditionally assumed guideways (elevated or not) exclusively used by the PRT vehicles. Due to the construction cost of such guideways, as well as the rigidity of the available routes they provide, the world has seen only a handful of implementations of PRT services, e.g. Morgantown PRT [121] and Heathrow [169].
Given the recent rapid development of self-driving (also called autonomous) vehicles, the need for guideways is disappearing, as autonomous taxis will be able to use existing roadways, and thus provide door to door public transport services. In addition, the current trend towards “Transport as a service” (TAAS) [116] or “Mobility as a Service” (MAAS) [292] where cars (and bicycles, etc.) are shared using increasingly convenient on-line platforms, revolutionises the market for transportation of people and provides new ways to match planned and unplanned travel demands with transport services. Thus one can consider PRT and autonomous taxi services to be equivalent. An essential prerequisite for any such service is the efficient operation of the vehicle fleet, maximising the service to the passengers while minimising the cost to the operator(s).
Mathematical modelling, including computer simulation, can answer a significant number of ques-tions arising when optimising the traffic in PRT and autonomous taxi services. One of the ways to achieve this is to develop adequate mathematical models of the processes of interaction of vehicles with such transport infrastructure elements as the road network and traffic management systems. As a rule, models of this type belong to the class of imitation or micromodels, which combines cellular automata models, multiagent models, etc. The currently popular micromodelling algorithms require a significant number of computational operations. From this point of view, the development of macro-scopic models and algorithms for optimising transport processes, which, on the one hand, easily adapt to high-performance computing tools, and, on the other hand, would have reserves to reduce com-putational complexity, becomes urgent. To bring reserves to life it is required to solve yet unsolved modelling and optimisation problems of large dimension with more accessible computing facilities, as well as for the evaluation of certain processes in real time. It is especially important to find a solution of the optimisation problem which reduces the gap between user equilibrium and system optimum, and using well planned shared autonomous vehicles is the way to this.
In order to build a relevant model with all the characteristics required, a deep study of the methods already used in the literature is required.
To define the quality of service to be guaranteed to the customers, it is necessary to study the mathematical, economical and sociological models of passengers. Is it necessary to minimise the average passenger waiting time or the maximum waiting time? Can a passenger leave the system after obtaining the answer from the taxi service that he will need to wait more time than he would like? Are passengers
ready to walk some distance in order to leave earlier? Is a passenger ready to share his trip with other passengers, and if so, under what conditions?
To identify customer profiles by identifying the patterns of temporal and spatial distributions of the runs made by autonomous vehicles from big cities data, there is a need to examine what type of data the existing datasets contain, and whether this is enough for the problem setting. How to define customer profiles? Is the use of machine learning techniques already required at this stage, and, if so, which techniques for analysing such data are currently in use?
To model the reservation management system at several levels, or, more precisely, at the level of individual vehicles and at the level of a fully centralised system, we should determine the computational complexity of each of the subtasks. We should also understand whether exact solutions are possible, or heuristic solutions are required. Moreover, it is necessary to study which heuristic solutions are being proposed now, as well as for which size of the transport networks and with which characteristics they are applicable.
One important component in any taxi management system is the way in which vehicles are assigned to passengers and how they are redistributed in the network to provide an optimal service. In both PRT and autonomous taxi systems the service is demand-responsive, most passengers request immediate service and only part of trips are booked ahead of time. Perfect information about future requests is therefore not available, but statistical information about future requests may be predicted from historical data. In addition, the passenger demand is often asymmetric across the network and over time, causing imbalances in vehicle supply and passenger demand in the system. Therefore, it is necessary to redistribute empty vehicles based on demand and supply attributes to rebalance the system. To propose relocation strategies for empty vehicles to provide better service, it is required to study what techniques are currently used, and also to think out strategies based on classical heuristic methods, as well as on reinforcement learning.
The complex and interdisciplinary nature of the thesis objectives determines several different areas of the literature research.
Subsection 2.2.1 describes preferences of passengers. This part is core for a more accurate defini-tion of the model’s objective funcdefini-tions and for the understanding of expected quality of service nature. A small Subsection 2.2.2 dedicated to electrical vehicles is needful to model the charging strategies of vehicles. Subsection 2.2.3 is devoted to the empty vehicle redistribution methods. In the model without empty movement, the taxi will not depart to meet the passenger, that will not converge to an optimal solution. Even in classical problems with human drivers, the empty vehicle sending is essen-tial. The autonomous vehicles have less empty ride costs, and this leads to the fact that the research of the potential improvements is necessary. In Subsection 2.2.4 we consider the existing methods of ride-sharing in taxi systems. Systems with implemented ride-sharing can serve more passengers, and, especially in congested traffic condition, can help to obtain the optimum with fewer vehicles required. Subsection 2.2.5 is focused around the machine learning approaches to different transportation mod-elling problems, including the taxi system simulation. The review of the methods most commonly used nowadays is provided. Section 2.3discusses the directions and methods chosen in the thesis. Finally, Section2.4provides the conclusions to the state-of-the-art.
2.2 Existing approaches in transportation problems
2.2.1 Customer preferences in transportation systemsPeople in developed countries spend many hours of their life traveling to work and to home, and waiting taxis and trains. Thus it would be profitable to lessen this time. The time of consumer becomes one of goods to buy. The consumer follows the microeconomics rules to choose the transportation method, summarizing (or choosing another type of utility estimation) travel and waiting times to total cost of consuming good. This fact is often not to take into account, but the consumer would prefer to spend as less time in transportation as it is possible.
In the most economic models the goods are separated in categories of leisure, which add utility when consumed, and work, which is the source of income to purchase the goods to increase utility. There is trade-of between leisure and work: the more time is spent for work the less it is spent for leisure. For each individual it matters how to reassign the available time between leisure and work. In transport investments, the concept of “time value” (value of time, VOT) is widely used. Despite the fact that each action has its own value for an individual, when trying to model a group’s behaviour to determine estimates, difficulties arise: how to get the sources of individual distributions? They can be obtained as a result of population surveys (method of declared preferences), as well as through econometric models (method of revealed preferences, RP). None of these methods is perfect and the results of their use diverge from research to research.
Becker’s model [28] is classical and the time in his model is the main goal to optimize. He uses the VOT that is equal to the individual wage rate. Lisco [179] considers the value of transit time to be equal to the half of the individual wage rate. For Watters [280], this value is of 30 to 60 percents of the wage rate.
Utility function, developed by Johnson [135] uses work time, so the leisure time became different from other authors. Oort [206] proposes to include transportation time in his model where the working time increases when the travel time decreases. The travel time also has negative effect to utility function (he considers the travel time as some kind of unpleasant activity). Mohring et al. [199] introduce a passenger disutility as a linear function of time spent walking to and from bus stops and waiting there for service, and time spent actually travelling. For de Serpa [77], the utility function depends on activities and on goods. Evans [84] considers a utility function as function with arguments which are the times using in activities. Diaz [133] observes the fact that time now is considered to be as the main utility component and all activities lead to changes in the utility value. Thaithatkul et al. [260] describe ride-sharing system considering linear utility function depending on waiting time and travel time. Lenoir and Laplace [171] consider the price of the travelling time and the activities and conditions that can affect it. Schakenbos et al. [234] study the transfers in public transport, and show that the disutility during an interchange depends on travel time, the waiting time and the headway.
The results obtained using the RP data do not allow accurate calculation of general trends in people’s preferences due to the low accuracy of the data collected and the strong variation. Using Stated Choice (SC) data to determine the cost of time has been the standard since the mid-1980s. Since this type of survey allows to process more data and also to obtain preference patterns not only in waiting or travel times, but also in the type of used transport. Since the mid-1990s, algorithms have appeared that allow to correct and detect correlations in responses from each person, which reduced some of the advantages of using the SC data method, but still did not take away the palm from this method.
One of the limitations of the SC analysis [70] consists of the value of small time savings for common travels and the policy in eleven different countries. The authors considered utility difference linear on time and money. The paper addresses the issue of how small time savings are handled in the appraisal of transport proposals. The authors provide critical discussion of the treatment of small time changes that have been estimated in SC studies and conclude that there is a strong case for reconsidering the use of RP data.
When studies showing the VOT as being primarily based on an economic analysis of utility func-tions, the value of travel time changes (VTTC) (the monetary measure of the value that people attach to changes in travel time), uses at the same moment the psychological aspect of choice preferences. VTTC is a key factor in evaluating and comparing different transportation projects. Saving time on the road often constitutes a large part of the economic benefits of a project. Thus, overcoming a given constraint is crucial for cost-benefit analysis [277]. Several countries are conducting national studies to evaluate official VTTC, which can be used to assess and prioritise transport development projects. In design of the most of SC experiments the citizens choose between possible scenarii evaluating a time-cost trade-off [243]. Such methods were used, for example, in the Netherlands [262], Norway [85], the UK [187], Denmark [97], and Sweden [41].
In order for studies to be comparable, the relevant normalisation is to be provided. The corre-sponding values are provided by such authorities as “Commissariat général du plan” [40] in France or the department for transport in the UK. Algers et al. [7] describe the first Swedish national VOT study, which followed the methods used in the UK and Netherlands studies.
Work in the mid-1990s confirmed and quantified non-linearities in VOT and revealed the following non-linearities:
loss of time is more important for the subject than the acquisition;
the amount of time or cost savings relative to the total amount of time or money spent on a trip; small times have diminished VTTC;
there may be preferences for current time depart.
Subsequent studies with a more complex analysis of the responses about SC in general confirmed and corroborated these findings. However, the real question is whether or not the data obtained are correlated with reality. If they correlate, then how to take them into account? If not, what experiments and how to conduct, so that they correlate the results with reality? How to take these effects into account when evaluating a study?
Hultkranz and Mortazavi [130] use the Swedish data to reveal non-linearities of VOT. Börjesson and Eliasson [41] based on the data collected through two surveys carried out in 2007 and 2008 clearly show the non-linearity of the VTTS. Also, authors show that the commuting/school trips have around 30% higher VTTS than other private trips. Yang et al. [298] consider the Cobb–Douglas type production function of taxi–customer meetings considering the walking time and the taxi waiting time.
In the past decade, models based with error defined on the log time and log cost difference scale, and with value of time distributed randomly in the population are appeared. They are more diffi-cult to understand and implement in simulation, but for now they most fully explain all the effects. Multinomial logit models and more recent mixed logit models are also widely used to evaluate VTTC [41]. There is no clarity in literature yet in defining and classifying the main modelling approaches used for the data sets of the type described above. In general, the methods of parametric and non-parametric estimation are highlighted [205]. More informative parametric models allow the VTTC to vary depending on the covariates, which is significant in connection with the detected non-linearities. Basing on the national VTTC studies, two basic approaches can be highlighted. These parametric approaches, named Random Utility (RU) and Random Valuation (RV) differ in the random compo-nent belonging. In the RU it refers to the difference between the utilities of the trip options. In the RV it belongs to the difference between the proposed assessment threshold and the actual value of the cost of travel time, implied in changes in time and proposed cost. From the deterministic point of view, these approaches can be considered as equivalent and both can be deduced from standard microeconomic theory. The significance of the differences in them has not yet been clarified in modern literature and the approach is usually chosen empirically [97], [41], [129] or from the preferences of the authors. Classics in the discrete choice models Ben-Akiva and Bierlaire [32] develop the RU theory using the multinomial probability unit model. Authors consider, in addition to travel time, the other attributes such as path length, travel cost, transit specific, etc. Ojeda-Cabral, Batley, and Hess [205] focus on official national binary time/money trade-offs VTTC studies. Authors consider RU and RV approaches to analyse the VTTC at Danish and UK datasets with the conclusion that RU approach is likely to contain heteroscedastic error terms that need correction.
2.2.2 Electrical vehicle charging and discharging
Currently, three main types of electrical powered vehicles can be highlighted.
Battery Electric Vehicles (BEV) do not use any power sources than electrical power, obtained from batteries based onboard.
Hybrid Electric Vehicles (HEV) contain both electrical batteries and traditional gas engine (in-ternal combustion engine, ICE).
Plug-in Hybrid-Electric Vehicle (pHEV) is in many aspects similar to HEV except the fact the main power source is electricity. ICE is used only for charge batteries, but power outlets can be used. pHEV can work without using fuel at all if there is an power outlet in reach.
In this work, the Battery Electric Vehicles are considered.
EV charging performs by electric vehicle service equipment (EVSE). There are three main levels classified by charge rate and they uses respectively 120V for standard house outlets, and 240V and 480V for the special charging stations.
Total charging time greatly depends of many factors: batteries capacity, amount of required charge power, needed charging speed (if applicable). No many vehicles use charge cycles from 0% to 100%. Overnight charging usually recharge the batteries from 60-70% to 100%. “Dinner” charges usually compensate up to 1/3 of battery capacity.
Fetene et al. [94] analyse the driving range and investigate the factors affecting the energy con-sumption rate of fully-battery electric vehicles under real-world driving patterns accounting for weather condition, drivers’ characteristics, and road characteristics. Energy consumption rate was found to be equal to 0.168 kWh/km during the summer and 0.225 kWh/km during winter.
Hiermann et al. [122] consider linear discharging based on the travelled distance.
Schneider, Stenger and Goeke [235] study an E-VRP1with time windows and charging stations (E-VRPTW) that minimizes the total distance travelled by a homogenous EV fleet. The model considers the battery charging time to depend on the remaining battery level upon arriving at the charging station. The battery consumption in the article is a function of travel distance (travel speeds on arcs are assumed to be constant).
Erdogan and Miller-Hooks [83], Desaulniers et al. [76], Felipe et al. [93] present an E-VRP with multiple charging technologies and partial recharges. Again, the energy consumption in all the works mentioned considered to be a linear function of travelled distance.
Based on the literature research, in the optimisation problems with electrical vehicles the classical approach is to consider the linear with the distance discharging and linear with the time charging. 2.2.3 Empty vehicle redistribution
One of important issues mentioned before is the empty vehicle redistribution (relocation, reposition) problem (EVR problem) in PRT systems which can be formulated as a dynamic version of the Vehicle Routing Problem (VRP) which aims to find the optimal set of routes for a fleet of vehicles to traverse in order to deliver to a given set of customers [78]. In the VRP with time windows, the passengers need to be picked up at stations within defined time windows and/or delivered at their destination within given time windows. Both problems can be reduced to the Traveling Salesman Problem (TSP), and are therefore NP hard. As a result, most approaches in literature use heuristics rather than exact methods, to find acceptable solutions within reasonable time.
The methods for EVR can be divided into two main groups corresponding to two different problems. First group, reactive redistribution strategies, in which the call for a vehicle to be made at the moment of passenger arrival, are methods of reaction to demand. In such algorithms, an empty vehicle is to be sent in interests of particular passengers (the one with maximal waiting time, the one closest to the vehicle, etc). Second group, proactive redistribution strategies (sending empty vehicles in anticipation of predicted demand in the near future) is the empty vehicle redistribution in interests of all the system. In some PRT systems [121], two types of operations with another notation are used. In the demand mode of operation, there are no heuristics or knowledge of future demand, EVR is based only on the current demand, that makes the problem close to the dynamic problem. In the schedule mode of operation, there is information or strong heuristics about the future passenger demand, that makes the problem close to the static deterministic problem.
Kek, Cheu, and Chor [153] implement two staff-based relocation techniques called “shortest time” and “inventory balancing”. Shortest time relocation is based on calling an empty vehicle from the
nearest station (with the shortest time). Inventory balancing relocation calls vehicles to stations with fewer vehicles than necessary, assigning vehicles from stations with over-supply (surplus). The model is based on a “virtual station status”, which is the real number of vehicles in the station at this moment, plus weighed total number of vehicles scheduled for return to this station (for this time interval), minus the number of vehicles which are not available for use (because they have been reserved). When the “virtual station status” violates the threshold values for the station, a relocation request is issued.
Song and Earl [246] consider the problem of determining optimal EVR and fleet-sizing policies for a two-depot service system with Poisson arrivals and independent exponential random times needed for repositioning. Authors go on to minimize the sum of costs incurred by vehicle maintenance, EVR, and the leasing of vehicles.
Specialist in dynamic programming Powell [216,217] uses operator profit maximising as objective function.
Bruglieri, Colorniand, and Lue [46] propose the movement model for one-way electric car sharing EVR problem. It was believed that electric cars are able to pass a fixed distance on one battery which charges and discharges linearly (from time and traveled distance respectively). The objective function in this staff-based reallocation model represents the total number of satisfied requests.
Boyaci, Zografos, and Geroliminis [42] describe a model for the planning of electrical one-way non-floating reservation-based car-sharing systems, for both pick-up and drop-off. The objective function in this model is maximising the net revenue for the operator. The model has a high computational complexity and does not take into account any information on future arrivals.
Fagnant, Kockelman et al. [87,88,155] focus on shared autonomous vehicles’ mileage and environ-mental implications. Their EVR method is based on the nearest available vehicle and uses 2-dimension cellular automaton.
Hanna et al. [119] consider car-sharing with autonomous vehicles as a multi-agent system. This study is partially based on a work of Fagnant and Kockelman. The authors propose the “SCRAM” algorithm based on Huhn’s Hungarian algorithm [159] to minimise the maximum edge cost in a bipartite graph.
Anderson [12] proposes EVR based on operational experience, and a flow of empty vehicles can be started in anticipation of passenger arrivals. This model is based on centralised control EVR between nearest stations.
Fan, Machemehl, and Lownes [89] develop the dynamic vehicle allocation problem for car-sharing (DVAPC) solutions. The objective of proposed model is to maximise the total expected profits over a planning horizon of 𝑁 days under the condition of independent random future demands with a known distribution.
Bell and Wong [31] propose a reactive nearest neighbour (NN) algorithm for EVR. When a new passenger arrives, the proposed heuristic immediately selects a vehicle to serve him or her and adds the passenger to the list of ordered trips for that vehicle. It is assumed that the dispatcher knows the trip request probability for each OD2 pair and the average headway between requests.
Daszczuk et al. [72] propose a disaggregate redistribution algorithm based on inter-station data exchange, with the possibility of limiting the distance between communicating stations.
Lees-Miller [169] focuses on passenger waiting times in PRT systems. The SV (Sampling and Voting) [170] heuristic is based on the Dynamic VRP method. Each subtask that appears in the model is solved by a nearest neighbour algorithm and the best solution is chosen using a voting system. In [168], the author also uses the “longest-waiting passenger first” heuristic, comparing it with Bell and Wong’s nearest neighbours algorithm. It is shown that although the Bell and Wong method may saturate at higher demand intensity, the longest-waiting passenger algorithm may decrease queues and shorten waiting at lower demand.
Febbraro, Sacco, and Saeednia [92] develop car-sharing simulator with user-provided methods of EVR. In this method, the provider pays not for staff, but for users, and the total price for users decreases, possibly leading to the demand increase.
Kornhauser from Princeton Autonomous Vehicle Engineering [157, 158] focuses mostly on aTaxi systems. Zhu and Kornhauser [307] propose methods of city partitioning (called pixelisation). The passenger’s order will be served with a vehicle from the closest pixel. Under supervision of Kornhauser, Douglas [80] focuses on a model of shared aTaxi system for New Jersey. The EVR and fleet-sizing problems for an aTaxi system tackle both deterministic and stochastic demands. The objective is to find the policy that minimises the expectation of the sum of travel costs of sending all dispatched empty vehicles to their destinations and a “lateness penalty” for all “departure units” that were scheduled to dispatch before the decision time, but have not yet departed. In this model, lateness penalties are assigned to “departure groups” proportional to time but independent of the number of passengers in each “departure unit”. Gladstone, under supervision of Kornhauser, also proposes a solution based on the pixelisation of network. Every 30 minutes the model performs check if it is optimal for each empty vehicle to be repositioned. If so, the vehicle would move one pixel toward the optimal direction. Thus, this method is not relevant to the significant one-dimension flow during the rush hour. The ride-sharing strategy provides multiple stops with limits on detours, but the picking up at intermediate stops is not considered. Thus, the maximal vehicle occupancy for Manhattan, New York, was always less than 1.7. Fatnassi et al. [90,91] introduce the “battery restricted” PRT problem with empty-run minimising as the objective function [12]. The strategy assigns vehicles to passenger requests in real time without knowing the expectancy of next request. The authors propose four reactive strategies for vehicle movements as follows.
First-come, first-served (FCFS). The available vehicle serves the passenger with maximum waiting time disregarding distance.
Nearest neighbour (NN) from the vehicle perspective. Each vehicle serves the passenger from the closest station.
Wait, then go (WG). After serving a passenger request, a vehicle will wait in its station for more passengers for a given time. If no trip request happens within this time period, the vehicle will serve its nearest passenger request based on the NN strategy.
Fixed number of vehicles in station (FNVS). In every station there should be a fixed number of waiting vehicles. As soon as a station has a deficit of waiting vehicles, the nearest waiting vehicle from a station with vehicle surplus will be sent to this station.
The algorithms were evaluated on a number of randomly generated PRT networks. The evaluation is done based on empty versus effective (loaded) vehicle movements, as well as average passenger waiting times. The authors find that the WG outperforms the other algorithms in every aspect, although the Nearest Neighbour shows very similar results.
Van der Heijden et al. [266] use a repository of requests (including future requests if any), empty vehicles, and occupied vehicles expected freeing. They evaluate the following algorithms based on the empty vehicle mileage produced: a) FCFS algorithm; b) a look-ahead algorithm anticipating known near-future demand; c) a hierarchical model that combines global and local empty vehicle managers; d) integral planning algorithm improving on c) by considering all requests and empty vehicle trips together.
Beaujon and Turnquist [27] identify interactions between fleet-sizing and levels of fleet utilisation throughout the time period over which EVR decisions are made. This model assumes static demand and has a profit maximisation as an objective.
Andréasson [16,15,14,13] implements and evaluates reactive and proactive redistribution strategies for large networks with ride-sharing. The studies are mostly focused on high passenger loads close to the maximum capacity of the vehicle fleet-size and network. The objectives are to minimise the passenger waiting times (average and maximum) and the number of unserved passengers at the end of the simulated period. At frequent intervals all empty vehicles in stations or on links (called or sent) are reallocated (exchanging destinations between vehicles) with priority given to serving the longest waiting passenger.
Maciejewski et al. [186] evaluate a reactive nearest-idle-vehicle (nearest neighbour) algorithm as well as a proactive demand-supply balancing algorithm. Their findings indicate that for low passenger
demand the algorithms show similar results, but for high demand scenarios the balancing algorithm outperforms the nearest-idle-vehicle algorithm.
2.2.4 Ride-sharing research
The impact of vehicles on the environment is one of hot issues in modern world. The introduction of ride-sharing can not only expect to diminish traffic jams and therefore to decrease the passengers’ travel times, but also can decrease total vehicle run times and extra stops on the way. The most closely related routing problem to ride-sharing is the PDP3 that are known to be NP-hard. Ride-sharing can be modeled as a one-to-one PDP. The E-VRP-RS (Electrical vehicle routing problem with ride-sharing) can be also considered as an extension of the vehicle routing problem with multiple depots (MDVRP), which requires different vehicles leaving from and returning to different locations. Since the VRPs are proved to be NP-hard, the PDPs are known to be NP-hard, thus, new methods of heuristic solutions have to be developed.
Furuhata et al. [105] propose a classification according to the different aspects of the existing ride-sharing systems, which includes the following 6 classes according to the various criteria identified. Dynamic real-time ride-sharing provides the matching between drivers and passengers in real time (en-route). The matching agencies provide strategies for routing, scheduling, and pricing. Carpooling provides more predicted matchings, such as regular trips with similar OD-pairs.
Long-distance ride-match provides more flexible departure time and OD pair, however, comparable with the trip length.
One-shot ride-match is a hybrid of carpooling and long-distance ride-match.
Bulletin-board is a board-based ride-sharing, where ride-sharing conditions are determined by ne-gotiation among the participants.
Flexible carpooling is a semi-organized service, i.e., usually does not use any matching agency. In such a service, the spontaneous ride-sharing is formed based on a first-come first-service basis at the meeting points.
Authors identify three major challenges for ride-sharing services: design of attractive mechanisms (pricing, incentives), proper ride arrangement (user profile information, multi-hop rides), and building of trust among travelers in online systems.
Amey, Attanucci and Mishalani [11] focus on different challenges occurred with the dynamic ride-sharing appearance. There are economic challenges; social/behavioral challenges; institutional chal-lenges; technological challenges.
The psychological and environmental challenges are widely discussed in the literature. Merat, Madigan and Nordhoff [195] focus on social and psychological factors of the ride-sharing for automated vehicles and consider users’ motivation to use the AV and the ride-sharing depending of various factors. Epperson [82] examines people attracting methods including price policies to ride-sharing systems in order to reach a critical mass. Levofsky and Greenberg [173] provide a research of the ride-sharing systems existed 15 years ago with the reasons of failure or success. Deakin, Frick and Shively [74] report that most people prefer anonymous locations (for example, parking lots, major intersections) rather than giving away their precise start and destination points. Chan and Shaheen [58] focus on historical and psychological points of view about the ride-sharing in mostly the north America. Murray and Steele [202] propose the system and method for facilitating and encouraging ride-sharing basing on awards. Bistaffa et al. [39] concentrate on so-called social ride-sharing with the following approach. Given the desired starting point and destination and the time windows of the commuters, they can form groups that share cars to lower associated transportation costs (i.e., travel time and fuel), while considering the constraints imposed by the social network. Kamar and Horvitz [145] consider challenges with coordination among self-interested people aimed at minimizing the cost of transportation and the impact of travel on the environment. The two ride-sharing optimisations in the article are: (1) generating ride-share plans for groups of agents and (2) clustering agents into ride-share