READ THESE TERMS AND CONDITIONS CAREFULLY BEFORE USING THIS WEBSITE. https://nrc-publications.canada.ca/eng/copyright
Vous avez des questions? Nous pouvons vous aider. Pour communiquer directement avec un auteur, consultez la première page de la revue dans laquelle son article a été publié afin de trouver ses coordonnées. Si vous n’arrivez pas à les repérer, communiquez avec nous à PublicationsArchive-ArchivesPublications@nrc-cnrc.gc.ca.
Questions? Contact the NRC Publications Archive team at
PublicationsArchive-ArchivesPublications@nrc-cnrc.gc.ca. If you wish to email the authors directly, please see the first page of the publication for their contact information.
NRC Publications Archive
Archives des publications du CNRC
This publication could be one of several versions: author’s original, accepted manuscript or the publisher’s version. / La version de cette publication peut être l’une des suivantes : la version prépublication de l’auteur, la version acceptée du manuscrit ou la version de l’éditeur.
Access and use of this website and the material on it are subject to the Terms and Conditions set forth at
Snow loads on multi-level flat roofs in Canada
Taylor, D. A.
https://publications-cnrc.canada.ca/fra/droits
L’accès à ce site Web et l’utilisation de son contenu sont assujettis aux conditions présentées dans le site LISEZ CES CONDITIONS ATTENTIVEMENT AVANT D’UTILISER CE SITE WEB.
NRC Publications Record / Notice d'Archives des publications de CNRC: https://nrc-publications.canada.ca/eng/view/object/?id=4c6fbc51-7d54-4ee1-a580-6010d0f294eb https://publications-cnrc.canada.ca/fra/voir/objet/?id=4c6fbc51-7d54-4ee1-a580-6010d0f294eb
ABSTRACT
Between 1967 and 1982, d e p t h s and s p e c i f i c g r a v i t i e s of snow were r e c o r d e d on o v e r 40 m u l t i - l e v e l f l a t - r o o f e d b u i l d i n g s between H a l i f a x and Edmonton. The a v e r a g e s p e c i f i c g r a v i t y of snow i n t h e d r i f t s where t h e r o o f s change e l e v a t i o n was a b o u t
0.3, some 25% h i g h e r t h a n t h e d e s i g n v a l u e .
The p a p e r p r e s e n t s a v e r a g e and maximum roof-to-ground l o a d r a t i o s f o r u p p e r r o o f s and lower r o o f s away from t h e d r i f t s . These compare f a v o u r a b l y w i t h t h o s e recommended i n t h e 1985 N a t i o n a l B u i l d i n g Code of Canada (NBC). Data on maximum snow l o a d s i n t h e d r i f t s and on t h e geometry of t h e d r i f t s i s
p r e s e n t e d and compared t o p r o v i s i o n s i n t h e NBC. The s t a t i s t i c a l v a r i a b i l i t y of snow l o a d s and s p e c i f i c g r a v i t i e s i s d i s c u s s e d a s i t i s r e q u i r e d t o e s t a b l i s h l o a d f a c t o r s used f o r L i m i t S t a t e s Design i n t h e NBC. E n t r e 1967 e t 1982, on a mesure l a h a u t e u r e t l a d e n s i t e d e l a n e i g e s u r p l u s d e 40 b a t i m e n t s 3 t o i t u r e - t e r r a s s e r e p a r t i s d e H a l i f a x 3 Edmonton. La d e n s i t e moyenne d e l a n e i g e d a n s l e s - - - - a a c c u m u l a t i o n s c o r r e s - - -
-
h - l l t e u r d e s t o i t s B t a i t d ' e n v i r c s r d e c a l c u l . C e t t e e t u d e p r g s e n t maximum pour l e s t z o n e s d ' a c c u m u l a t f avorablement 3 c 1985 du Code n a t i c h a r g e s maximales v e n t e t s u r l a l c e l l e s du CNB. Li e t d e s d e n s i t e s c o n n a P t r e pour dZ d a n s l e CNB pour s e t d e s '!en t iion l e s : l e sa
c i g e 1 a L S ~ SSNOW LOADS ON MULTI-LEVEL FLAT ROOFS IN CANADA by
Donald A. Taylor
I
INTRODUCTIONI The drift which forms on the lower roof at the change in elevation of two flat roofs is approximately triangular in cross-section (Figure 1). Such drifts are of sufficient size I
and weight, exceeding the normal uniformly distributed snow loads on roofs, that they must be properly accounted for in structural design.
/'-
S E P A R A T I O N B U B B L E
IFigure 1. Wind flow patterns over roof showing separation bubble.
Building codes and standards such as the National Building Code of Canada (NBC 1985) and its Commentary on Snow Loads (1985), the American National Standards Institute's A58.1
(1982) and The International Standards Organization's ISO-4355 (1981) have had special requirements for such drifts for some time. These code provisions were based, however, more on the engineering judgement of members of the code committees than on measurements on roofs. Research has been conducted in the last two decades to establish whether the code provisions in use are appropriate.
I
In 1956 the Division of Building Research (DBR), now the Institute for Research in Construction, of the National Research Council of Canada started a country-wide survey of snow on roofs. Many roof shapes, including gables, sheds, arches and single- and two-level flat roofs were observed for ten winters, and others were observed on a case history basis, whenever especially deep snow was encountered. As a result of this early research, average design snow loads in the National Building Code of Canada were reduced, saving rcillions of dollars annually. As well, specific information on snow loads due to drifting was included in the Code, and in the first NBC Commentary on Snow Loads in 1965.SURVEY OF SINGLE- AND MULTI-LEVEL FLAT ROOFS
In 1967 DBR started a survey of single- and multi-level flat-roofed buildings (industrial, commercial and school). Buildings at eight locations across Canada were
observed, some for two or three years; at five locations (including Arvida, near Chicoutimi, Quebec), observations were conducted for longer periods:
...
Halifax 13 winters...
Arvida 12...
Ottawa 15...
Saskatoon 13...
Edmonton 11Presented at the Western Snow Conference, Vancouver, April 1987.
Institute for Research in Construction, National Research Council of Canada, Montreal Road, Ottawa, Ontario, KIA 0R6.
As it was difficult to find roofs of simple plan and cross-section in some cities, flat roofs typical of those in the area were observed and were used to check that, indeed, the results obtained from the 'standard' roofs were generally applicable. A 'standard' roof is a single-level roof on an isolated building 4 to 10 m high and at least 20 by 20 m in plan or, a two-level roof on an isolated building where the upper roof is from 6 to 8 m high, at least 20 by 20 m in plan and is upwind of the lower roof during snowstorms; the lower roof is 2 to 4 m lower, the same width as the upper roof and at least 10 m long, measured parallel to the wind direction, to give room for a full drift.
Formation of drifts
The process of drift formation has been described in a previous paper (Taylor 1984). When wind encounters a sharp-edged building obstructing its flow, a large separation bubble forms at the upstream or windward edge of the roof, as shown in Figure 1. Snow that lands in the bubble area or that was deposited there before the wind started, is carried upstream if the velocity is sufficiently high. The flow over the bubble attaches itself to the roof surface further along (if the roof is long enough) and snow landing in the region of
reattached flow is carried downstream by turbulent diffusion (Isyumov 1971). It is finally deposited in the region of the low speed wake, below the upper roof. If, however, the upper roof is too short, the separation bubble will be too large for reattachment of the flow, the snow will be dispersed and little will be deposited in a drift on the lower roof. Drifts that do form on roofs are shaped and reshaped by winds blowing from many directions during and after storms, although eventually sun, wind, rain and high temperatures will "set" the surface of the snow, largely preventing further erosion.
Except in unusual circumstances, ground snow does not blow onto a roof in significant quantities unless the wind is of sufficient speed and duration to cause a ramp-like drift
(Figure 2) at the upstream wall, allowing snow to travel up the ramp to the roof (Taylor 1979, Templin and Schriever 1982).
Figure 2. Snow drifts on roof. A drift may form on the windward side of the building which acts as a ramp for ground snow to gain access to the roof.
Measurements of Depths and Densities
When the survey was started in 1967, snow density was measured by digging a trench down to the roof surface and sampling horizontally, in the face of the trench, with an 86 mm long tubular sampler of 250 ml volume. After 1977, a vertical tube sampler, MSC type 1, one metre in length and 70 mm in diameter was used. A trench was still required to allow
insertion of a plate at the roof surface to protect it from the sharp teeth of the sampler. Then the sampler was carefully screwed vertically down through the snow and ice layers until it reached the protective plate. The sample was weighed in the tube and discarded.
Adjustments were made for the water and slush often found under the snow at the roof surface (which could not be picked up in the sampler), and an effective density corresponding to the computed load and the measured depth was also recorded. In deeper snow there was less contribution to increased density from the slush and water.
Because snow is a good insulator, and all the buildings were heated, the O°C isocline moved up from the insulation in the roof to the roof-snow interface and beyond, causing melting. On some flat roofs the drains were not at the lowest point of the deflected spans and were not effective in carrying away the meltwater, while on others, though it was dry near the drains, water was observed some distance away. On some roofs the warm drain had evidently melted the insulating snow co7er. Ice built up in a ring, around the drain but some distance away from it, effectively damming up the water under the snow cover.
Depth measurements were made with a metrestick. Sampling of depths and densities was done after major snowstorms or at monthly intervals if at least 15 cm of snow were present on the roof. Equivalent measurements were made of ground snow on the same day. Although sampling of depths was relatively easy, even when there was ice at the roof surface, density
I measurements were often difficult and time consuming. There are therefore many more depth
than density measurements in this survey data. As a result, densities were estimated from I
the density data set in order to compute loads at points where only depths were measured. RESULTS FROM THE SURVEY
Roof Snow Densities
As the main reason for conducting research on snow loading on roofs is to contribute to improved design requirements in the National Building Code of Canada and its Commentary on Snow Loads, it is important to use data, where possible, that correspond to heavy snow loads similar to those used in design. Therefore each of the roof densities recorded at Halifax, Arvida, Ottawa, Saskatoon and Edmonton was plotted (Figure 3 ) as specific gravity
1 1 1 1 1 1 1 1 1 1 [ I I I I l I I I 1 1 1 1 1 1 0 E D M O N T O N * S A S K A T O O N - O T T A W A t A A R V I D A
-
0 H A L I F A X - - A+ --
m * I l l l l l l l l l l l l l l l l l l I I I I I I , L O A D/
S oFigure 3. Graph of effective specific gravity of snow on the roof versus the snow load at the same point. The load and effective specific gravity both include the effect of ice and slush.
(SG) versus the corresponding roof load at the time. Each load was divided by the 30-year MRI (mean recurrence interval) ground load ( So) for that city. These SO values were: Halifax 2.2 kPa, Arvida 3.6 kPa, Ottawa 2.9 kPa, and Saskatoon and Edmonton 1.5 kPa. It is apparent that for the design of the upper and lower roof areas away from the drifts, i.e. areas where the design load will be between 0.6 So and 0.8 S O , the average specific gravity for the five cities will be approximately 0.3. This is also about the value indicated for snow in drifts, even drifts up to 3.3 SO. In contrast, the 1985 NBC Commentary on Snow Loads recommends a value of 0.245, some 18% lower.
Loads on Upper Roofs and on Lower Roofs away from the Drifts
The lower roof, in this context, is the part of the lower roof outside the drift area. The maximum loads cover, for the most part, an area on the roof about 6 m by 6 m. That is
large enough to be the tributary or design area for roof decking, purlins, and (depending on their spans), even beams and joists. The average loads cover larger areas and affect
girders and major trusses.
The largest value for each of the load and the maximum average load for the total years of observation were extracted from the data set for each drift location. As some roofs were multi-level, data exist for 56 drift locations on the 44 roofs observed. The histograms in Figures 4 and 5, which appear to be approximately lognormal in shape, were
-
n
=4 6
M A X I M U M A V E R A G E L O A D-
I 40.4 80.9-
*-
95.7 2.1 97.9 100 I I 1 M A X I M U M L O A D4
U P P E R R O O F L O A D
S o
Figure 4. Histograms of maximum average loads and maximum loads on upper roofs. Figures within bars are cumulative frequencies, i-e., 87.0% of upper roofs had maximum loads less than 0.6 SO.
plotted using these values, again divided by SO. It is not the aim of this paper to
describe the statistical analysis of the data; the histograms simply indicate that the data collected in this survey support the basic design loads recommended in the NBC (19851, IS0
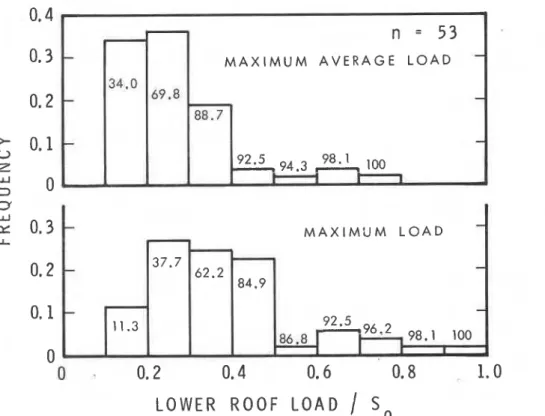
(1981) and ANSI (1982). The values marked in each bar of the histogram are the cumulative percentage of roofs having loads below the maximum class limit for each interval. For example, 87.0% of the upper roofs (Figure 4 ) had maximum loads less than 0.6 SO, the value probably used for their design, and 97.9% had maximum average loads less than 0.6 SO. In comparison, Figure 5 shows that 86.8% of lower. roofs sustained maximum loads less than 0.6 So and 94.3% carried maximum average loads less than 0.6 SO.
Wind tunnel modelling of the deposition of snow on buildings by da Matha Sant'Anna at NRC's Institute for Research in Construction indicated that the height (Hu) of the upper roof above grade was an important parameter. As well, O'Rourke and Wood's (1986) parametric study of roof loads by regression analysis confirms a correlation of maximum drift load with
Hu. Figure 6 shows that the maximum loads and the largest average loads on the upper (windward) roof are also a function of Hu. The curves drawn as an upper envelope to the data indicate that above a limiting Hu of about 5 to 6 m, the load on the upper roof
decreases as the building gets taller. Beyond about 13 m the load stops decreasing. On the other hand, the load on the lower roof (not shown) does the opposite, increasing for Hu between about 6 and 13 m and stabilizing at approximately 13 m.
n
=5 3
-
M A X I M U M AVERAGE LOAD-
34.0 69.8 - - 88.7,-
-
0.2
0.4
0.6
0.8
1.0
L O W E R
R O O F L O A D
/
S o
Figure 5. Histograms of maximum average loads and maximum loads on lower roofs (away from drifts). Figures in bars are cumulative frequencies, i.e., 94.3% of roofs have maximum average loads less than 0.6 S O .
-
M A X I M U M LOAD-
3 7 . 7 - 62.2-
84.9-
-
11.3 86.8 1Figure 6. Variation of maximum load and maximum average load on the upper roof with
Drift Loadins
Most drift shapes were approximately triangular, like those assumed in building codes (Figure 1). How do the maximum loads, at the apex of the triangle, compare with those calculated using the 1985 NBC Commentary? A histogram showing the comparison is plotted in Figure 7, with the cumulative distribution indicated as in Figures 4 and 5. Only 87.5% of
MAX. DRIFT LOAD
/
NBC
DRIFT LOAD
Figure 7. Histogram of ratio of maximum measured drift load to that calculated using the 1985 National Building Code of Canada (SG = 0.245). Figures within bars are cumulative frequencies, i.e., 87.5% of maximum drifts were less than the
1985 NBC drift load.
maxima were less than recommended values, mainly because of the low roof snow density
suggested in the Commentary. This would increase to 96.4% if a specific gravity of 0.3 were used to compute the recommended loads. The remaining 3.6% represents two roofs in Ottawa, and the excess of maximum load over NBC load was only 9.5% in one case and 11% in the other. As well, in the entire survey, there was only one case where the maximum load at the apex of the triangle was greater than the limiting value of 3.0 So recommended in the Commentary. This is the 11% case just noted, and the load was 3.3 SO. Snow in this drift had a specific gravity of 0.35!
More serious consideration is due the recommended "triangular" drift shape. As shown in Figure 8, for a number of years drifts on one roof at Arvida exceeded the NBC triangular volume, though their maxima, at the apex, were less than NBC values. Taylor (1984) showed an example of severe overload due to such a drift on a roof in Ottawa. That roof had a relatively small difference in levels (2.13 m), and the diagnosis was that a small drift volume would be quickly filled, even overfilled in some snowstorms. At Arvida the 'problem' roof (Figure 8 ) had a difference in elevation of 2.75 m, and -for the amount of snow that falls there (So = 3.6 kPa), this drift could also be quickly overfilled for the critical wind direction. The overloads in both these cases would drop if the NBC snow density were increased as suggested, but not to levels that could be ignored.
HE I GHT D I FFERENCE
=2.75
m
- \ \-
\-
-
I I I I I I I I I 1 1D I S T A N C E F R O M W A L L ,
m
Figure 8. Drift load profiles for roof at Arvida with loads frequently exceeding 1985 NBC
loads.
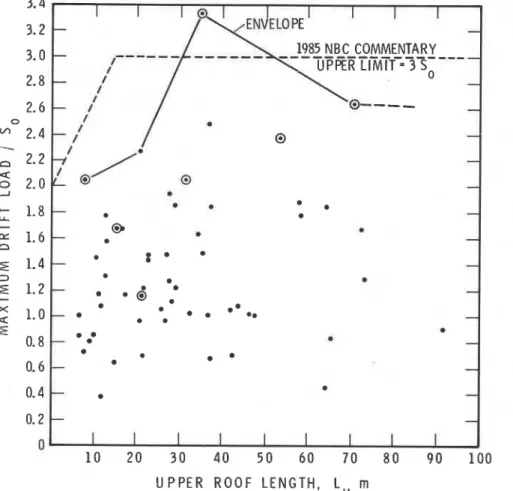
In a preliminary analysis, maximum drift loads were plotted against Lu, Hu, and area of upper roof. The graphs had similar large scatter. One of these, maximum load vs Lu, is shown in Figure 9. There appears to be little correlation between maximum load and Lu. This was unexpected because, as noted before, others have found a correlation. The lack of correlation may be because of the orientation of each roof to the prevailing snow bearing winds. Since Lu was chosen as the length of the upper roof adjacent to the drift location, only winds blowing in the same direction as Lu was measured (at right angles to the edge where the upper roof joins the lower), and from the high roof to the low, would give the biggest drifts. If the prevailing winds came from other directions, the drift could be quite small. Indeed the length of the upper roof would be almost irrelevant if, for example, the wind blew across the lower roof towards the upper. Clearly, a very careful perusal of wind records from climate stations is required. Figure 9 is useful for
discussion purposes; an upper envelope curve (solid line) is compared to the relationship
suggested in the NBC (dashed line). When the length of the upper roof (t) is almost zero,
the upper roof is like a parapet; as such it collects drifts up to 2.0 So (NBC value) in its
lee, depending on its height. As Lu increases to about 15 m, the recommended maximum of the
drift also increasestto 3.0 SO, and remains invariant thereafter. The survey results
indicate that for Lu less than 15 m, or even as large as 20 m, drifts greater than 2.0 SO
did not develop. The scatter in Figure 9, and in other graphs not shown, indicate that a multiple regression analysis like that by O'Rourke and Wood (1986) might be in order. Such would include geometric parameters and climate parameters such as wind direction, duration, speed and snowfall rate and duration.
ENJELO
PE 1985 NBC COMMENTARY---
"---
I UPPER L I M I T = 3 So f / f I 0---'
i
U P P E R R O O F LENGTH, L,, mFigure 9. Graph of maximum drift load versus length of upper roof. The values circled are greater than 1985 NBC values.
VARIABILITY OF SNOW LOADS AND DENSITY
Roof snow loads tend to be highly variable from one year to the next. The average coefficient of variation of maximum annual loads on upper and lower roofs is about 0.5, and of the maximum annual drift loads is approximately 0.55. The greatest variability was found in Halifax and the least in Edmonton. Arvida, the heaviest snow area, had the least
variability of drift loads at 0.4.
The coefficient of variation of the snow density in the yearly maximum drifts over the years surveyed is about 0.25 in Ottawa and 0.4 in Halifax, for example, and the coefficient of variation of the densities for loads above 0.5 So in Figure 3 is approximately 0.2. CONCLUSIONS
From a preliminary analysis of the data from an 11- to 15-year survey of snow on simple and multi-level flat roofs from Halifax to Edmonton, the following conclusions can be drawn :
1. The specific gravity of snow on flat roofs, including in the drifts, is about 0.3, some
18% higher than currently recommended in the National Buiiding Code's Commentary on Snow Loads.
2. The maximum loads and largest average loads measured on the lower flat roofs away from the drifts, and on the upper roofs, indicate that the design value of 0.6 SO used in the National Building Code of Canada is a good estimate for exposed roofs.
3 . The loads on upper roofs decrease as the height of the upper roof above grade increases from about 6 m to 13 m.
4. Some 12.5% of roofs had maximum drift loads above those recommended in the NBC's Commentary on Snow Loads. Use of a heavier specific gravity (0.3) in design reduces this to 3.6%.
5. The maximum drift loads in this survey are not well correlated with the length of the upper roof. An upper envelope curve, however, shows that drifts of about 2.0 SO were created on roofs about 6 m long, and drifts of 3.0 So on roofs of 30 m length.
6. Maximum annual snow loads on roofs, as measured in this survey, are quite variable, with coefficients of variation of about 0.5. The coefficient of variation of snow density is about 0.2.
ACKNOWLEDGEMENTS
The author would like to thank all those who took observations over the years and in particular P.J. Daly in Ottawa, J.D. Atkins in Halifax, J. Makohon in Saskatoon, A. Lorenson of ALCAN in Arvida, and Prof. J. Longworth, who arranged the observations in Edmonton. The universities of Lava1 and Waterloo, as well as the Meteorological Station in Gander, also took part. D.A. Lutes of NRC Ottawa organized the overall survey in 1967 and conducted it until 1972. The author also appreciates the dedication of Adrien Comeau, an engineering student from Nova Scotia, who spent a summer transferring the data to computer and doing preliminary analysis. This paper is a contribution of the Institute for Research in Construction, National Research Council of Canada.
REFERENCES
ANSI (1982) Minimum design loads for buildings and other structures. ANSI A58.1-1982. American National Standards Institute, Inc., 1430 Broadway, New York, NY, 10018, 100 p. Commentary H Snow Loads (1985) Supplement to the National Building Code of Canada 1985,
National Research Council of Canada, Ottawa, Ontario, NRCC 23178, pp. 203-218. IS0 (1981) Bases for design of structures--determination of snow loads on roofs.
IS0 4355-1981(E). International Organization for Standardization, Standards Council of Canada, 18 p.
Isyumov, W . (1971) An approach to the prediction of snow loads. Ph.D. Thesis, The
University of Western Ontario, London, Ontario, Research Report BLWT-9-71, 534 p. NBC 1985. National Building Code of Canada 1985. National Research Council of Canada,
Ottawa, Ontario, NRCC 23174, p. 162.
O'Rourke, M.J. and Wood, E. (1986) Improved relationship for drift loads on buildings. Canadian Journal of Civil Engineering, Vol. 13, No. 6, pp. 647-652.
Taylor, D.A. (1979) A survey of snow loads on roofs of arena-type buildings in Canada. Canadian Journal of Civil Engineering, Vol. 7, No. 1, pp. 1-18.
Taylor, D.A. (1984) Snow loads on two-level flat roofs. Proceedings, Eastern Snow Conference, V. 29, 41st Annual Meeting, Washington, D.C., pp. 3-13.
Templin, J.T. and Schriever, W.R. (1982) Loads due to drifted snow. Journal of the Structural Division, American Society of Civil Engineers, Vol. 108, No. ST8, pp. 1916-1925.
T h i s p a p e r i s b e i n g d i s t r i b u t e d i n r e p r i n t f o r m by t h e I n s t i t u t e f o r R e s e a r c h i n C o n s t r u c t i o n . A l i s t of b u i l d i n g p r a c t i c e and r e s e a r c h p u b l i c a t i o n s a v a i l a b l e f r o m t h e I n s t i t u t e may be o b t a i n e d by w r i t i n g t o t h e P u b l i c a t i o n s S e c t i o n , I n s t i t u t e f o r R e s e a r c h i n C o n s t r u c t i o n , N a t i o n a l R e s e a r c h C o u n c i l o f C a n a d a , O t t a w a , O n t a r i o , K I A 0R6. Ce document e s t d i s t r i b u 6 s o u s forme d e t i r 6 - 5 - p a r t p a r l ' I n s t i t u t de r e c h e r c h e e n c o n s t r u c t i o n . On p e u t o b t e n i r une l i s t e d e s p u b l i c a t i o n s de 1 ' I n s t i t u t p o r t a n t s u r les t e c h n i q u e s ou l e s r e c h e r c h e s e n matisre d e b g t i m e n t e n 6 c r i v a n t 3 l a S e c t i o n d e s p u b l i c a t i o n s , I n s t i t u t d e r e c h e r c h e e n c o n s t r u c t i o n , C o n s e i l n a t i o n a l d e r e c h e r c h e s du Canada, Ottawa ( O n t a r i o ) , K I A 0R6.