Publisher’s version / Version de l'éditeur: Technical Report, 2001-03
READ THESE TERMS AND CONDITIONS CAREFULLY BEFORE USING THIS WEBSITE. https://nrc-publications.canada.ca/eng/copyright
Vous avez des questions? Nous pouvons vous aider. Pour communiquer directement avec un auteur, consultez la
première page de la revue dans laquelle son article a été publié afin de trouver ses coordonnées. Si vous n’arrivez pas à les repérer, communiquez avec nous à [email protected].
Questions? Contact the NRC Publications Archive team at
[email protected]. If you wish to email the authors directly, please see the first page of the publication for their contact information.
Archives des publications du CNRC
For the publisher’s version, please access the DOI link below./ Pour consulter la version de l’éditeur, utilisez le lien DOI ci-dessous.
https://doi.org/10.4224/12328767
Access and use of this website and the material on it are subject to the Terms and Conditions set forth at Scientific Basis for Ice Regime System: March 2001 Update
Timco, Garry; Kubat, Ivana
https://publications-cnrc.canada.ca/fra/droits
L’accès à ce site Web et l’utilisation de son contenu sont assujettis aux conditions présentées dans le site LISEZ CES CONDITIONS ATTENTIVEMENT AVANT D’UTILISER CE SITE WEB.
NRC Publications Record / Notice d'Archives des publications de CNRC:
https://nrc-publications.canada.ca/eng/view/object/?id=dbd1b381-458b-47c1-90a2-0ecbe7ec6fff https://publications-cnrc.canada.ca/fra/voir/objet/?id=dbd1b381-458b-47c1-90a2-0ecbe7ec6fff
TP 13405 E
Scientific Basis for the Ice Regime System:
March 2001 Update
G.W. Timco and I. Kubat Canadian Hydraulics Centre National Research Council of Canada
Ottawa, Ont. K1A 0R6 Canada
Technical Report HYD-TR-061
ABSTRACT
This report provides an update on the work being carried out by the Canadian Hydraulics Centre of the NRC, to put the Arctic Ice Regime Shipping System (AIRSS) on a scientific basis. Although the project is not complete, significant progress has been made towards its intended goal. This report describes the work that was done during the past year. This work falls into 3 categories- updating the ice regime database with over 400 new Events; organising and participating in a Workshop on the CHC proposal to modify the definition of the Ice Numeral; and completing Tasks 5 and 6, which were related to the Identification and Detection of Problem Ice.
TABLE OF CONTENTS ABSTRACT... 1 TABLE OF CONTENTS... 3 LIST OF FIGURES ... 4 LIST OF TABLES... 6 1.0 INTRODUCTION ... 7
2.0 NEW INFORMATION ADDED TO THE CHC DATABASE... 11
3.0 ICE REGIMES WORKSHOP ... 21
3.1 Minutes of Ice Regime Workshop ... 21
3.1.1 Scientific Basis of Ice Regime System ... 21
3.1.2 Discussion of AIRSS Parameters ... 22
3.1.3 Conclusions/ Way Ahead... 24
4.0 IDENTIFICATION AND DETECTION OF PROBLEM ICE ... 26
4.1 The Canadian Ice Service ... 26
4.2 Identification of Problem Ice ... 30
4.2.1 Sources of Data ... 30
4.2.2 Ice Concentration ... 31
4.2.3 Ice Volume... 35
4.2.4 Prediction of Ice Types ... 35
4.2.5 Ice Numerals ... 37
4.2.6 Ice Numerals Within an Egg Code ... 40
4.3 Conclusions... 44
5.0 FUTURE WORK – TASK 7 ... 45
6.0 REFERENCES ... 46 APPENDIX A – ICE REGIME WORKSHOP PRESENTATION
LIST OF FIGURES
Figure 1: Pie chart showing the breakdown of Events in the updated ice regime database. ... 15 Figure 2: Pie chart showing the breakdown of damage (D) and no-damage (ND) Events in the updated database for each vessel class... 15 Figure 3: Pie charts showing the breakdown for the Ice Numeral for Events with damage severity (DS) = 3, 1 or 2, and 0. The Ice Numeral was calculated using the ASPPR definition... 16 Figure 4: Pie charts showing the breakdown for the Ice Numeral for Events with damage severity (DS) = 3, 1 or 2, and 0. The Ice Numeral was calculated using the definition proposed by Timco and Kubat (2000)... 17 Figure 5: Plot of vessel speed versus the ASPPR and the CHC Proposed Ice Numeral for all vessel classes... 18 Figure 6: Plot of speed versus ASPPR and CHC Proposed Ice Numerals for Type vessels. The data shows damage and no-damage Events where there is only first-year (FY) ice, and when there is a mix of first-year and multi-year (MY) ice... 19 Figure 7: Plot of the speed versus the ASPPR and CHC Proposed Ice Numeral for Type vessels showing the PPD damage Events and no-damage Events for different ice conditions of first-year (FY) and multi-year (MY) ice. ... 20 Figure 8: RADARSAT image of Northumberland Strait illustrating the details in ice conditions observable from RADARSAT (image from Canadian Ice Service). 27 Figure 9: CIS Ice Chart for March 1, 2001 for the Eastern Arctic. The ice conditions are detailed using the "Egg Code". ... 28 Figure 10: Details of the Egg Code used to describe ice conditions. Note that the Egg Code provides information on the distribution of ice concentrations, types, thickness, floe sizes and roughness... 29 Figure 11: Scatter plot comparing the predicted and observed ice concentrations for all types of ice. ... 32 Figure 12: Histogram showing the difference between the predicted and observed concentration for all ice types. ... 32 Figure 13: Scatter plot comparing the predicted and observed ice concentrations for Events with thick first-year ice. ... 33 Figure 14: Histogram showing the difference between the predicted and observed concentration for Events with thick first-year ice... 33 Figure 15: Scatter plot comparing the predicted and observed ice concentrations for Events with multi-year ice ... 34 Figure 16: Histogram showing the difference between the predicted and observed concentration for Events with multi-year ice... 34 Figure 17: Scatter plot of observed ice volume verus predicted ice volume for observations with first-year ice only (i.e. no old ice)... 36 Figure 18: Histogram showing the agreement between the predicted and observed ice volume. In general, the ice volume is overpredicted. ... 36
Figure 19: Scatter plot of the Ice Numeral (IN) based on the observed and predicted ice conditions. This data is based on observations with only first-year ice (i.e. no old ice). ... 38 Figure 20: Histogram showing the difference in the Ice Numeral using predicted and observed ice conditions. This data is based on observations with only first-year ice (i.e. no old ice)... 38 Figure 21: Scatter plot of the Ice Numeral (IN) based on the observed and predicted ice conditions for all ice types. ... 39 Figure 22: Histogram showing the difference in the Ice Numeral using predicted and observed ice conditions for all ice types. ... 39 Figure 23: Graph showing the variation of the Ice Numeral within a single region egg code from an Ice Chart (Type A vessel; Case 1). ... 40 Figure 24: Graph showing the variation of the Ice Numeral within a single region egg code from an Ice Chart (Type A vessel; Case 2). ... 41 Figure 25: Graph showing the variation of the Ice Numeral within a single region egg code from an Ice Chart (Type A vessel; Case 3). ... 41 Figure 26: Graph showing the variation of the Ice Numeral within a single region egg code from an Ice Chart (Type A vessel; Case 4). ... 42 Figure 27: Graph showing the variation of the Ice Numeral within a single region egg code from an Ice Chart (Type A vessel; Case 5). ... 42 Figure 28: Graph showing the variation of the Ice Numeral within a single region egg code from an Ice Chart (CAC4 vessel; Case 1). ... 43 Figure 29: Graph showing the variation of the Ice Numeral within a single region egg code from an Ice Chart (CAC4 vessel; Case 2). ... 43
LIST OF TABLES
Table 1 Table of Ice Multipliers for AIRSS ... 8
Table 2 Definition of the Damage Severity Numbers ... 13
Table 3 Details of New Ship Damage Events caused by Ice... 14
Table 4 List of Vessels that Supplied Information for the Analysis... 30
Scientific Basis for the Ice Regime System:
March 2001 Update
1.0 INTRODUCTION
Navigation in Canadian waters north of 60°N latitude is regulated by the Arctic Shipping Pollution Prevention Regulations (ASPPR). These regulations include the date Table in Schedule VIII and the Shipping Safety Control Zones Order, made under the Arctic Waters Pollution Prevention Act. Both of these are combined to form the “Zone/Date System” matrix that gives entry and exit dates for various ship types and classes. It is a rigid system with little room for exceptions. It is based on the premise that nature consistently follows a regular pattern year after year.
Transport Canada, in consultation with stakeholders, has proposed extensive revisions to the Arctic Shipping Pollution Prevention Regulations (ASPPR 1989; Canadian Gazette 1996; AIRSS 1996). The changes are designed to reduce the risk of structural damage in ships which could lead to the release of pollution into the environment, yet provide the necessary flexibility to shipowners by making use of actual ice conditions, as seen by the Master. In this new system, an "Ice Regime", which is a region of generally consistent ice conditions, is defined at the time the vessel enters that specific geographic region, or it is defined in advance for planning and design purposes. The Arctic Ice Regime Shipping System (AIRSS) is based on a simple arithmetic calculation that produces an “Ice Numeral” that combines the ice regime and the vessel’s ability to navigate safely in that region. The Ice Numeral (IN) is based on the quantity of hazardous ice with respect to the ASPPR classification of the vessel (see Table 1). The Ice Numeral is calculated from
.... ] [ ] [ + + = CaX IMa CbX IMb IN (1) where IN = Ice Numeral
Ca = Concentration in tenths of ice type “a”
IMa = Ice Multiplier for ice type “a” (from Table 1)
The term on the right hand side of the equation (a, b, c, etc.) is repeated for as many ice types as may be present, including open water. The values of the Ice Multipliers are adjusted to take into account the decay or ridging of the ice by adding or subtracting a correction of 1 to the multiplier, respectively (see Table 1).
The Ice Numeral is therefore unique to the particular ice regime and ship operating within its boundaries.
HYD -TR -061 - 8 -Table 1
Table of Ice Multipliers for AIRSS
T a b l e O f I c e M u l t i p l i e r s B y S h i p C a t e g o r y
AES / WMO I c e M u l t i p l i e r s for each S h i p C a t e g o r y
Ice Codes I c e T y p e s Type E Type D Type C Type B Type A CAC 4 CAC 3
7• or 9• Old / Multi-Year Ice... (MY) -4 -4 -4 -4 -4 -3 -1
8• Second Year Ice ... (SY) -4 -4 -4 -4 -3 -2 1
6 or 4• Thick First Year Ice ... (TFY) > 120 cm -3 -3 -3 -2 -1 1 2
1• Medium First Year Ice ... (MFY) 70-120 cm -2 -2 -2 -1 1 2 2
7 Thin First Year Ice ... (FY) 30-70 cm -1 -1 -1 1 2 2 2
9 Thin First Year Ice - 2nd Stage 50-70 cm
8 Thin First Year Ice - 1st Stage 30-50 cm -1 -1 1 1 2 2 2
3 or 5 Grey-White Ice... (GW) 15-30 cm -1 1 1 1 2 2 2 4 Grey Ice... (G) 10-15 cm 1 2 2 2 2 2 2 2 1 ð∆ °°°°
Nilas, Ice Rind
New Ice ... (N) Brash (ice fragments < 2 m across)
Bergy Water Open Water < 10 cm < 10 cm 2 “ “ “ “ 2 “ “ “ “ 2 “ “ “ “ 2 “ “ “ “ 2 “ “ “ “ 2 “ “ “ “ 2 “ “ “ “
Notes: Decayed Ice: For the following ice types: MY, SY, TFY, and MFY that are ‘decayed’, add 1 to the Ice Multiplier.
Ridged Ice: For floes of ice that are over 3/10ths ‘Ridged’ and in an overall concentration that is greater than 6/10ths, subtract 1 from the Ice Multiplier.
The ASPPR deals with vessels that are designed to operate in severe ice conditions for both transit and Icebreaking (CAC class) as well as vessels designed to operate in more moderate first-year ice conditions (Type vessels). The System determines whether or not a given vessel should proceed through that particular ice regime. If the Ice Numeral is negative, the ship is not allowed to proceed. However, if the Ice Numeral is zero or positive, the ship is allowed to proceed into the ice regime. Responsibility to plan the route, identify the ice, and carry out this numeric calculation rests with the Ice Navigator who could be the Master or Officer of the Watch. Due care and attention of the mariner, including avoidance of hazards, is vital to the successful application of the Ice Regime System. Authority by the Regulator (Pollution Prevention Officer) to direct ships in danger, or during an emergency, remains unchanged.
At the present time, there is only partial application of the ice regime system, exclusively outside of the “zone-date” system.
Credibility of the new system has wide implications, not only for ship safety and pollution prevention, but also in lowering ship insurance rates and predicting ship performance. Therefore, there is a need to establish a scientific basis for the system. To this end, Transport Canada approached the Canadian Hydraulics Centre of the National Research Council of Canada in Ottawa to assist them in developing a methodology for establishing a scientific basis for AIRSS.
In developing the methodology, a very straightforward approach was employed. The approach centers on asking and answering seven basic questions. Each question is a logical extension to the answer of the previous question. The basic questions are:
1. What problems can happen to a ship in ice?
2. What are specific examples of problems that have occurred that could be used for a deterministic development? i.e. specific case-histories that can be used to identify and understand the problems.
3. Would the current ice regime system have predicted these problems? 4. If not, how can the problem conditions be better defined?
5. Can the current ice detection methods identify the problem ice conditions?
6. If not, how can the ice detection systems be improved in a pragmatic manner to be able to detect the problem ice?
7. How can this information be communicated to the ship to implement the Ice Regime System?
The answers to these questions led to a "road map" approach that defined 7 Tasks (Timco and Frederking 1996; Timco et al. 1997). These Tasks are:
1. Define Safety-Related Issues
2. Definition of Specific Problems with the Corresponding Ice Conditions 3. Assess the Adequacy of the AIRSS
4. Definition of Problem Ice and Operation Conditions 5. Identification of Problem Ice
6. Detection of Problem Ice 7. Implementation of AIRSS
Considerable progress has been made in addressing these Tasks, and in answering the 7 basic questions. A previous report by the authors discussed in detail the status of each of the 7 Tasks (Timco and Kubat 2000). These Tasks will not be reviewed in detail in the present report. Instead, the work that was done in each of the Tasks will be addressed as an adjunct to the previous report. In particular, however, work during this past year was focused primarily on Tasks 5 and 6. This report presents information on these Tasks, and provides information on the work done to update some of the earlier Tasks.
2.0 NEW INFORMATION ADDED TO THE CHC DATABASE
During the past year, 401 new data Events were added to the CHC Ice Regime Database. Information on these Events came from the following sources:
• One hundred and eighteen (118) Events were obtained from the ice trials of the USCGC Healy. These trials were carried out in April 2000 from Halifax to Nuuk, Greenland. During northward voyage of Phase IIIa the ship travelled through the Gulf of St. Lawrence, along the Labrador Coast, into Davis Strait and across to Nuuk, Greenland. During this voyage, 118 different ice regimes were observed and recorded (Johnston and Gorman 2001).
• Eighty-three (83) Events were obtained from the AIRSS After-Action Reports that were submitted to Transport Canada. These reports were forward to the CHC by Robert Wolfe. These Events include information from the MV Federal Franklin (6 Events), MV Oragen (1 Event), MV Federal Rhine (9 Events), MV Arctic (23 Events) and MV Umiavut (44 Events).
• One hundred and eighty-five (185) Events were obtained from the Canarctic Voyage Reports including Events from the Federal Fuji (20 Events), Federal Franklin (121 Events), and Federal Baffin (44 Events).
• Two (2) Events were obtained from the earlier ASPPR field trials of the MT Hubert-Gaucher and the MV Federal Polaris.
All the above Events were non-damage events.
In addition, the Transportation Safety Board of Canada supplied 13 Events on vessels with damage due to ice (see Table 3). For three cases (Arctic Viking, BCM Atlantic, Umiavut), there was sufficient information for full evaluation in the ice regime database. For the other cases, the details on the ice conditions were not sufficiently documented with certainty so they could not be used for detailed analysis. All of the Events were added to the database. Note that 3 of these Events occurred north of 60°. The other damage Events occurred at lower latitudes.
With these additions, the breakdown of Events in the CHC database is shown in Figure 1 and Figure 2. The largest change from last year is in the amount of information for Type A vessels. With the new data, the number of Events for this vessel class increased from 48 to 213.
In earlier work on the ice regime system, Timco and Kubat (2000) used the events in the Ice Regime database to investigate possible improvements using an “interaction” approach. This was done in the context of exploring options for getting a better fit of the definition of the Ice Numeral to the empirical data. It was not meant to define the final definition of the Ice Numeral.
In their approach, Timco and Kubat (2000) incorporated several additional factors into the definition of the Ice Numeral. In brief, the approach that was used “rewards” high ice class vessels with experienced Ice Navigators operating in a prudent manner, and “penalizes” low ice class vessels, especially in the presence of multi-year ice. The methodology proposed by Timco and Kubat (2000) will not be repeated here. The original reference should be consulted for the details. However, to get a sense of the changes being proposed, the following bullets provide information on the methodology that provided the best improvement to the definition for the Ice Numeral:
§ Ice Multipliers should be defined to be zero at the “limit ice type” for each vessel. § Ice Multipliers for ice below the limit ice type should be treated equally, and
given a value of 2.
§ During the summer months (June 1 to September 30), a value of 10 is added to the Ice Numeral, with a few exceptions as noted below.
§ If the visibility is poor, the summer bonus of increasing the Ice Numeral by 10 would not be granted.
§ Add 5 to the Ice Numeral if the speed is less than 3 knots for the CAC and Type A & B vessels (i.e. no reward for low class Type vessels (i.e. Type C, D & E) even if the speed is low).
§ Subtract 5 from the Ice Numeral if multi-year ice is present and the speed is greater than 7 knots (only for Type C, D, & E vessels).
§ If there is multi-year or glacial ice present in the ice regime in concentrations of 1/10th or higher, there is no summer bonus of 10 for Vessels with an ice class of Type C, D & E. This restriction would not apply to the Type B vessels and higher class.
§ Subtract 3 from the Ice Numeral if the Master or Ice Navigator has limited experience in ice.
§ Subtract 1 from the Ice Multipliers for ice floes that are over 3/10s ridged and in an overall ice concentration that is greater than 6/10s (i.e. ASPPR condition). § Add 3 to the Ice Numeral if the ice is significantly decayed (probably only in late
summer).
§ Add 3 to the Ice Numeral if the floe size is less than 50 m and the ice is not under pressure.
§ Bergy bits (glacial ice) should be considered in the same way as multi-year ice. Figure 3 and Figure 4 show pie chart comparisons between the definition of the Ice Numeral defined by ASPPR, and that proposed by Timco and Kubat (2000). For ease of presentation and understanding, the information has been compiled into a series of 3 pie charts, according to the Damage Severity (DS) Number, which are defined according to Table 2.
Table 2 Definition of the Damage Severity Numbers Damage Severity
Number Description
0 No damage
1 High measured stress
2 slight deformation of hull, denting, propeller
3 small puncture or fracture, extensive denting
4 large hole
5 vessel sank
It should be noted that this damage description is not based on the cost of repair, nor downtime for a vessel. It is based strictly on the pollution potential of a particular type of damage. With this definition, it can be seen that Damage Severity of 3, 4 or 5, which represent breaching of the hull, have the highest probability for causing pollution. In subsequent analysis in this report, these damage events have been termed Potential Pollution Damage (PPD).
The pie charts shown in Figure 3 and Figure 4 are presented in terms of the Damage Severity as follows:
Damage Severity (DS) = 3 - These Events represent ship damage situations where there was hull fracture or cracking, holes in the hull, or large hull deformations. This category represents the damage that could result in pollution, and as discussed previously, is designated as Potential Pollution Damage (PPD). For an ideal Ice Regime System, all of these damage Events should have a negative Ice Numeral. A comparison between the 2 figures clearly shows that the definition proposed by Timco and Kubat (2000) better represents the available data.
Damage Severity (DS) = 1 or 2 - These Events represent either minor damage, or damage to propellers or steering gears, etc. (DS = 2), or high measured stress on the hull in ship trials (DS = 1). It could be considered that these Events are the “transition” Events between no damage and PPD damage. For an ideal Ice Regime System, these Events should have an Ice Numeral close to zero, with about an even split of positive and negative Ice Numerals. A comparison of both figures shows good agreement with the data.
Damage Severity (DS) = 0 - These Events represent no damage Events where the vessel has traversed an ice regime without any damage. For an ideal Ice Regime System, these Events should all have positive Ice Numerals. A comparison of the two figures shows an extremely large improvement with the CHC proposed definition (Timco and Kubat 2000).
Figure 5 to Figure 7 show the comparison of the ASPPR Ice Numeral and the CHC proposed Ice Numeral for the updated data. In these plots, the data are plotted with the vessel speed, and broken down vessel class and ice type.
Table 3 Details of New Ship Damage Events caused by Ice Date Latitude Longitude First-year Second-year Multi-year Iceberg Details
10-May-99 524800 0475730 0 0 0 (10) FARENCO vessel forepeak damaged by iceberg. 22-Sep-99 695000 0994100 On September 22, 1999 a barge was damaged by ice
while being towed by the tug "RADIUM
YELLOWKNIFE". The barge was holed; however, to compensate, the barge was counter flooded and resumed safe passage to Corner Brook, NFLD. 12-Oct-99 735500 0812000 2 1 1 On or about 12 October 1999, the general cargo vessel
ARCTIC VIKING sustained possible ice damage while transiting Northern waters. Forepeak holed. Arrived NANISIVIK 12/1400 UTC.
22-Feb-00 441800 0642000 L.P. MACDONALD departed Riverport at 0900. The F/V returned to Riverport at 1000 with prop damage possibly due to ice.
17-Mar-00 482142 0703224 10 On 17 March, the "FANDANGO", loaded with caustic soda, reported a fracture of 3-4 ft. on the starboard bow. No pollution risk.
18-Mar-00 530940 0521100 4 2 1 5 F/V BCM ATLANTIC reported taking on water through a hole in the hull. The crew donned immersion suits and abandoned the vessel in three liferafts, taking two EPIRBs. All 26 crewmembers were recovered 4 hours later by the F/V FAME. Vessel sank.
17-Mar-00 482142 0703224 10 While enroute Trois Rivieres, "FANDANGO" had to reduce speed due to vibrations caused by damaged propeller.
10-Apr-00 502936 0545304 6 4 C'S II reports crack in hull just above water line. No immediate danger.
13-Apr-00 494400 0512955 3 LOUISE MARY vessel report broken down with rudder trouble.
13-May-00 513730 0561809 9 1 18.1M Fibreglass F/V (SEA VOYAGER II) with 5 POB holed by ice and taking on water. Ingress of water controlled using fixed pumps and 1 SAR pump provided by CCGA. Vessel excorted to Port Saunders by other F/V's.
04-Aug-00 573730 0913630 9 PHILIPPOS encoutered pack ice and sustaind ice damage to port side of bulbous bow. Bow was tidal. No report of pollution.
20-Jul-00 690500 0654030 8 On July 20, 2000 the Master of the UMIAVUT reported minor ice damage to the vessel forepeak. After inspection no cracks or broken frames were found in the hull.
10-Jan-01 460400 0770330 0n 10 Jan 2001, while backing away from the dock in Adolphustown, Ont., the ferry "GLENORA" struck a large peice of floating ice at 2300, damaging the ice guard. Minor damage was sustained and the ferry was removed from service for a short time.
No Damage (1322)
87%
Damage (44)
Not complete information
3%
Damage (161)
11%
Figure 1: Pie chart showing the breakdown of Events in the updated ice regime database. Type
E
(35) TypeD
(35) TypeC
(8) TypeB
(594) Type A (213) CAC4
(401) CAC3
(231)D=24, ND=189
D=23, ND=378
D=6, ND=2
D=28, ND=7
D=69, ND=525
D=26, ND=205
D=19, ND=16
Figure 2: Pie chart showing the breakdown of damage (D) and no-damage (ND) Events in the updated database for each vessel class.
Positive IN
16%
Negative IN
84%
Positive IN46% Negative IN 54%Positive IN
82%
Negative IN
18%
Figure 3: Pie charts showing the breakdown for the Ice Numeral for Events with damage severity (DS) = 3, 1 or 2, and 0. The Ice Numeral was calculated using the ASPPR definition.
Positive IN
13%
Negative IN
87%
Positive IN 59% Negative IN 41%Positive IN
94%
Negative IN
6%
Figure 4: Pie charts showing the breakdown for the Ice Numeral for Events with damage severity (DS) = 3, 1 or 2, and 0. The Ice Numeral was calculated using the definition proposed by Timco and Kubat (2000).
0 5 10 15 20 -40 -30 -20 -10 0 10 20
ASPPR Ice Numeral
Vessel Speed (knots)
No Damage Damage (DS 1-2) Damage (PPD) IN = 0 0 5 10 15 20 -40 -30 -20 -10 0 10 20
Proposed Ice Numeral
Vessel Speed (knots)
No Damage Damage (DS 1-2) Damage (PPD)
IN = 0
Figure 5: Plot of vessel speed versus the ASPPR and the CHC Proposed Ice Numeral for all vessel classes.
0 5 10 15 20 -40 -30 -20 -10 0 10 20
ASPPR Ice Numeral
Speed (knots) Damage FY only No Damage FY only Damage MY + FY No Damage MY + FY TYPE VESSELS IN = 0 0 5 10 15 20 -40 -30 -20 -10 0 10 20
Proposed Ice Numeral
Speed (knots) Damage FY only No Damage FY only Damage MY + FY No Damage MY + FY TYPE VESSELS IN = 0
Figure 6: Plot of speed versus ASPPR and CHC Proposed Ice Numerals for Type vessels. The data shows damage and no-damage Events where there is only first-year (FY) ice, and when there is a mix of first-year and multi-year (MY) ice.
0 5 10 15 20 -40 -30 -20 -10 0 10 20
ASPPR Ice Numeral
Speed (knots) Damage FY only (PPD) No Damage FY only Damage MY + FY (PPD) No Damage MY + FY TYPE VESSELS IN = 0 0 5 10 15 20 -40 -30 -20 -10 0 10 20
Proposed Ice Numeral
Speed (knots) Damage FY only (PPD) No Damage FY only Damage MY + FY (PPD) No Damage MY + FY TYPE VESSELS IN = 0
Figure 7: Plot of the speed versus the ASPPR and CHC Proposed Ice Numeral for Type vessels showing the PPD damage Events and no-damage Events for different ice conditions of first-year (FY) and multi-year (MY) ice.
3.0 ICE REGIMES WORKSHOP
A one day Workshop was held in Montreal on November 10, 2000. The Workshop included a demonstration of the Ice Navigation Simulator that is being developed by Transport Canada. The main focus of the Workshop, however, centred on the Ice Regime System and the work that the CHC is doing to put it on a scientific basis.
G. Timco gave a one hour presentation outlining the framework for putting the system on a scientific basis, as well as a detailed proposal showing the improvements that could be made to the system if more factors were taken into account. The presentation was based on the work performed for Transport Canada by the CHC over the past few years. This ongoing work contributes to the database of Events and helps to explore options that might improve the Ice Regime System. At a minimum, it provides fuller understanding of any potential changes. The complete presentation is included in Appendix A of this report.
During the presentation, Timco stressed the importance of treating the situation as an “interaction” process between the vessel and the ice. By doing this, many more important factors could be considered in defining the Ice Numeral. A significant improvement can be shown (also see Figure 3 to Figure 7 of this report).
The Workshop was intended to present the research findings, and also get industry feedback on the work and the proposed approach for potential modifications and/or full implementation of the Ice Regime System. Andrew Kendrick of Fleet Technology took minutes of the meeting. The minutes pertaining to the ice regime work are presented in the following section.
3.1 Minutes of Ice Regime Workshop 3.1.1 Scientific Basis of Ice Regime System
1. Dr. G. Timco of Canadian Hydraulics Centre presented CHC’s latest report to TC on AIRSS (TP 13574) and possible means of enhancing the system. Copies of the report were distributed, and it will also soon be available in electronic format at the Transport Canada www site: http://tc.gc.ca
2. The CHC database of Ice Regime navigation events is at the core of this work. This includes both damage and non-damage events. CHC’s objective is to reduce the number of ‘false positives’ and ‘false negatives’; i.e. cases in which damage occurred in nominally positive ice numerals, and those in which no damage was incurred in negative numerals, respectively.
3. In the current version of AIRSS 83% of severe damage incidents collected in the database occur in ice numerals of < 0, while 17% of such incidents are in positive ice numerals. At the other extreme, 19% of events with no damage have been recorded in negative regimes.
4. A large number of adjustments to the current system have been proposed as options by CHC, covering such factors as ice decay, visibility, speed, experience, navigational equipment, presence of multi-year ice, floe size, glacial ice, etc. The adjustments were proposed based on a parametric optimization of the data.
5. With these adjustments, 88% of the severe damage incidents would occur in ice numerals <0 (compared to 83% for AIRSS). Also, for the non-damage travel, only 7% of the Events had a negative Ice Numeral. Therefore, the adjustments proposed by the CHC could give a better representation for both the damage and non-damage Events.
6. Discussion of some specific items is covered in the next section. General comments on the proposals were:
a) Several attendees felt that the proposals would make the system too complex. It will be difficult for mariners to undertake the calculations proposed while actually navigating in the conditions of most importance. b) It was noted that the proposals do not take full account of the probability
that many damages are the result of human error. Attempting to remove all such events through AIRSS may make it unnecessarily stringent.
c) It was suggested that the database is biased and is at risk of becoming more so due to the current prohibition on navigating in negative regimes (while using the system). Also, recent improvements in the accident record due to better equipment and operating practices may not be captured by the database analyses that have been used so far.
d) It was suggested that fuzzy logic/Artificial Intelligence (AI) techniques could be more useful in interpreting the wide range of parameters and their values than is the AIRSS as now constituted.
3.1.2 Discussion of AIRSS Parameters
The notes below are intended to consolidate all discussions of each issue during the Workshop, and are thus not necessarily in sequence.
Experience
• All attendees appear to agree that adequate ice navigation experience is vital to safe operation. Using AIRSS requires that there are qualified and certified personnel aboard. The Zone/Date system does not require such personnel for all operations. The general opinion at the workshop appeared to be that the requirement should be mandated for all operations into ice-infested waters, though it was noted that this might prove unpopular with the Port of Churchill and (perhaps) some others.
• The operators noted that for practical reasons they already carry more and more highly experienced ice navigators than are required by current standards.
• Differentiating between levels of experience and qualifications was discussed, but most participants felt this would be difficult to implement. Using the accident record of navigators might penalize the most experienced users unfairly, as all Arctic
• It was noted that the CHC database does not include much information on the actual levels of experience associated with either damage or non-damage events.
• It was noted that the operators with least understanding of AIRSS appear to be the Coast guard crews, and that their lack of feel for the capabilities of the escorted ship can cause difficulties and damage. Some measures should be planned to address this issue.
Speed
• Speed is a vital factor. Experienced operators will tend to go more slowly than inexperienced operators in marginal conditions. Excess speed is the cause of many damages.
• The treatment of speed proposed in the CHC report was not generally supported, as it does not appear to relate directly to operators’ perceptions or to any theoretical model of loading.
• The concept of using a variant of the Russian Ice Passport was discussed. It was noted that passports are ship-specific, and so their use within AIRSS would change the concept of the system significantly. (Work has been done in comparing the two systems).
Navigational Equipment
• Additional equipment requirements were felt by many to be unnecessary. However, there may be some potential for mandating more effective actual use of the equipment that is now carried. Currently, some operators may not use the equipment they have to download even basic ice information.
• In some cases this information will not be readily available, as Canadian Ice Services does not provide total coverage for all areas or all seasons. Where the Coast Guard has not paid, individual operators have to do so on a cost recovery basis, and few are prepared to cover the cost. If subscription to a chart information service were mandated, this issue would disappear.
• The quality of Ice Services products is acknowledged to have improved greatly in recent years. It was noted that forecasts and ice analysis charts are still strategic (voyage planning) rather than tactical aids.
• It was also noted that transmission reliability/quality via RF facsimile from NORDREG still leaves much to be desired. Even well-equipped and responsible operators may not have the most current information.
Manoeuvrability/ Floe Size
• Maneuverability, concentration and floe size are linked, as are floe size and speed. Inertia considerations mean that small floes are easier to push aside than larger ones, and small floes can be easier to maneuver around. It is possible that the Ice
Navigation Simulator could be used to quantify these influences, by observing how experienced users operate in fields of varying concentrations and floe sizes.
Ice Strength
• Ice strength is highly variable, and the current classification system (decay, FY/SY/MY) does not capture the range of properties with any precision.
• CHC’s proposal to use a time-based correction to capture strength was not supported, as it appears to reintroduce the coarse Zone/Date approach.
• Strength cannot easily be assessed by local visual observations, and so any better classification system will need to rely heavily on the ability of Ice Services to evaluate and communicate. Research and other work is ongoing to accomplish this.
• Treatment of glacial ice poses some problems, as concentrations rarely approach 1/10th. It is generally agreed, however, that a regime containing even traces of glacial ice (or multi–year) is much more hazardous than one that is truly Open Water or ice-free.
• Brash ice is currently treated by AIRSS as equivalent to open water, but this is also regarded as misleading. Lower ice class ships may easily sustain damage in brash ice (behind an icebreaker or elsewhere) if operated at too high a speed.
Enforcement/Reporting
• It was questioned why reporting to NORDREG is still not mandatory for ships in the Arctic. TC noted that reporting is mandatory under AIRSS, and most vessels using the Zone/Date system also report. Several operators feel strongly that reporting should be required to catch the ‘rogues’ who are most likely to cause serious accidents.
• There was general agreement that the ‘person on the spot’ (if qualified) has the best appreciation of local ice conditions, and this should always be taken into account by regulators at remote locations. This basic principle of AIRSS continues to be
observed in practice.
3.1.3 Conclusions/ Way Ahead
• It was generally agreed that the Ice Regime System has proven to be a useful tool for a range of users and purposes.
• Operators are not in favour of replacing the Zone/Date with full implementation unless improvements can be made.
• TC noted that roughly the same percentage (20%) of “false positives” (i.e. damages occurring with positive numerals) exist for events within the Zone/Date System
• The most important issue for the industry is the removal of ‘false negatives’; i.e. cases where safe voyages would be prohibited.
• It is therefore important that operators voluntarily provide After Action Reports of voyages within the Zone/Date system particularly when negative regimes are encountered and are traversed safely, including information on the navigational techniques employed. Several operators collect this data, and expressed a willingness to share it with CHC and TC.
• Further development of the Ice Navigation Simulator is supported. It is regarded as a valuable initiative, though many participants feel that its capabilities are currently very limited.
• All participants were urged to review the CHC report and the ‘Issues for Discussion’ circulated in advance of and at the meetings and to provide additional feedback on any of the points to TC.
4.0 IDENTIFICATION AND DETECTION OF PROBLEM ICE
An important component of the Ice Regime System is the availability of accurate ice information. In order to use the Ice Regime System, a vessel must have access to relevant ice information that is both accurate and current, and as importantly, is reliably made available for shipboard decision making. Clearly, this type of ice information is required to define the details of the ice conditions that will be encountered along a particular vessel's transit route and in turn, calculate Ice Numerals.
The Canadian Ice Service (CIS) provides information on ice conditions in Canadian waters. In this section, some of the products and features of the CIS are briefly discussed. Then, a comparison is made of the ice conditions predicted by the CIS with actual ice conditions observed on board vessels. This “ground-truthing” provides insight into the reliability of the information used for the ice regime system. This work will examine the ability of current ice detection systems to accurately predict the ice conditions. Clearly, if remote sensing techniques do not provide a reliable method for estimating ice conditions, then the Ice Regime approach would be less accurate, especially for route planning purposes.
4.1 The Canadian Ice Service
Information regarding the ice cover is usually obtained from the range of products that are provided by the Canadian Ice Service. The CIS collects and analyses data on ice conditions in all regions of the country affected by the annual cycle of pack ice growth and disintegration. In summer, their focus is on conditions in the Arctic and the Hudson Bay region. In winter and spring, they provide ice information for the Labrador Coast and East Newfoundland waters, the Gulf of St. Lawrence, the Great Lakes and St. Lawrence Seaway. This information is a key and fundamental element in the application of the Ice Regime System and, to be credible to onboard personnel and effectively used, must be good in terms of its quality and timely in terms of its availability.
The CIS has state-of-the-art technology for predicting ice conditions in all regions. They use radar imagery from reconnaissance aircraft, and radar and imagery from several satellites including RADARSAT. This satellite, which is Canada's first earth observation satellite, provides coverage in the Arctic every day, and the rest of Canada every 3 days. RADARSAT transmits cloud-free radar images of the surface to two Canadian receiving stations. From there, the data are processed and delivered to the Service within hours. Figure 8 shows a RADARSAT image of Northumberland Strait and the Confederation Bridge. The figure clearly shows the ice conditions in great detail.
The CIS provides specialized products and services for both short-term tactical and longer range planning. These commercial products include detailed ice analysis charts, radar and satellite imagery and imagery analysis charts, and special forecasts covering the next 24 hours or the coming season. Commercial products are distributed through a
variety of formats, including mail, facsimile, an on-line bulletin board system (BBS) and the Service's Internet Website (http://www.cis.ec.gc.ca/home.html). The CIS has also developed sophisticated models that provide accurate projections of ice formation, drift, pressure and other important factors for use by forecasters and clients.
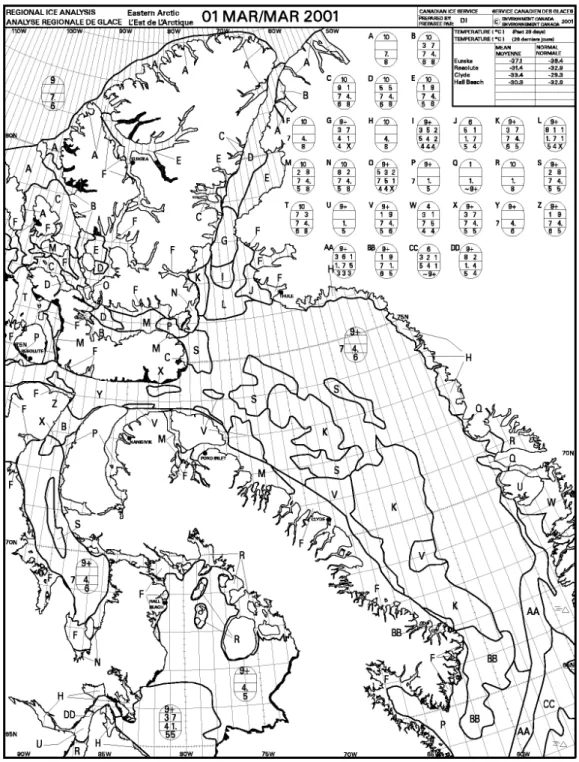
The daily ice chart is one of the most important products that CIS provides to vessels. Figure 9 shows a representative example for the East Coast of Canada. On the daily ice charts, the ice conditions are "detailed" by means of an egg code that highlights the distribution of ice concentrations, types, thickness, floe sizes and roughness (i.e., the various ice regimes) throughout the region of interest. Figure 10 provides the key for the egg code. (Full details can be found on the CIS web site).
Figure 8: RADARSAT image of Northumberland Strait illustrating the details in ice conditions observable from RADARSAT (image from Canadian Ice Service).
Figure 9: CIS Ice Chart for March 1, 2001 for the Eastern Arctic. The ice conditions are detailed using the "Egg Code".
Ct Total concentration of ice in area, reported in tenths
Ca Cb Cc Partial concentration in tenths of thickest (Ca), second thickest (Cb) and third thickest (Cc) Ice types with Ca, Cb, Cc 1/10 or more. If only one thickness type is present, Ca equals Ct and the second level is left blank
Sa Sb Sc Stage of development (age) of ice concentration reported by Ca, Cb, Cc. Fa Fb Fc predominant form of Ice (Floe size)
corresponding to Sa, Sb and Sc.
So Sd Development stage (age) of remaining ice types. So if reported is a trace of ice type thicker/older than Sa. Sd is thinner ice type which is reported when there are four or more ice thickness types.
Fa Fb Fc Sa So Sc
Form of Ice (width) Stages of Development (thickness cm)
0 Pancake 1 New - < 10
1 Brash 2 Nilas - <10
2 Ice Cakes - < 20 m 3 Young - 10 - 30
3 Small floe - 20 - 100 m 4 Grey - 10 - 15
4 Medium floe - 100 - 500 m 5 Grey-white - 15 - 30 5 Big Floe - 500 - 2000 m 6 First-year - > 30 6 Vast Floe - 2 - 10 km 7 Thin First-year - White - 30 - 70 7 Giant Floe > 10 km 1. Medium First-year - 70 - 120
8 Fast Ice 4. Thick First-year - > 120
9 Icebergs 7. Old
X No Form 8. Second Year no
C Ice is in strips 9. Multi-year defined
with concentration C Icebergs ranges
Note: All ages to the left of "." are decoded from the table as having "."
Figure 10: Details of the Egg Code used to describe ice conditions. Note that the Egg Code provides information on the distribution of ice
4.2 Identification of Problem Ice
Whenever possible, the data input into the Ice Regime database contained ice conditions both from the CIS ice charts and ice observations made on board the vessel. This was done to provide a means of comparing the actual ice conditions with those predicted by the Canadian Ice Service. Two hundred and eighty-three Events contained information that is useful for this purpose. In this section, the data sources are described and a comparison is made of the actual and observed ice conditions. Further, its implication with respect to the Ice Regime System is discussed.
4.2.1 Sources of Data
Information from 283 observations from 12 different vessels was used for this analysis (see Table 4). The largest number of observations was obtained from the recent icebreaking trials of the USCGC Healy. Mr. Bob Gorman, who has an extensive knowledge of ice conditions, recorded 118 different regimes during the first leg of the trials (Johnston and Gorman 2000). A large number of Events were obtained from information supplied by the experienced Ice Navigators and Masters of FedNav and Transport Nanuk vessels. In addition, there were a few observations from Canadian Coast Guard vessels. These data were used in the present analysis.
Table 4 List of Vessels that Supplied Information for the Analysis
Vessel Name Number ofEvents
USCGC Healy 118 Federal Franklin 79 Federal Baffin 37 Lucien-Paquin 23 Ikaluk 13 MT Hubert Gaucher 3 Des Groseilliers 2 Federal Polaris 2 Henry Larsen 2 MV Arctic 2 Frangiskos CK 1
Sir John Franklin 1
4.2.2 Ice Concentration
The first parameter that was investigated was the concentration of ice. This was done for 3 different situations:
1. Concentration of all ice types 2. Concentration of thick first-year ice 3. Concentration of multi-year ice
Figure 11 shows a scatter diagram of the predicted concentration versus the observed concentration of ice for all 283 Events. At first glance, the agreement does not look good. However, in plotting this type of data in this manner, there are several data points superimposed so an accurate picture does not emerge. Instead of using this type of approach, the data is plotted as histograms looking at the difference in the predicted and observed concentrations. If this is done, a completely different picture emerges for this data. Figure 12 shows the histogram plot for concentration of all ice types. In this case, the actual and predicted concentrations agree for 22% of the cases, but for over 60% of the observations, the predicted and observed agree to within ±1/10th concentration. For the rest of the data, there is a slight tendency to underpredict the actual ice concentration. In general, this is quite good agreement.
Figure 13 and Figure 14 show the scatter plot and histogram for the data with thick first-year ice present (i.e. more severe first-first-year ice conditions). This type of ice was present in 192 of the Observations. In this case, approximately 66% of the Observations were within ±1/10th concentration.
Figure 15 and Figure 16 show the scatter plot and histogram for the data with multi-year ice present. This type of ice was present in 128 of the Observations. In this case, approximately 85% of the Observations were within ±1/10th of the predicted concentration. This is extremely good agreement. Note however, that there is a tendency to underpredict the concentration of multi-year ice.
0 2 4 6 8 10 12 0 2 4 6 8 10 12 Predicted Concentration Observed Concentration Total N = 283
Figure 11: Scatter plot comparing the predicted and observed ice concentrations for all types of ice.
0 10 20 30
-10 -8 -6 -4 -2 0 2 4 6 8 10
Difference in Total Concentration
Frequency (%)
N = 283
Underpredicted Overpredicted
All ice types
60% within + 1/10 Prediction
Figure 12: Histogram showing the difference between the predicted and observed concentration for all ice types.
0 2 4 6 8 10 12 0 2 4 6 8 10 12 Predicted Concentration Observed Concentration Tk FY N = 283
Figure 13: Scatter plot comparing the predicted and observed ice concentrations for Events with thick first-year ice.
0 10 20 30 40 50 -10 -8 -6 -4 -2 0 2 4 6 8 10 Difference in Tk FY Ice FREQUENCY (%) Underpredicted Overpredicted Tk FY N = 283 66% within + 1/10 Prediction NTk = 192 No Thick First-Year Ice
Figure 14: Histogram showing the difference between the predicted and observed concentration for Events with thick first-year ice.
0 2 4 6 8 10 12 0 2 4 6 8 10 12 Predicted Concentration Observed Concentration Old Ice N = 283
Figure 15: Scatter plot comparing the predicted and observed ice concentrations for Events with multi-year ice
0 25 50 75
-10 -8 -6 -4 -2 0 2 4 6 8 10
Difference in Old Ice
FREQUENCY (%) Underpredicted Overpredicted Old Ice N = 283 total NMY = 128 No MY ice 85% within + 1/10 Prediction
Figure 16: Histogram showing the difference between the predicted and observed concentration for Events with multi-year ice.
4.2.3 Ice Volume
As seen in the previous section, there is quite good agreement between the predicted and observed ice concentrations. In this section, a comparison is made of the total “volume” (Vi) of ice. This was determined by summing the product of the ice concentration (Ci) and
the ice thickness (hi) for each type of ice. That is
∑
= i i i
i C xh
V (2)
where the sum i is carried out for all ice types (including open water, but not multi-year or second-year ice). Note, therefore, that this analysis was done only for those cases in which there was only first-year ice. Since the thickness of second-year and multi-year ice was not known, it could not be taken into account in this analysis.
For this analysis, the ice thickness was taken as the maximum ice thickness for each ice type. This is not strictly correct, of course, but it was consistent for both the Predicted and Observed data. Thus, the values of ice volume calculated represent the maximum volume for both cases. Note that the volume is regarded as a dimensionless quantity since the aerial extent of the ice is not known.
Figure 17 and Figure 18 show the scatter plot and the histogram of the predicted versus the observed ice volume. In both cases, there is a clear indication that, on average, the predicted ice volume is higher than the observed ice volume. This suggests that since the ice concentration prediction is quite good, the ice thickness is overpredicted in many cases.
4.2.4 Prediction of Ice Types
An analysis was done to investigate the agreement between the identification of occurrences of three different ice features – old ice, decayed ice, and glacial ice. Table 5 shows the agreement between the observed (O) and predicted (P) features. The first two numerical columns show the agreement when both the observed and predicted are the same. The third and fourth numerical column show when there was not agreement between the predicted and observed ice features. Overall there is good agreement. However, it should be noted that there are many more cases where old ice and decayed ice where observed but not predicted. On the other hand, there are many cases where glacial ice was predicted but not observed.
Table 5 Comparison Between Predicted and Observed Ice Features
O_Yes / P_Yes O_No / P_No O_Yes / P_No O_No / P_Yes
Old Ice 79 143 49 12
Decayed 2 260 21 0
Bergy Waters 12 185 5 81
0 5 10 15 20 0 5 10 15 20
Predicted Ice Volume
Observed Ice Volume
First-year Ice only
Figure 17: Scatter plot of observed ice volume verus predicted ice volume for observations with first-year ice only (i.e. no old ice).
0 5 10 15 20 25 -20 -16 -12 -8 -4 0 4 8 12 16 20 Difference in Ice Volume
FREQUENCY (%)
Predicted - Observed First-year Ice only
underpredicted overpredicted
Figure 18: Histogram showing the agreement between the predicted and observed ice volume. In general, the ice volume is overpredicted.
4.2.5 Ice Numerals
The data can be used to predict the Ice Numeral using the ASPPR definition outlined in Section 1.0. This was done for 2 different cases:
1. where there was only first-year ice, and 2. with all ice types.
Figure 19 and Figure 20 show the scatter plot and histogram for the Ice Numeral for both the predicted and observed ice conditions for conditions where there is only first-year ice. In general there is good agreement between the predicted and observed Ice Numeral.
Figure 21 and Figure 22 show the scatter plot and histogram for the Ice Numeral for both the predicted and observed ice conditions for all ice conditions. There is reasonable agreement. However, on average the Ice Numeral is slightly overpredicted using the predicted ice conditions.
-20 -10 0 10 20 30 -20 -15 -10 -5 0 5 10 15 20 25 30 Predicted IN Observed IN
First-year Ice only
Figure 19: Scatter plot of the Ice Numeral (IN) based on the observed and predicted ice conditions. This data is based on observations with only first-year ice (i.e. no old ice).
0 5 10 15 20 25 30 35 -20 -16 -12 -8 -4 0 4 8 12 16 20 Difference in IN FREQUENCY (%) Predicted - Observed First-year Ice only
underpredicted overpredicted
Figure 20: Histogram showing the difference in the Ice Numeral using predicted and observed ice conditions. This data is based on observations with only first-year ice (i.e. no old ice).
-50 -40 -30 -20 -10 0 10 20 30 -50 -40 -30 -20 -10 0 10 20 30 Predicted IN Observed IN
All Ice Types
Figure 21: Scatter plot of the Ice Numeral (IN) based on the observed and predicted ice conditions for all ice types.
0 5 10 15 20 25 30 35 -35 -30 -25 -20 -15 -10 -5 0 5 10 15 20 25 30 35 40 Difference in IN Frequency (%) Predicted - Observed Overpredicted Underpredicted
All Ice Types
Figure 22: Histogram showing the difference in the Ice Numeral using predicted and observed ice conditions for all ice types.
4.2.6 Ice Numerals Within an Egg Code
Although Ice Charts are sub-divided into numerous regions depicting different ice regimes, there is, by necessity, still somewhat coarse resolution. With the current data, it is possible to investigate the local changes in the ice regime within a predicted uniform ice regime on an ice chart. This has been done by calculating the Ice Numeral from the observed ice conditions for a single egg code region. Figure 23 to Figure 29 show the variation of the Ice Numeral within an egg code region for 7 different cases (5 with a Type A vessel and 2 with a CAC4 vessel). From these figures, there are 2 things to note: 1. In most cases, the predicted Ice Numeral is a representation of the Ice Numeral
calculated using the observed ice conditions. However in one case, this was not the case.
2. There can be wide variations in the Ice Numeral within a single egg code region.
These observations illustrate the importance of continual monitoring of the Ice Numeral, even within an apparent uniform egg code region.
0 2 4 6 8 10 12 14 16 0 1 2 3 4 5 6 7 8 Events
ASPPR Ice Numeral
Observed Predicted
Type A
Figure 23: Graph showing the variation of the Ice Numeral within a single region egg code from an Ice Chart (Type A vessel; Case 1).
0 2 4 6 8 10 12 14 16 0 1 2 3 4 5 6 7 8 Events
ASPPR Ice Numeral
Observed Predicted
Type A
Figure 24: Graph showing the variation of the Ice Numeral within a single region egg code from an Ice Chart (Type A vessel; Case 2).
0 2 4 6 8 10 12 14 16 0 1 2 3 4 5 6 7 8 9 10 Events
ASPPR Ice Numeral
Observed Predicted
Type A
Figure 25: Graph showing the variation of the Ice Numeral within a single region egg code from an Ice Chart (Type A vessel; Case 3).
0 2 4 6 8 10 12 14 16 0 1 2 3 4 5 6 7 8 Events
ASPPR Ice Numeral
Observed Predicted
Type A
Figure 26: Graph showing the variation of the Ice Numeral within a single region egg code from an Ice Chart (Type A vessel; Case 4).
0 2 4 6 8 10 12 14 16 18 0 1 2 3 4 5 6 7 8 Events
ASPPR Ice Numeral
Observed Predicted
Type A
Figure 27: Graph showing the variation of the Ice Numeral within a single region egg code from an Ice Chart (Type A vessel; Case 5).
0 5 10 15 20 25 0 1 2 3 4 5 6 7 8 9 10 11 Events
ASPPR Ice Numeral
Observed Predicted CAC 4
Figure 28: Graph showing the variation of the Ice Numeral within a single region egg code from an Ice Chart (CAC4 vessel; Case 1).
-15 -10 -5 0 5 10 15 20 25 0 2 4 6 8 10 12 14 16 Events
ASPPR Ice Numeral
Observed Predicted CAC 4
Figure 29: Graph showing the variation of the Ice Numeral within a single region egg code from an Ice Chart (CAC4 vessel; Case 2).
4.3 Conclusions
Based on the data analysed here, it appears that the CIS ice predictions usually present a reliable description of the actual ice conditions. Although the predictions were not exactly accurate, there was no observable bias in the predictions.
An analysis of the variability of ice regimes within a single egg code “region” of an ice chart shows that, although the average conditions are correct, there can be considerable variability in the ice conditions within the region. Thus, the ice charts should not be solely used for calculating the Ice Numeral for tactical navigation. Continual on-board ice observations are an essential component for correct determination of the Ice Numeral.
The work presented in this section completes Tasks 5 and 6 of the 7 Tasks required for the scientific basis.
5.0 FUTURE WORK – TASK 7
Work will be done to define a methodology for further implementing the Ice Regime System. Discussions will take place with several key people who have experience with the current Ice Regime System. Their input and opinions will be solicited on the suggested changes to the definition of the Ice Numeral, both in terms of the reasonableness of the approach and the difficulties and hurdles that would be faced in introducing changes. Based on these discussions, the CHC will develop a proposal to put the Ice Regime System on a scientific basis. It will provide practical ideas for improvements in the application of the Ice Regime System, to make the system more accurate. It is intended that this proposal will act as a key focal point for discussion by all stakeholders.
6.0 REFERENCES
AIRSS 1996. Arctic Ice Regime Shipping System (AIRSS) Standards, Transport Canada, June 1996, TP 12259E, Ottawa. Ont., Canada.
ASPPR, 1989. Proposals for the Revision of the Arctic Shipping Pollution Prevention Regulations. Transport Canada Report TP 9981, Ottawa. Ont., Canada.
Canadian Gazette, 1996. Regulations Amending the Arctic Shipping Pollution Prevention Regulations. p 1729, Ottawa, Canada.
Johnston, M.E. and Gorman, B. 2000. Ice Regimes Encountered during the Transit of the USCGC Healy: 2 April to 25 April 2000. CHC/NRC Report HYD-TR-059, Ottawa, ON, Canada.
Timco, G.W. and Frederking, R.M.W. 1996. A Methodology for Developing a Scientific Basis for the Ice Regime System. National Research Council of Canada Report HYD-TR-009, TP-12789E, Ottawa, Canada.
Timco, G.W., Frederking, R.M.W. and Santos-Pedro, V.M. 1997, A Methodology for Developing a Scientific Basis for the Ice Regime System. Proceedings ISOPE’97, Vol II, pp 498-503, Honolulu, USA.
Timco, G.W. and Kubat, I. 2000. Scientific Basis for the Ice Regime system: March 2000 Update. CHC/NRC Report HYD-TR-048, Ottawa, ON, Canada.
APPENDIX A
1
G.W. Timco & I. Kubat
Canadian Hydraulics Centre National Research Council of Canada Ottawa, Ont. K1A 0R6
Canada
1. What problems can happen to a ship in ice?
2. What are specific examples of problems that have occurred that could be used for a deterministic development? (both damage & non-damage Events) 3. Would the current ice regime system have predicted these
problems?
4. If not, how can the problem conditions be better defined within the ice regime system?
5. Can the current ice detection methods identify the problem ice conditions?
6. If not, how can the ice detection systems be improved in a pragmatic manner to be able to detect the problem ice? 7. How can this information be communicated to the ship to
implement the Ice Regime System?
7 Tasks
1. Define Safety-Related Issues
2. Definition of Specific Problems with the Corresponding Environmental Conditions
3. Assess the Adequacy of the AIRSS
4. Definition of Problem Ice and Operation Conditions
5. Identification of Problem Ice Conditions
6. Improved Detection of Problem Ice
7. Implementation of AIRSS Context Diagram DATABASE INFORMATION ON SHIP DAMAGE DUE TO ICE TRANSPORT CANADA APPLICATION OF POLLUTION PREVENTION REGULATIONS EXPERIENCE FROM SHIP OPERATORS INTERNATIONAL EXPERIENCE KNOWLEDGE OF ICE PROPERTIES QUALITY AND TIMELINESS OF ICE INFORMATION
INTEGRATION OF SHIP AND ICE
2
The Ice Numeralis calculated from
where
IN = Ice Numeral
Ca= Concentration in tenths of ice type “a”
IMa= Ice Multiplier for ice type “a”
where Ice Multipliers are given by a Table of Ice Multipliers (which are different for different class of vessels)
If IN < 0, then the ship is not allowed to proceed
.... ] [ ] [ + + = CaXIMa CbX IMb
IN zInformation on damage obtained from several
sources (TSB database & reports; Norland/AKAC database; B. Wright; Braden Marine;
miscellaneous reports and papers)
zCHC Report lists 191 damage Events for different
vessel classes
zCategorized according to “Damage Severity”
Damage Severity (DS) Numbers
Damage Severity
Number Description
0 No damage
1 High measured stress
2 slight deformation of hull, denting, propeller 3 small puncture or fracture, extensive denting 4 large hole
5 vessel sank
Potential Pollution Damage (PPD) if DS = 3, 4 or 5.
Task 2Specific Problems with
Corresponding Ice Conditions
CHC Ice Regime Database
z“Event” defined as passage of a vessel through a specific ice regime
zContains 1125 Events related to occurrences of both damage (191
Events) and non-damage (934 Events);
zEvents obtained from Norlands damage database, TSB database
and reports, Braden Marine, ice regime verification trials, ship trials, Beaufort Sea experience, after-action reports, FedNav reports to TC, Canadian & Russian operational experience, miscellaneous damage Events;
zComprehensive - each specific Interaction Event is characterized by
79 fields that relate to vessel characteristics, route, climate, ice conditions and damage;