HAL Id: halshs-00461474
https://halshs.archives-ouvertes.fr/halshs-00461474
Submitted on 5 Mar 2010
HAL is a multi-disciplinary open access
archive for the deposit and dissemination of
sci-entific research documents, whether they are
pub-lished or not. The documents may come from
teaching and research institutions in France or
abroad, or from public or private research centers.
L’archive ouverte pluridisciplinaire HAL, est
destinée au dépôt et à la diffusion de documents
scientifiques de niveau recherche, publiés ou non,
émanant des établissements d’enseignement et de
recherche français ou étrangers, des laboratoires
publics ou privés.
Derivative Pricing and Hedging on Carbon Market
Marius-Cristian Frunza, Dominique Guegan
To cite this version:
Marius-Cristian Frunza, Dominique Guegan. Derivative Pricing and Hedging on Carbon Market.
2010. �halshs-00461474�
Documents de Travail du
Centre d’Economie de la Sorbonne
Derivative Pricing and Hedging on Carbon Market
Eric Paul Marius-Cristian F
RUNZA,Dominique G
UEGANDerivative Pricing and Hedging on Carbon Market
Eric Paul, Marius-Cristian Frunza
Structuring Department Sagacarbon, 67 rue de l’Université
Paris, France
e-mail: [email protected]
Dominique Guegan
PSE, CES-MSE,
University Paris 1 Pantheon-Sorbonne Paris, France
e-mail: [email protected]
Abstract- The aim of this work is to bring an econometric
approach upon the CO2 market. We identify the specificities of this market, and analyze the carbon as a commodity. We investigate the econometric particularities of CO2 prices behavior and their result of the calibration. We apprehend and explain the reasons of the non-Gaussian behavior of this market focusing mainly upon jump diffusions and generalized hyperbolic distributions. These models are used for pricing and hedging of carbon options. We estimate the pricing accuracy of each model and the capacity to provide an efficient dynamic hedging.
Keywords- carbon; EUA; options; estimation; pricing; hedging; NIG; jumps.
I. INTRODUCTION
Human activities, in particular the population growth and the development of industry over the last 200 years, have caused an increase in the emission and atmospheric concentration of certain gases, called ”greenhouse gases” (GHG) - primarily carbon dioxide and methane.
With its ratification by Russia in early 2005 the Kyoto protocol became an international law. According to its provisions, the industrialized countries have to reduce in the period 2008-2012 the greenhouse gas emissions by 5 percent with respect to the 1990 year levels. The protocol dictates the trading of emission allowances as one of the primary mechanisms through which greenhouse gas emission reduction should be achieved. Thus, the right to pollute is considered to be a tradable asset, with its price determined by the market forces of supply and demand.
In some recent works, few authors Benz [2], Daskalakis and Markellos [5],[6], Homburg [16] and Paolella [13] focused on the econometrical modeling of the GHG prices, underlying the particularities of this market like the non-Gaussian behavior, the auto-regressive phenomena and the presence of the convenience yield. In order to have an econometric view of the GHG market we calibrated European Union Allowances (EUAs) prices behavior using both Brownian and generalized hyperbolic models. We tested also the changing regimes hypothesis by integrating jumps in our diffusion models.
In this work we show some results concerning the economy of the carbon market from an analytical perspective, completely new for this market. Thus we will discuss:
• the econometric analysis of the carbon market; We show that generalizedhyperbolic family fit the best the carbon behavior,
• the theory of pricing under NIG distribution; We underline the importance of probability space change from the historical to risk neutral odds,
• the calibration of model for vanilla option pricing; We demonstrate that among few models benchmarked the NIG gives the best pricing,
• the dynamic hedging of carbon derivatives; We show the behavior ofdifferent dynamic delta hedging models.
II. CALIBRATION
We calibrated over the historical data for EUA prices (January 06-March 09) the following models:
• The geometric brownian motion
dS = Sμ dt + Sσ dB, (1) • The geometric brownian motion with mean
reversion
dS = Sα (ln(S)-μ) dt + Sσ dB, (2)
• The geometric brownian motion with jumps
dS =Sμdt + S σ dB (3)
with probability (1 – p) and
dS= S(μ + μsaut)dt + S σ dB1 + S σsaut dB2 (4) with probability p,
• The normal-inverse-gaussian process
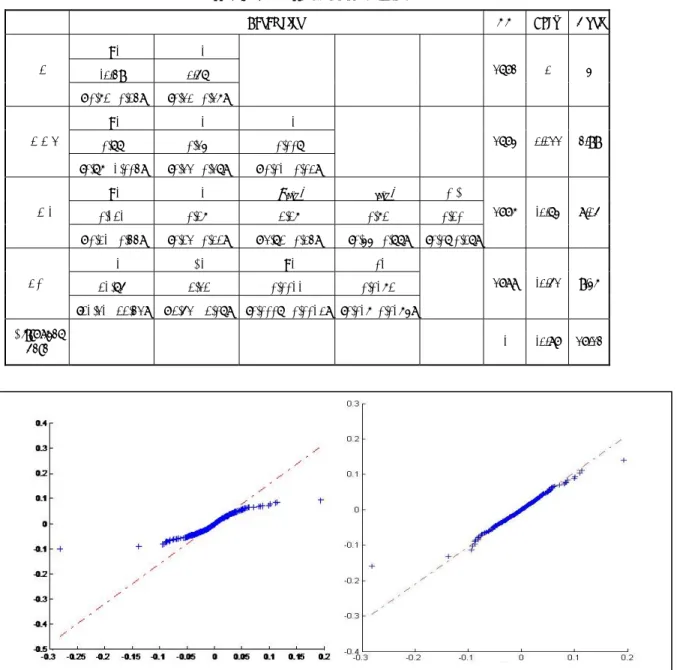
dS = SdNIG(α,β,μ,δ). (5) The results are summarized in Table I and they obviously lead to the conclusion that the NIG process is among the models estimated the best one for the dynamic of Log returns (the log likelihood is the greatest, the higher moments: Skewness and Kurtosis are the closest from those of the historical distribution). We also put the QQplot graphics in Fig. 1 for geometric brownian motion (left) and NIG (right) to underline the difference: the NIG process gives a fairly better estimation especially for huge variation values.
TABLE I. CALIBRATION RESULTS
Parameters LL Skew Kurt
GBM μ σ - - - 1672 0 3 -0.29 0.46 [-0.82 , 0.25] [0.43 , 0.48] GBMMR μ σ α - - 1673 0.011 2.99 0.99 0.46 -0.009 [0.98 , 1.005] [0.44 , 0.49] [-0.01 , 0.03] GBMJ
μ σ μsaut σsaut freq
1775 -0.63 8.04 0.121 0.28 -2.28 0.82 0.20 [-0.31 , 0.55] [0.24 , 0.32] [-4.92 , 0.35] [0.66 , 0.99] [0.09 0.29] NIG α β μ δ - 1788 -0.41 9.35 21.97 -2.42 0.0011 0.0182 [21.41 , 22.54] [-2.74 , -2.09] [0.0009 , 0.0013] [0.018 ,0.0186] Historical data - - - - - - -0.87 17.12
Figure 1. QQplot for geometric brownian motion (left) and NIG (right)
III. PRICINGVANILLAOPTIONS
We could now price European options thanks to Monte Carlo methods. We compare two dynamics (the BM and the NIG). We have added a drift to get the risk neutral probability (Bu [18])
dX= (r- 0.5σ2)dt+σdB (5)
dX=(r-µ+δ((α2-(β+1)2)0.5-(α2-β2)0.5))dt +dNIG (6)
With the few market prices for options that appeared in 2009, we compute different error statistics:
(
)
∑
∑
−
=
−
=
i i Observed i i Theoretic i Observedi i Observed i i TheoreticN
C
K
T
C
RMSE
C
C
K
T
C
N
ARPE
2 , , ,)
,
(
)
,
(
1
(7)TABLE II. PRICING ERROR RESULTS
Brownian Motion NIG
ARPE 0.5439 0.5235
RMSE 0.925 0.893
The error results shown in Table II on pricing are lower for the NIG process. This model gives better result for pricing.
IV. HEDGING
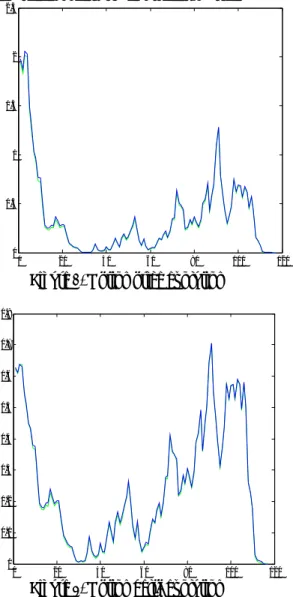
The NIG process gives better results for option pricing on carbon market, but while dealing with options it is also important to take a look at hedging. We consider a call option on EUA during the beginning of 2009 (January to mid-June) with strike 15 € and an initial spot value around 15 € . Here the results for the option price (Fig. 2) and delta (Fig.3) for the two models (geometric Brownian motion in green and exponential NIG process in blue).
0 20 40 60 80 100 120 0 0.5 1 1.5 2 2.5
Figure 2. Option price evolution
0 20 40 60 80 100 120 0 0.1 0.2 0.3 0.4 0.5 0.6 0.7 0.8
Figure 3. Option delta evolution
We assume that the seller of the option adopts a delta neutral hedging strategy and we compute the P&L of this option for our two models. And for a one million allowances position we get a result of -442 000 € for the geometric Brownian motion and -389 000 € for the exponential NIG. The results are negative because we took the estimated parameters (volatility) over the whole period instead of local implicit volatility in order to compare the results (NIG parameters are not local too). Once more, results are better for the NIG process.
V. CONCLUSIONS
We presented in this work some new results on the carbon market. We calibrated different models for the carbon price dynamic over the historical data and the generalized hyperbolic family (here the specific case of NIG process) lead to the best estimation even for the tail values. With a probability switch by adding a drift we got the risk neutral dynamic. Hence, we could price European options on CO2 with Monte Carlo methods. We compared the results with the market prices through the computation of error statistics and they support the NIG process that gives lower pricing errors than the Brownian motion. The hedging analysis of the two dynamics gives a best P&L for the NIG process even if the differences in deltas and prices are quite small (green and blue lines almost merged). All these results lead to consider the NIG process to be a really efficient way to model the EUA dynamic. Hence pricing derivatives with Monte Carlo methods on carbon market considering this dynamic is quite interesting.
ACKNOWLEDGMENT
The authors would like to thank to Sagacarbon CEO Stéphane Colin and to its President Pierre Ducret for the constant support for our research. We present our special recognition to Sagacarbon’s Risk Officer, Michel Mouren and to Didier Marteau for feeding us with precious feedbacks and remarks.
REFERENCES
[1] S. Truck, E. Benz, “Modeling the price dynamics of CO2 emission allowances”, Elsevier Science, 2008.
[2] O.E. Brandorff-Nielsen, “Processes of normal inverse Gaussian type” Finance and Stochastic 2, 1998.
[3] H. Liu, J.F. Jan, Y.P. Chang, M.C. Hung, “Testing symmetry of a NIG distribution”, Communications in Statistics Simulation and Computation 34, 2005.
[4] N. Markellos, G. Daskalakis, “Are the European carbon markets efficient”, Review of Futures Markets 17, no. 2, 103–128, 2008. [5] N. Markellos, G. Daskalakis, D. Psychios, “Modeling CO2 emission
allowance prices and derivatives: Evidence from European trading scheme”, Journal of Banking and Finance, 2009.
[6] N. Laird, D. Rubin, A. Dempster, “Maximum likelihood from incomplete data via the EMm algorithm”, Journal of the Royal Statistical Society 39 , 1–38, 1977.
[7] K. Prause, E. Eberlein, “The generalized hyperbolic model: Financial derivatives and risk management”, Bull. London Math. Soc. 10, 300– 325, 1998.
[8] E.S. Schwartz., “The stochastic behavior of commodity prices: Implications for valuation and hedging”, The Journal of Finance 52, no. 3, 923–973, 1997.
[9] J.D. Hamilton, “A new approach to the economic analysis of nonstationary time series and the business cycle”, Econometrica 57, no. 2, 357–384, 1989.
[10] R. Werner, A. Kalemanova, B. Schmid, “The normal inverse gaussian distribution for synthetic CDO pricing”, Risklab Germany, August 2005, unpublished.
[11] M. Roberts, C. Knittel, “An empirical examination of restructured electricity prices” Energy, Economics 27, no. 5, 791–817, 2005.
[12] L. Taschini , M. Paolella, “An econometric analysis of emission trading allowances”, Research papers 06-26, Swiss Finance Institute, 2006.
[13] M. Uhrig-Homburg, “Futures price dynamics of CO2 emission certificates - an empirical analysis”, University of Karlsruhe, 2007, unpulished
[14] W. Hu, “Calibration of multivariate generalized hyperbolic distributions using the em algorithm, with applications in risk management, portfolio optimization and portfolio credit risk”, Book, first ed., Florida State University, Florida, 2005.
[15] Y. Bu, Option Pricing Using Levy Processes, Chamlers University of Technology, Göteborg University, 2007, unpublished.