HAL Id: insu-00345154
https://hal-insu.archives-ouvertes.fr/insu-00345154
Submitted on 16 Feb 2009
HAL is a multi-disciplinary open access
archive for the deposit and dissemination of sci-entific research documents, whether they are pub-lished or not. The documents may come from teaching and research institutions in France or abroad, or from public or private research centers.
L’archive ouverte pluridisciplinaire HAL, est destinée au dépôt et à la diffusion de documents scientifiques de niveau recherche, publiés ou non, émanant des établissements d’enseignement et de recherche français ou étrangers, des laboratoires publics ou privés.
Influence of glass polymerisation and oxidation on
micro-Raman water analysis in alumino-silicate glasses
Maxime Mercier, Andrea Di Muro, Daniele Giordano, Nicole Métrich, Priscille
Lesne, Michel Pichavant, Bruno Scaillet, Roberto Clocchiatti, Gilles
Montagnac
To cite this version:
Maxime Mercier, Andrea Di Muro, Daniele Giordano, Nicole Métrich, Priscille Lesne, et al.. Influ-ence of glass polymerisation and oxidation on micro-Raman water analysis in alumino-silicate glasses. Geochimica et Cosmochimica Acta, Elsevier, 2009, 73 (1), pp.197-217. �10.1016/j.gca.2008.09.030�. �insu-00345154�
Influence of glass polymerisation and oxidation on micro-Raman
water analysis in alumino-silicate glasses
Maxime Merciera, Andrea Di Muroab, Daniele Giordanoc, Nicole Métricha, Priscille Lesned, Michel Pichavantd, Bruno Scailletd, Roberto Clocchiattia and Gilles Montagnace
aLaboratoire Pierre Süe, CNRS-CEA, CE-Saclay, 91191 Gif sur Yvette, France bLaboratoire PMMP, Université Paris VI, 4 Place Jussieu, 75005 Paris, France
cDipartimento di Scienze Geologiche, Università di Roma Tre, Largo Leonardo Murialdo, 1, 00154 Roma, Italy
dInstitut des Sciences de la Terre d’Orléans, Université d’Orléans, CNRS-INSU, UMR 6113, 1a rue de la Férollerie, 45071 Orléans, France
eLaboratoire des Sciences de la Terre, CNRS UMR5570 Ecole Normal Supérieure, 46 allée d’Italie, 69364 Lyon, France
Abstract
The development of an accurate analytical procedure for determination of dissolved water in complex alumino-silicate glasses via micro-Raman analysis requires the assessment of the spectra topology dependence on glass composition. We report here a detailed study of the respective influence of bulk composition, iron oxidation state and total water content on the absolute and relative intensities of the main Raman bands related to glass network vibrations (LF: ~490 cm−1; HF: ~960 cm−1) and total water stretching (H2OT: ~3550 cm−1) in natural glasses. The evolution of spectra topology was examined in (i) 33 anhydrous glasses produced by the re-melting of natural rock samples, which span a very large range of polymerisation degree (NBO/T from 0.00 to 1.16), (ii) 2 sets of synthetic anhydrous basaltic glasses with variable iron oxidation state (Fe3+/FeT from 0.05 to 0.87), and (iii) 6 sets of natural hydrous glasses (CH2OT from 0.4 to 7.0 wt%) with NBO/T varying from 0.01 to 0.76.
In the explored domain of water concentration, external calibration procedure based on the H2OT band height is matrix-independent but its accuracy relies on precise control of the focusing depth and beam energy on the sample. Matrix-dependence strongly affects the internal calibrations based on H2OT height scaled to that of LF or HF bands but its effect decreases from acid (low NBO/T, SM) to basic (high NBO/T, SM) glasses. Structural
parameters such as NBO/T (non-bridging oxygen per tetrahedron) and SM (sum of structural modifiers) describe the matrix-dependence better than simple compositional parameters (e.g. SiO2, Na2O + K2O). Iron oxidation state has only a minor influence on band topology in basalts and is thus not expected to significantly affect the Raman determinations of water in mafic (e.g. low SiO2, iron-rich) glasses. Modelling the evolution of the relative band height with polymerisation degree allows us to propose a general equation to predict the dissolved water content in natural glasses:
where CH2OT is the total water content (in wt%) dissolved in glass; TOTN represents the
computed ILF/IHF variation as a function of the calculated NBO/T and SM parameters; IH2ON is the H2O band height scaled to ratio of the reference bands; k is the linearity spectrometer response on the H2OT band in function of water content. The water concentrations of the reference glasses are reproduced using this equation with a standard deviation of 0.06 wt%. The adopted parameterisation provides a useful tool towards the characterisation of
composition dependence of micro-Raman procedures for silicate glasses. We show, based on the widest range of glass compositions so far investigated, that accurate evaluation of
dissolved water content is achieved by micro-Raman spectroscopy.
1. Introduction
Water, the main volatile constituent of magmatic and volcanic fluids, has a major influence on mantle partial melting (e.g. Litasov and Ohtani, 2007) and properties of natural alumino-silicate melts and glasses. Water dissolved as hydroxyl groups or molecular water in melts and glasses (e.g. Stolper 1982) affects their viscosity (e.g. [Dingwell et al., 1996], [Richet et al., 1996], [Whittington et al., 2000], [Giordano et al., 2004] and [Giordano et al., 2008]), and density (e.g. [Mysen and Virgo, 1980], [Mysen et al., 1980a], [Mysen et al., 1980b], [Persikov et al., 1990] and [Richet et al., 2000]); as well as phase equilibria, solubilities of metals
([Pichavant et al., 2002] and [Linnen, 2005]) and ultimately magma eruptive styles (e.g. [Di Muro et al., 2004] and [Giordano et al., 2008]). As a consequence, the accurate quantification of the amount of water dissolved in natural melts and glasses is the pre-requisite to an
appropriate analysis and modelling of magma properties and differentiation processes. The capability of micro-Raman spectroscopy to determine the total amount of water dissolved in natural and synthetic glasses and minerals has been recently demonstrated ([Thomas, 2000], [Arredondo and Rossman, 2002], [Chabiron et al., 2004], [Zajacz et al., 2005], [Behrens et al., 2006], [Di Muro et al., 2006a], [Di Muro et al., 2006b], [Severs et al., 2007] and [Thomas et al., 2008a]). Besides its accuracy, this technique allows the non-destructive analysis of small amounts of material and does not require long sample preparation. However, accurate water analysis in complex natural glasses, using micro-Raman spectroscopy, is still challenging because the composition dependence of analytical procedures is still poorly understood. Typically, the Raman spectra of a hydrous silicate glass show a broad band at ~3550 cm−1. This band occurs in both infrared (Stolper, 1982) and Raman (Mysen et al., 1997) spectra and represents the convolution of OH stretching vibration from hydroxyl groups and molecular water ([Stolper, 1982], [Pandya et al., 1992], [Mysen et al., 1997], [Chabiron et al., 2004] and [Di Muro et al., 2006a]). Accurate determination of absolute Raman heights or areas is
difficult and therefore Raman bands are conventionally normalised to one of the two main reference bands (LF or HF) of the silicate network. The low-frequency band (LF ~470– 570 cm−1) is linked to vibration of T–O° and the high-frequency band (HF ~950–1000 cm−1) to vibration of T–O− bonds where T refers to fourfold coordinated cations; O° to bridging oxygens and O− to non-bridging oxygens (e.g. [Wang et al., 1995] and [Mysen, 1999]). The determination of the total water content is based on the measurement of the absolute or normalised heights or areas of the H2OT band at ~3500 cm−1 following external or internal calibration procedures ([Thomas, 2000], [Chabiron et al., 2004], [Zajacz et al., 2005],
[Behrens et al., 2006], [Di Muro et al., 2006a], [Di Muro et al., 2006b] and [Severs et al., 2007]).
External calibration in which the area (A) or height (I) of the H2OT band is calibrated through the reiterated measurement of at least one hydrous reference glass ([Thomas, 2000] and [Di Muro et al., 2006a]) is the simplest way to determine the water concentration. This method minimises the compositional dependence but can be affected by either instabilities or errors inherent to the analytical conditions ([Behrens et al., 2006] and [Di Muro et al., 2006a]). The composition dependence of external calibrations is still under debate because of possible changes of molar scattering power of H2OT (Raman cross-section) with glass bulk
composition ([Thomas, 2000], [Behrens et al., 2006], [Di Muro et al., 2006a] and [Di Muro et al., 2006b]). On the other hand, internal calibration requires successively the scaling of the area (A*) or height (I*) of the H2OT band against the LF and HF silicate network bands, and the calibration of the ratios between the bands (H2OT/LF or H2OT/HF) against a set of hydrous reference glasses. This method overcomes the analytical bias, but is potentially composition-dependent because changes in glass structure affect the Raman spectra topology ([McMillan, 1984], [Mysen, 1988], [Mysen, 2007] and [Sharma et al., 1997]). Raman spectra of silica, alumino-silicate and iron-silicate glasses yield information about the covalently bonded, network-forming structural units in terms of Qn species, where n indicates the number of bridging oxygen. The structural effect of the network-modifying or charge balancing cations is indirectly derived from highly localised Raman bands of Qn species in the HF region (e.g. [Bell et al., 1970] and [Bell and Dean, 1972]). Hence, the net effect of bulk composition on the ILF/IHF ratio must be understood prior to any water determination using the internal calibration.
It is well known that the relative height of the LF and HF reference bands of the silicate network, decrease as the glass becomes more depolymerised ([Behrens et al., 2006] and [Di Muro et al., 2006b]). A very sharp decrease in the LF/HF height ratio (ILF/IHF) is observed when a small amount of network-modifying cations are added to high SiO2-rich natural glass (e.g. rhyolite) and the NBO/T (number of non-bridging oxygen per tetrahedron, Mysen, 1988) value increases from 0 to 0.10 (Di Muro et al., 2006b). In glasses with intermediate
compositions (0.1 < NBO/T < 0.4) (e.g. phonolites, trachytes, dacites, andesites) the ILF/IHF ratio decreases more smoothly (Di Muro et al., 2006b). In addition, the content of iron and the relative proportion between ferric and ferrous species can also affect the silicate melt
properties, its structure and the Raman spectra topology ([Mysen et al., 1980b], [Kushiro, 1982], [Dingwell and Brearley, 1988], [Dingwell et al., 1988], [Lange and Carmichael, 1990], [Wang et al., 1995], [Magnien et al., 2006] and [Di Muro et al., 2008]).
Here, we explore the respective influence of polymerisation, oxidation state and water content on the Raman spectra typology of natural silicate glasses in order to predict the composition dependence of micro-Raman calibration procedures for the accurate water determination. A method for such determinations is here developed for a wide range of glass compositions. ILF/IHF ratio and Raman spectra evolution have been systematically studied in (i) a series of natural anhydrous glasses covering the largest range of composition and degree of
polymerisation expressed with NBO/T (Mysen, 1988) and SM (structural modifiers, Giordano and Dingwell, 2003), parameters so far investigated; (ii) two sets of iron-rich basaltic glasses with variable Fe3+/FeT ratios (from 0.05 to 0.85, Bonnin-Mosbah et al., 2002) and (iii) six series of hydrous glasses covering a compositional range similar to that of the anhydrous glasses.
2. Methodology
2.1. Sample selection and characterisation
2.1.1. Anhydrous glasses
The first glass series that was investigated is composed of 33 anhydrous glasses, which cover most of the natural compositional range from strongly polymerised silicic glasses (i.e.
metaluminous rhyolite) to highly depolymerised alkaline mafic glasses (i.e. tephrite,
basanite). The glass compositions and their provenance are reported in Table 1a. All samples were obtained by re-melting natural rock samples at 1 bar and between 1400 and 1600 °C. Most glasses (22) are from Giordano and Dingwell (2003) and Giordano et al. (2006). In order to cover the widest compositional range of geological interest and to build up a very complete data base, we analysed eight additional glasses with variable degrees of
polymerisation (NBO/T from 0.00 to 1.16; SM from 8.1 to 43.6). These glasses are increasingly depolymerised and include a metaluminous rhyolite from Rattlesnake Tuff, Oregon (Robert et al., 2008) and another one from the New Berry obsidian lava flow in Oregon (University of British Columbia collection), iron-poor phonolites, a latite, an iron-rich phonolite and a tephri-phonolite (Giordano et al., 2007). Moreover, we synthesised two
depolymerised basanitic glasses (NBO/T = 0.74 and 0.77). These latter were prepared at ISTO (Orléans, France). Powders of natural scoriae from La Sommata cone (Vulcano, Italy) were fused at 1400 °C in air within Pt crucibles. In order to ensure the complete fusion of the sample, a melting cycle of 2 h was performed; then, samples were rapidly quenched in water. The homogeneity of each sample was tested by electron microprobe analysis.
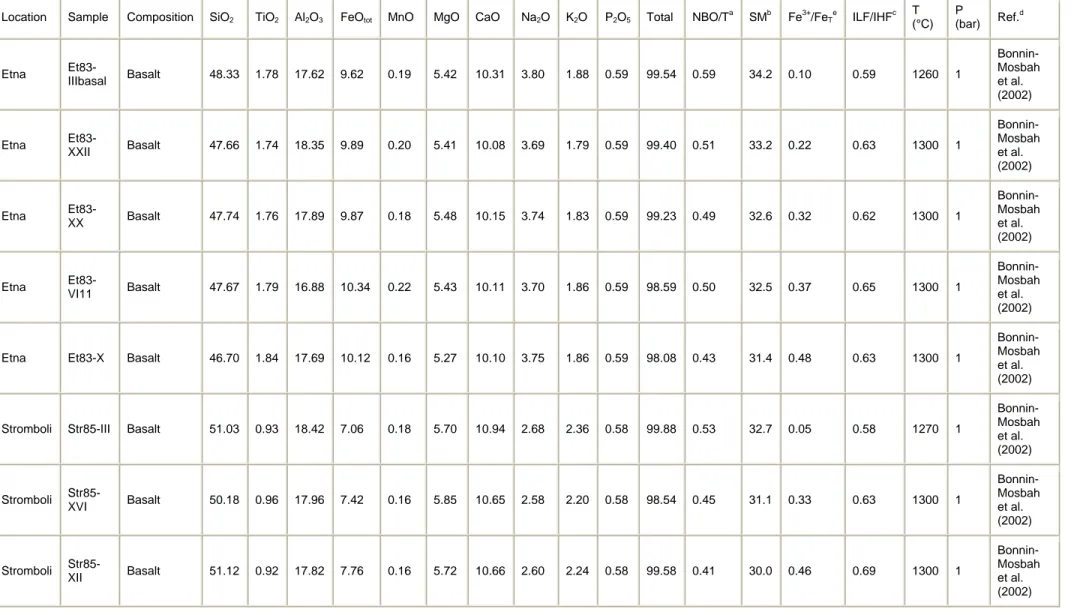
The second series is composed of anhydrous basaltic glasses with variable Fe3+/FeT ratios, where FeT = (Fe3+ + Fe2+). It includes basaltic glasses with Fe3+/FeT ratio varying from 0.098 to 0.480 (Etna basalts, Et83) and from 0.049 to 0.875 (Stromboli basalts, Str85; Table 1b). These glasses were obtained by melting powdered natural lava samples at 1260 and 1300 °C under variable fO2 conditions. They were previously studied by X-ray microspectroscopy at the Fe K edge (Bonnin-Mosbah et al., 2002) and micro-Raman spectroscopy (Di Muro et al., 2008).
2.1.2. Hydrous glasses
Four new sets of hydrous glasses were added to the two series of alkaline silicic hydrous glasses (iron-poor and iron-rich phonolites) that were previously studied (Di Muro et al., 2006a) and re-analysed in the present work. Their compositions and synthesis conditions are reported in Table 1c. The new series include silicic, highly polymerised glasses (3
metaluminous rhyolites from Turkey, Mexico and Italy) and three sets of depolymerised glasses (basalt from Mt Etna, basanite from La Sommata and tephrite from Vesuvius). The water content ranges from 0.5 to 7.0 wt% in polymerised silicic glasses and from 0.4 wt% to 5.3 wt% in mafic glasses. All hydrous glasses were synthesised at low pressure (0.2–2.1 kbar) in order to minimise the pressure effect on the glass structure and to allow comparison with the set of dry glasses synthesised at one atmosphere. For the purpose of this study, we
synthesised two water-poor basaltic glasses (Etna basalt) with 0.4 and 0.8 wt% of water content to extend the range of water concentrations available for Etna basalts, which included glasses with 1.27–3.04 wt% H2OT (Spilliaert et al., 2006) and a water-rich glass (4.95 wt% of H2OT; Lesne et al., submitted for publication). Seven basanitic glasses (La Sommata,
Vulcano) containing from 0.79 to 4.95 wt% of dissolved water were also synthesised. The synthesis experiments were conducted at ISTO (Orléans, France), using an Internally Heated Pressure Vessel (IPHV). The natural powdered samples from Etna and La Sommata were loaded into Au80-Pd20 capsules, to which adequate amounts of distilled water were added to ensure water-saturated conditions. The experimental charges were held at different pressures from 0.5 to 2.0 kbar and at 1200 °C for 5 h (Table 1c), and then were rapidly drop-quenched. The syntheses were performed under relatively oxidising conditions, with fO2 two log units higher than the solid buffer Ni–NiO (NNO+2). The capsules were weighted before and after experiments in order to check that no leaks occurred. The glasses were analysed in a
CAMECA SX 100 electron microprobe (Camparis, Jussieu, France) and their homogeneity was checked by analysing 2 to 4 fragments of each experimental charge with, on average, 15 analyses per fragment. Their water contents were determined by Karl Fisher Titration (KFT; ISTO-Orleans) with a relative error of ±5% and are homogeneous. Note that the hydrous tephritic samples from Vesuvius are partially crystallised, especially the water-poor sample (2.1 wt%). Scattering in Raman measurements is thus expected for this latter glass sample.
2.2. Raman spectroscopy
2.2.1. Analytical conditions
Raman scattering was excited using an argon ion laser at wavelength of 514.5 nm and measurements performed with a Labram HR800 spectrometer (ENS-Lyon) manufactured by Jobin-Yvon and equipped with a Peltier-cooled CCD detector. Glasses were analysed by focusing a ~1 μm-wide laser beam through an Olympus microscope in pseudo-confocal setting. In order to reduce the excitation volume of our pseudo-confocal system, we adopted a small confocal hole (100 μm) and focused through the objective with the highest
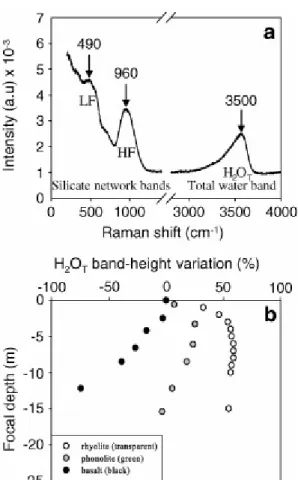
magnification (100×). Spectra were collected in the 180–1400 cm−1 (aluminosilicate network domain) and 2800–4000 cm−1 (OH + H2O domain) shift ranges relative to the exciting laser light (Fig. 1a). A grating of 600 grooves/mm was used to cover each domain in one scan. These running conditions result in moderate resolution (±4 cm−1), but in an intense signal even for short counting times. Average laser power was about 200 mW and was reduced to 20 mW by 1/10 filtering. All spectra were obtained with the same optical configuration and 7 to 10 analyses were performed for each sample and averaged.
Laser excitation of iron-bearing (dry and hydrous) samples can result in effects ranging from local heating and oxidation up to melting and water-loss ([Behrens et al., 2006] and [Thomas et al., 2008b]). In order to minimise these effects, we choose short counting times (3 × 30 s) and low laser power on samples (7.4 mW). Laser power was periodically checked and slightly tuned to guarantee constant energy on all samples. No melting or water-loss was detected during the analyses. Tests were performed in order to check for possible glass heating in dark samples at increasing counting times and excitation energy. No heating or oxidation effects were detected for the adopted analytical conditions. Dry and hydrous internal standards were periodically analysed at the beginning of every analytical session to correct the dependence of band intensities on delivered energy. The correction was always less than 5%.
Maximum and relative intensities of the Raman bands vary with focusing depth of the laser beam (Behrens et al., 2006). Height variation of the total water band with focal depth as a function of glass absorptivity is reported in Fig. 1b. In colourless glasses, height increases parabolically by about 60% in the first 5 μm, attains a maximum between 6 and 8 μm, and then markedly decreases at depths >15 μm. Absorption effects are clearly visible in coloured glasses, in which the increase in height is less pronounced and attains a maximum value at shallower depths relative to colourless glasses. Absorption is so strong in dark glasses that Raman band height decrease immediately when focusing inside the samples (Fig. 1b). In order to compare the absolute and relative height of Raman bands in our glasses, which span a very broad range of absorptivity, we focused the laser spot on the sample surface. Typical focusing uncertainty is estimated to be <2 μm and it strongly changes the band height. However, the band ratios are only affected to a minor degree (<0.5%).
2.2.2. Band assignment
Raman spectra of studied glasses exhibit two main characteristic regions (Fig. 1a): a low-frequency region (LF: ~200 to ~600 cm−1) and a high-frequency region (HF: ~800 to
1200 cm−1). The same regions occur in synthetic analogues of natural glasses (Mysen, 1988). In synthetic analogues, the LF envelope is traditionally interpreted as the convolution of delocalised modes of vibration mostly related to: (i) symmetric stretching vibrations involving bridging oxygen (O°) °O–T–O° relative to almost stationary fourfold coordinated cations (T) in the TO4 rings, where T = Si, Al and subordinately; to (ii) rocking motion in fully
polymerised units (Q4); (iii) vibration of T against its tetrahedral cage with slight
displacement of oxygen; (iv) T–O–T bending (in glasses containing non-bridging oxygen O−); and (v) the so-called “defect bands”, possibly related to breathing modes of four- and three-ring structures of TO4 tetrahedra ([Mysen and Virgo, 1980], [Furukawa et al., 1981], [Sharma et al., 1981], [Galeener, 1982a], [Galeener, 1982b], [Matson et al., 1983], [McMillan, 1984], [McMillan et al., 1995] and [Pasquarello and Car, 1998]). With increasing depolymerisation of glass networks the LF Raman band maximum shifts to higher frequency irrespective of network-modifying cations, and therefore the position of the LF band correlates with the degree of depolymerisation of the silicate network (e.g. Matson et al., 1983).
The HF envelope is typical of NBO-bearing glasses, it is very weak in silica glass and it has been interpreted as the convolution of bands related to symmetric T–O stretching vibrations of units with variable numbers of bridging oxygen (Qn: n being the number of BOs) (e.g. Furukawa et al., 1981). Moreover, entry of several types of T cations in a given Qn unit results in distinct bands. For instance, the doublet at 1050 and 1100 cm−1 is thought to originate from two types of Q3 species Al–O–Si and Si–O–Si, respectively, and the frequency of the Al–O– Si mode decreases with increasing Al content of the glass ([Matson et al., 1983] and [Sharma et al., 1983]). A line at ~980 cm−1 is observed in dry feldspatic and rhyolitic iron-bearing glasses and has been attributed to anti-symmetric coupled mode of Fe3+O4–SiO4 tetrahedra ([Wang et al., 1995] and [Di Muro et al., 2008]). The HF band is thus highly sensitive to changes in the relative proportions and speciation of network-forming cations such as Si, Al, and Fe.
The high frequency range of hydrous glasses is characterised by a broad asymmetric band which peaks at ~3550 cm−1 (Fig. 1a). The position and topology of the H2OT envelope evolves with water content, water speciation (H2Om/OH) and the strength of H-bonding
2.2.3. Data treatment
Measured Raman scattered intensity (I(ν)) is frequency- and temperature-dependent. In particular, the intensities of the low-frequency bands are strongly influenced by the intense Rayleigh line (elastic scattering) at 0 cm−1 with respect to the bands in high-frequency
domain. However, there is no consensus on the method for Raman spectra treatment (baseline fitting and correction for the dependence of Raman scattering on frequency).
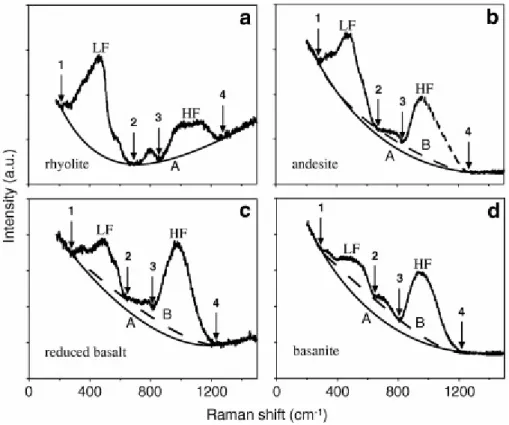
In a first step, we examine the influence of the baseline fitting of uncorrected spectra on the calibration and quantification of the silicate glass water content. Fig. 2 shows the uncorrected Raman spectra of natural glasses with increasing iron content, NBO/T and SM values for rhyolite to basanite. The choice of a cubic baseline is quite straight forward for low NBO glasses (Fig. 2a). However, an increase in NBO strongly affects the topology of the
intermediate region and the ILF/IHF ratio (Fig. 2b–d). This effect challenges the baseline fit that was performed with two distinct cubic baselines. Cubic baseline A (solid curve) is drawn between the two spectra extremities (180–280 and 1230–1600 cm−1 domains) where no signal occurs (Fig. 2a–d). However, the concave nature of the A-type baseline is highly sensitive to the length (Fig. 2a vs. c) and topology (Fig. 2c vs. d) of the fitted background. We thus imposed another “invariant” domain (~600–650 cm−1) to fit the background of Fe-bearing glass spectra with the cubic baseline B. The latter provides a good baseline fit that applies to Fe-rich glasses when oxidised (Fig. 2b and d), as it also defines a fourth “invariant” domain (~850 cm−1). This latter domain cannot be considered in the case of glasses having high ferrous iron content that gives rise to a shoulder in this domain (Fig. 2c) as detailed in Di Muro et al. (2008). The two baseline models produce marked differences in the topology of the extracted bands with increasing NBO/T or decreasing Fe3+/FeT (Di Muro et al., 2008). The band height ratio (ILF/IHF) in highly depolymerised basanite glasses is reduced by 20–30% when fitting the background with a B-type cubic baseline. However, the height of the most intense reference bands (LF in low NBO/T glasses and HF in high NBO/T glasses) is only moderately affected by baseline choice. In the present work, the background of all our Raman spectra was fitted using the B-type cubic baseline.
Several researchers have stressed the need to recalculate the raw I(ν) spectra to a reduced format R(ν) for all quantitative Raman studies (for a review, see Faurskov Nielsen, 1996), as proposed by Long (1977):
where ν0 is the frequency of laser excitation line in cm−1, νi the frequency of Raman shift, h
Planck’s constant, c light velocity, k Boltzmann’s constant and T the sample temperature. Thus, in a second step we examine the effect of such correction on data treatment. One advantage of the Long correction is that it applies to a much broader spectral range with respect to most reductions that are invalid at wavenumbers >200 cm−1. The reduction
procedure eliminates the effect of the Rayleigh line by converting its wing (>50 cm−1) into a weakly declining plateau in the studied spectral range. After correction, (a) weak low-frequency spectral features can be identified and characterised, (b) the intensities are proportional to the intrinsic molar scattering activity for a given Raman process and (c) baseline treatment and spectral deconvolution are easier. Actually, cubic (Di Muro et al., 2008) and linear (Behrens et al., 2006) baselines can be used for background fitting of Long-corrected spectra. However, the Long-correction method with cubic baseline fitting does not
improve significantly our water calibration for depolymerised glasses, as detailed further and already pointed out by Behrens et al. (2006). Accordingly, our data treatment was done without Long-correction.
Now, we examine the data treatment of hydrous glasses showing the H2OT band at
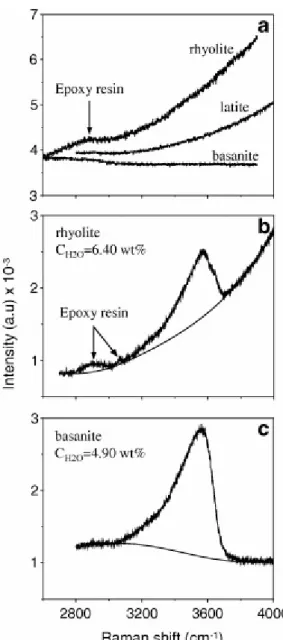
3500 cm−1. In resin embedded glass chips, the background topology is strongly dependent on glass absorptivity and shows the highest inclination in rhyolite because of fluorescence from underlying materials (Fig. 3a). This effect is particularly prominent in our pseudo-confocal system. In all analysed glasses, the background is better fitted by a cubic baseline (Fig. 3b and c). The background of the H2OT band is possibly approximated using a linear function
([Thomas, 2000] and [Severs et al., 2007]) only in some highly absorbing iron-rich glasses.
3. Modelling of calibration procedures
In this section, we review some general considerations about calibration procedures for the Raman quantitative determination of water (as iron species and others) in glasses. We identify the main parameters which control the compositional dependence of the calibration methods and quantify their effects.
In Raman spectroscopy, H2OT is assumed to be a proxy for the total hydrogen dissolved in glasses in the form of multiple OH− and H2O species. The simplest calibration procedure is based on the measurement of the height of the total water (H2OT) band that can be written as:
I
H2OT=k×C
H2OT+q
with k = I0 × K(ν) × σ where I0 is the laser power exciting the sample, K(ν) is a response function of optics and spectrometer, σ is the molar scattering power of water integrated in the observation sphere (integral cross-section), q is the focusing systematic error (Fig. 1b) and C is the total water weight concentration. Eq. (1) is valid if the laser beam is focused on the sample surface, only.
Using the external calibration procedure Eq. (1) reduces to
This equation is valid if q is zero (no focusing errors) or if the focusing error is identical on both the unknown and the standard (qsamp = qstd), and if the compositions of both the unknown sample and standard are closely similar owing to the dependence of the scattering cross-section σ on glass composition. Furthermore, external calibration requires an accurate determination of the H2OT band height on both the standard and the unknown sample. Using internal calibration overcomes possible focusing bias. In such a procedure, the height of the H2OT band is scaled to that of a reference band (RB, e.g. the LF or HF bands of glasses):
where IRB is the height of the reference band (LF or HF) in the hydrous glass, in
anhydrous glass, and m is the parameter sensitive to the effect of water (or other species) on glass polymerisation and thus on . In this equation, the compositional dependence arises from: (i) the possible dependence of H2OT cross-section and speciation on the glass
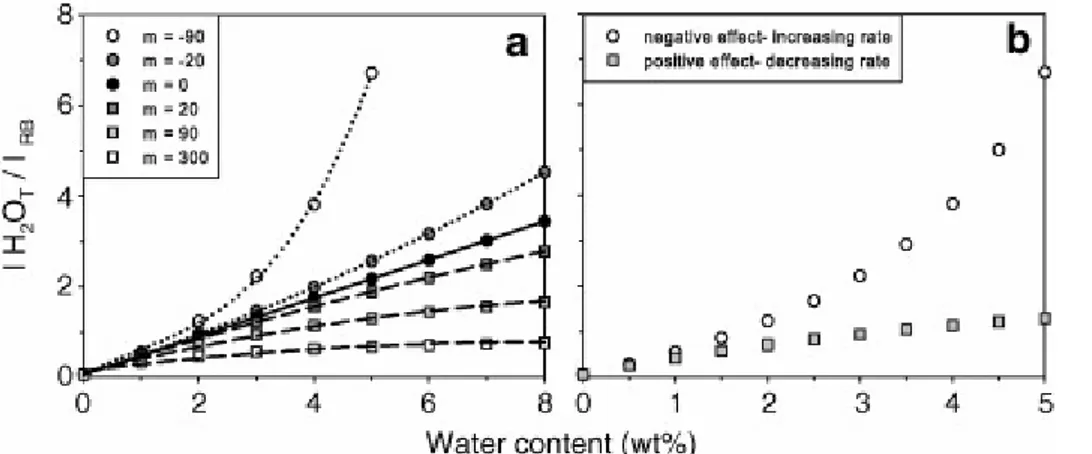
composition; (ii) the change of with glass bulk composition; and (iii) the possible intensity variation of the reference band with total water content, for a given bulk composition. In a given set of reference glasses, IRB changes with increasing H2OT
concentration because of the well-known influence of dissolved water on glass structure. A decrease of IRB has the most drastic effect on the calibration curves (i.e. m = −90; Fig. 4a). Hence, non-linear calibration established on an incomplete set of reference glasses can result in apparent lines that intercept one of the diagram axes. Moreover, the parameter m is
sensitive to the dissolved water concentration in our experimental range (0–7 wt%), the water speciation and its relative effect on glass structure (as ferric iron content). The occurrence of these phenomena can be detected as clear kinks in the evolution of the IH2OT/IRB with
increasing water whose shape again will depend on the decreasing or increasing effect of water on IRB (Fig. 4b). The application of the internal procedure to the analysis of an unknown clearly requires that the sample has a bulk composition as close as possible to that of the standard ([Behrens et al., 2006] and [Di Muro et al., 2006a]) and that the dissolved analyte has only minor effect on glass structure in the concentration range of interest.
In a previous work, we have shown that the height ratio between the two main reference bands observed in Raman spectra of natural alumino-silicate glasses decreases with increasing depolymerisation (Di Muro et al., 2006b). We can, therefore, rearrange Eq. (3) in the form:
The function f that describes the evolution of the ILF/IHF ratio with a structural/compositional parameter such as NBO/T or SM is derived in the following paragraphs. This approach allows us to either define calibration lines adapted to the unknown composition on the basis of the only knowledge of the parameter k (Eq. (4)) or to calculate the water concentration in an unknown glass sample as:
In this last case, an iterative procedure is required to adjust the structural parameter to the estimated water content.
4. Spectral evolution with bulk compositions
In our study, the influence of the bulk sample composition is expressed through two different composition-dependent parameters, NBO/T and SM, commonly used to represent, at a first approximation, the degree of polymerisation of the silicate framework.
For dry glasses, these parameters were tentatively calculated assuming that all Fe3+ acts as a network-former cation and Fe2+ as a network-modifier. It is however known that, in highly depolymerised silicate melts, Fe2+ could act as network-former (Cooney and Sharma, 1990). We also assumed that half of the FeOtot (in wt%) partitions as FeO and the other half as Fe2O3, that implies a nearly constant [Fe2O3/(FeO + Fe2O3)] mass ratio value of about 0.5. The latter value is realistic and fits with the average iron oxidation state of most of the synthesised anhydrous glasses (D. Giordano). Note a deviation from this value of 0.5 may introduce scattering at intermediate values of NBO/T and SM (e.g. Fig. 6). Instead, we used the measured ferric/ferrous ratios in the case of the two basaltic glass sets having variable oxidation state.
For hydrous glasses, the structural parameters were calculated for “dry” composition in order to allow a quick comparison in terms of bulk compositions between hydrous and dry glass sets.
4.1. Composition influence in anhydrous glasses
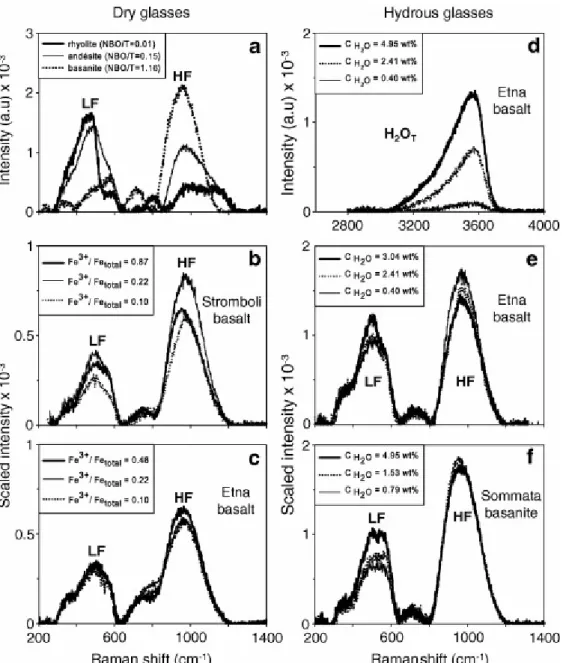
Fig. 5a shows the general evolution of the HF and LF bands related to vibrations of the glass network for three variously depolymerised melts from rhyolite to basanite. With increasing depolymerisation, the LF band broadens, shifts to higher frequency and decreases in height. In our glass set, the position of the LF band progressively shifts from 485 to 500 cm−1 in glasses with NBO/T ranging from 0.01 to 0.15. The LF band broadening with increasing NBO/T is mostly due to the increase in intensity of a mode at ~ 580 cm−1. This mode prevails in highly depolymerised basanitic and tephritic glasses (0.5 < NBO/T < 1.16). Whilst the LF height decreases, the height of the HF envelope increases and the massif shifts to lower frequency. In Si, Al-rich and iron-poor rhyolitic glasses, the HF envelope peaks at 995–1030 cm−1 and has a marked shoulder at 1100–1150 cm−1. With increasing NBO/T and total iron content, the low-frequency side of the HF envelope becomes increasingly intense and the band position moves at 950–960 cm−1. With a change from low- to high-NBO/T in glasses, the intermediate band shifts from 800 to 700 cm−1. The observed trend from rhyolite to basanite is coherent with progressive depolymerisation of the glasses and increasing amounts of iron in the silicate network. The increase in height and negative shift of the HF band essentially reflect the augmentation of Qn units with low n and the enhanced presence of iron in fourfold
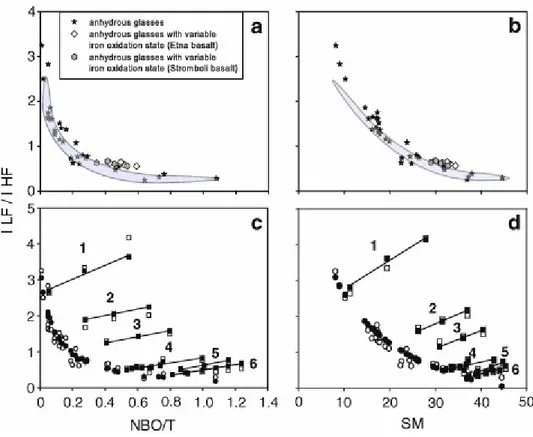
coordination. The ILF/IHF ratio exponentially decreases from 3 to 2 in low NBO/T rhyolitic glasses and down to 0.6–0.3 in high NBO/T mafic basanites and tephrites (Fig. 6a). The rate of decrease is very abrupt in the NBO/T range 0–0.1, while the ILF/IHF ratio becomes almost constant in high NBO/T glasses. A comparable but smoother global evolution is observed when considering the ILF/IHF ratio evolution as a function of SM (Fig. 6b). We observe the same feature when the area ratio (shadowed area) is considered. The adoption of the SM parameter to describe the structural changes reduces the standard deviation from the general trend to <10%. The main difference between height and area ratios is found in highly polymerised glasses, the determination of band areas resulting in smaller increase of ILF/IHF ratio with decreasing NBO/T or SM (Fig. 6a and b). On the basis of the observed trends, the LF envelope is the ideal reference band for internal calibrations for glasses with NBO/T < 0.2
such as rhyolites, trachytes, iron-poor phonolites, dacites, andesites and latites. Conversely, the HF envelope becomes a potential reference band for more depolymerised
(0.2 < NBO/T < 1.1) intermediate and mafic glasses. Moreover, on the basis of the decrease in the ILF/IHF ratio we can expect a significant effect of bulk chemical composition on internal Raman calibrations in polymerised glasses with NBO/T < 0.2 and a reduced composition dependence at higher NBO/T.
4.2. Influence of iron oxidation state
As discussed above (Section 2.2.2.), the glass iron oxidation state potentially affects the Raman spectra topology and particularly the HF envelop. We have thus explored such an effect by analysing the two sets of anhydrous basaltic glasses with variable [Fe3+/FeT] ratios, significantly differing in their NBO/T and SM values. Both parameters decrease with addition of increasing amounts of Fe3+, assuming that this species acts as a network-former, while Fe2+ plays essentially a role of network modifier (Table 1b). The NBO/T and SM values vary, respectively, in the range 0.35–0.53 (>33%) and 28.9–32.7 (~13%) in the Stromboli glasses and 0.43–0.59 (>37%) and 31.4–34.2 (~10%) in the Etna samples. Raman spectra of these basalts reveal only minor changes in band position, shape and height. The evolution of the spectra topology as a function of iron oxidation states is small for both glass sets, although some modifications are noticed in the Stromboli basalt (Fig. 5b and c). The LF and HF band positions remain fixed at 497 ± 4 cm−1 (LF of Str and Et sets) and 972 ± 4 cm−1 (HF of Et set) in the Fe3+/FeT ratio range 0.05–0.50. Only the HF band of Str glasses is affected by a
negative shift of 40 cm−1 (from 997 to 959 cm−1) in the Fe3+/FeT range 0.05–0.87 (Fig. 5b). In Stromboli glasses, moderate broadening of the LF band occurs with increasing Fe3+/FeT ratios because of the intensity increase of a shoulder at about 560 cm−1.
The relative heights of LF and HF envelopes linearly increase in the Fe3+/Fe
T ratio range 0.05–0.46 and then remain constant in more oxidised glasses (Table 1b). An increase in ILF/IHF ratio of 19–22% is measured in the basaltic glass (Str, Et) sets. Increase of the ILF/IHF ratio in the basaltic glasses with decreasing NBO/T or SM produces only a slight
displacement of their representative points along the general trend evolution of the dry glasses (Fig. 6a and b). These results support the idea that in natural mafic glasses, bulk composition rather than the iron oxidation state controls the main evolution of the topology of Raman spectra. Instead, noticeable evolution of the Raman spectra topology and a strong linear increase of the ILF/IHF ratio has been demonstrated by Magnien et al. (2006) in Al-free synthetic mafic glasses (NBO/T: 1.9–1.2) in the SiO2–CaO–MgO–Na2O–FeO system and in natural iron-rich peralkaline rhyolites (Di Muro et al., 2008). The reduced sensitivity of the Raman spectra recorded in our natural basaltic glasses with respect to iron oxidation state could be explained by the competition between Al and Fe as network formers. The absence of Al in the system studied by Magnien et al. (2006) is likely to favour stronger and faster variation of the glass structure as a function Fe3+/FeT ratios.
4.3. Influence of water content on Raman spectra
4.3.1. The OH–H2O stretching domain (3000–4000 cm−1)
In all water-bearing glasses, increasing the amount of dissolved water induces a change in the peak position, height, area and the shape of the OH-stretching band. That also introduce proportional increase of both height and area of the H2OT band (Fig. 5d).
Increasing OH/H2Om ratios and H-bonding strength from high to low hydrated glasses likely
control the topological evolution of this band ([Chabiron et al., 2004], [Zajacz et al., 2005], [Behrens et al., 2006] and [Di Muro et al., 2006a]). Decreasing H2OT concentration, in the range between 7–5 and 1.2 wt% causes a small positive shift of 10–20 cm−1 with respect to 3550 cm−1 in all glass sets except the Fe-rich “Pollena” phonolite for which the shift is larger (30 cm−1) within a more restricted range of dissolved water content (H2OT: 6.7–2.5 wt%). In water-poor glasses (<1.2 wt%), a different evolution is observed. With decreasing water concentrations the shift becomes slightly negative from 3570 to 3560 cm−1 for a H2OT content varying from 0.8 to 0.4 wt% in the basaltic Et glasses. Larger negative shifts and evolution from uni- to poly-modality of the H2OT band were already reported for water-poor (<0.9 wt%) phonolites (Di Muro et al., 2006a) and rhyolites (Arias et al., 2006). In the present study, the occurrence of polymodality with decreasing H2OT content has not been observed in the mafic glasses and the H2OT band always defines one asymmetric band. Finally, the asymmetric H2OT band of water-rich glasses (7–5 wt%) of rhyolitic, basaltic, tephritic and basanitic composition peaks at 3550–3570 cm−1, while its position is shifted to a lower frequency (3500–3510 cm−1) in phonolites.
4.3.2. The silicate network domain (180–1300 cm−1)
The evolution of the Raman spectra topology with H2OT contents in natural silicic glasses (rhyolites and phonolites) has already been described in detail in (Di Muro et al., 2006a) and (Di Muro et al., 2006b). Following these authors, the topology of both LF and HF envelopes in the most polymerised systems (rhyolites) undergoes pronounced changes with increasing water contents. The aspect ratio (height/half-width) of the LF band increases, and its position displays a marked positive shift, possibly related to a decrease in the average T–O–T angle (McMillan and Remmele, 1986). The relative proportions of the bands forming the HF envelope changes with a strong increase of a line at ~910 cm−1, possibly related to the formation of T-OH units (Zotov and Keppler, 1998).
Here, we focus on the topological evolution of the three available sets of hydrous mafic glasses (Etna basalt, Vesuvius tephrite and Sommata basanite). Topological effects of increasing amounts of H2OT differ in the three glass sets.
In the Etna basalt set, the height of the LF envelope increases when water contents increase from 0.4 to 3.04 wt% whereas the HF envelope decreases (Fig. 5e). Both in the HF and LF domain, the height variations can be observed with no frequency position changes (LF: 505 cm−1; HF: 967 cm−1).
In the Vesuvius tephrite (not shown here), both LF and HF envelopes decrease in height with increasing H2OT. The decrease of the LF massif is associated with an increase of the height ratio between the 490 cm−1 band and its shoulder at 560 cm−1. As in the Etna basalt set, these two main bands are not affected by any shift and peak at 491 cm−1 for the LF band and 955 cm−1 for the HF band.
In the Sommata basanite series, the LF height envelope increases with increasing H2OT (Fig. 5f). This variation is associated with an increase in height of the 550 cm−1 shoulder. In the glass with the highest water content (4.95 wt%), the 490 and 550 cm−1 bands are split and form a distinct doublet on the LF envelope. The HF height decreases only slightly and its position remains fixed at 964 cm−1.
As shown above, the ILF/IHF ratio is positively correlated with glass polymerisation. The dissolution of increasing amounts of water, a potentially depolymerising agent, produces a counterintuitive linear increase in the ILF/IHF ratio in all glass sets (Fig. 6c and d). As already observed by Giordano et al. (2008), this pattern suggests that, although water is normally considered to act as a network modifier, it plays a somewhat different role in the structure of the silicate melts relative to other network-modifying cations. However, the rate of ILF/IHF increase per weight percent dissolved H2OT depends on the initial (dry) glass degree of polymerisation as it increases from 15–16% in silicic glasses to 32–46% in mafic glasses (Table 1c). The observed spectra evolution in the less depolymerised glass set of mafic glasses (Etna basalt) closely resembles that found by Mysen and Virgo (1980) in synthetic soda-melilite glasses (NaCaAlSi2O7·H2O). These authors explained the shape evolution and height decrease of the HF band as the effect of water dissolution to form OH groups
associated with Si4+ and modification of the ratio between Q4 and Q3 units. Spectra deconvolution of the most depolymerised glasses (tephrite and basanite) reveals that the observed height changes of the LF and HF bands are mainly controlled by two components at 570 and 1000 cm−1. The intensity of the high-frequency side of the LF envelope has
classically been correlated with glass depolymerisation (Mysen, 1988). The band near 1000 cm−1 has been attributed to T-OH stretching ([Stolen and Walrafen, 1976], [Mysen and Virgo, 1980] and [Mysen et al., 1980a]). Hence, our data suggest that the proportion of water dissolved as silenols (T-OH) decreases with increasing glass depolymerisation.
4.4. Prediction of I
LF/I
HFratio
Fig. 6a and b show the evolution of ILF/IHF ratio for anhydrous glasses that can be easily predicted by using simple expressions. In particular, the variation of the ILF/IHF ratio as a function of the NBO/T and the SM parameters (f(NBO/T;SM) of Eqs. (4) and (5)) can be expressed by equations of the following form:
and
where SMdry and NBO/Tdry are the values of polymerisation degree parameters for dry compositions and a, a1, a2, b, b1, b2 are the adjustable parameters.
On the other hand, Fig. 6c and d show the evolution of the ILF/IHF ratio measured in glass samples having variable amounts of dissolved water (i.e. from anhydrous to about 7 wt%). The evolution of the ILF/IHF ratio for the whole range of anhydrous and hydrous composition investigated here can be predicted using the Eqs. (8) and (9), as it follows:
and
where A1, A2, B1, B2, C1, C2, D1, D2, E1, E2, F1, F2 are adjustable parameters as reported in Table 3; NH2O (in mole%) is the amount of water dissolved in the glass and SMdry and NBO/Tdry are calculated values as at Eqs. (6) and (7).
There is an excellent agreement between the measured and the predicted values of the ILF/IHF ratio. This ratio also increases with addition of water and it is positively correlated with the values of the NBO/T and SM parameters. The following expressions of the f(NBO/T; SM) are used to describe the ILF/IHF ratio variation also as a function of water content.
5. Influence of spectral treatment and glass composition on micro-Raman
calibration procedures
5.1. Effect of spectral treatment
In this section we consider the effects of data correction and band characterisation (area or intensity) on the linearity and composition dependence of the calibration lines for the determination of the water content in depolymerised glasses.
5.1.1. Uncorrected vs. Long-corrected spectra
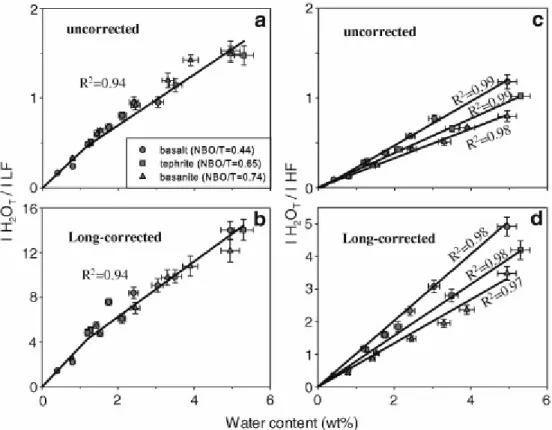
Fig. 7 shows the calibration curves for water determination in mafic glasses based on raw and Long-corrected band heights. The calibration curves have much steeper slopes when using Long-corrected data than uncorrected raw data using both LF (Fig. 7a and b) and HF (Fig. 7c and d) as internal calibration reference bands. Moreover, the slope variation and splitting are more pronounced when using both the Long-corrected data treatment and the HF band for H2OT normalisation (Fig. 7c and d). Instead, a single calibration curve fits our data points for mafic glasses having water contents between 1 and 5 wt% when LF is selected as the
reference band (Fig. 7a and b). A clear kink is observed in Fig. 7a and b for low water contents (<1 wt%) because of the non-linear increase of IH2OT/ILF ratio with water content as discussed above. In contrast, calibration curves for which the H2OT band is normalised to the HF band converge to the axis origin (Fig. 7c and d).
5.1.2. Comparison between area- and intensity-based calibration curves
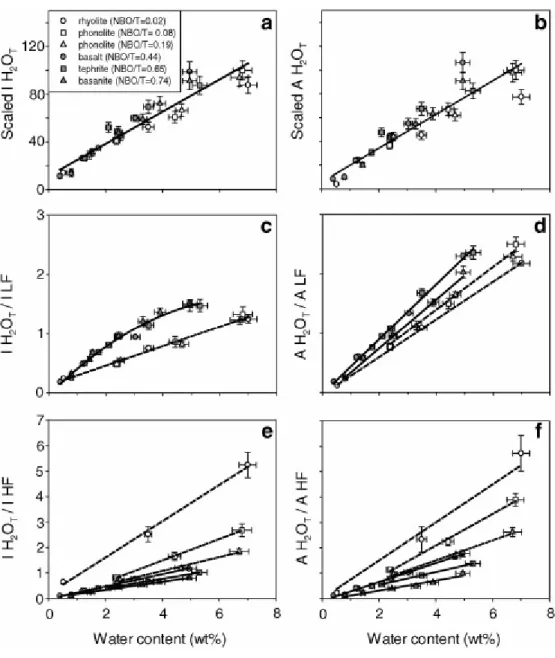
Fig. 8 shows the calibration lines derived from both internal and external procedures. All the data can be fitted with one single line when using external calibrations based on measurement of the H2OT band height (Fig. 8a and b). Linear regression of area data is slightly worse than that of height data because of the larger error associated with area measurements and possible compositional effect.
Internal calibrations of the total water band height (Fig. 8c and e) and area (Fig. 8d and f) normalised to either LF or HF bands show that area data treatment enhances the composition dependence of water calibration procedures. This effect is particularly significant in the calibrations for the analysis of depolymerised glasses (Fig. 8e and f). A single polynomial fit describes the evolution of the IH2OT/ILF height ratio with increasing dissolved water content (Fig. 8c).
5.2. Effect of glass composition
In the previous section, we have shown that calibrations based on Long-corrected data and area measurements have larger composition dependence than those derived from uncorrected band intensities. Accordingly, only intensity data, derived from uncorrected spectra, are considered in the following discussion. Band intensities, intensity ratios and corresponding errors are reported for each glass sample in Table 2.
5.2.1. External calibration
Hydrous glass sets of basaltic, basanitic, tephritic, phonolitic and rhyolitic composition, define a single linear calibration passing through the axis origin when the height of the H2OT band is correlated with the total water content (Fig. 8a and b). This method appears to be very effective in reducing chemical composition dependence of micro-Raman calibration. It should be noted that the observed data scattering is due to small differences in beam focusing and/or laser energy from one session of measurement to another one. Actually, the difference in slopes of calibration lines of transparent (polymerised) and absorbing (depolymerised) glasses is mainly due to these combined effects. We have verified that all samples, regardless of their compositions, should be aligned along the same calibration curve if analysed during the same session and under the same analytical conditions. Moreover, the apparent positive intercept observed for transparent glasses is related to bias introduced by the focusing error on the band height measurement (Fig. 1b). Actually, in colourless glasses the H2OT band height increases by about 50% in the first 3 μm whereas the absorption in coloured glasses is already
significant at this depth. Hence, errors in focusing on the surface in transparent glasses easily overestimate the H2OT band height. In order to overcome this problem, the laser beam could be focused at the depth where the signal intensity achieves its maximum value (5 μm in transparent glasses). However, this depth changes with glass composition and analytical setting (e.g. confocality, laser wavelength). Moreover, focusing in depth does not represent a viable procedure for the analysis of micro-crystallised or micro-vesicular samples. Hence, in order to avoid a significant effect of the glass absorptivity on the measured height of the H2OT band, the laser beam must be correctly focussed at the sample surface. The positive intercept defines the correction parameter q in Eq. (1). Our experience, for all analysed glass sets, is that q becomes zero if very precise focusing on the glass surfaces is achieved.
5.2.2. LF internal calibration
Divergence between the calibration curves of polymerised and depolymerised glasses is observed when the height of the H2OT band is normalised to that of the LF envelope as illustrated by the Fig. 8c, in which silicic (rhyolitic, phonolitic) and mafic (basalt, tephrite, basanite) glasses plot on two slightly distinct trends. Calibrations based on band areas (Fig. 8d) exhibit larger composition dependence, but are linear for all compositions. The
polynomial calibration line for mafic glasses in Fig. 8c is comparable with that reported for basaltic glasses with 0–4.7 wt% H2OT by Behrens et al. (2006). The bending of the calibration with increasing water contents can be attributed to the dependence of the LF envelope on increasing water content and depolymerisation (Fig. 4). More precisely, in polymerised phonolites, the height of the LF undergoes a smooth and linear decrease with increasing water content: ~ 5% in iron-rich phonolites (H2O = 2.5–6.7 wt%) and ~10% in iron-poor phonolites (H2O = 2.4–6.8 wt%, Table 2). On the contrary, the LF height progressively increases to about 45% in basanite in the range 0.79–4.95 wt% H2OT (e.g. Sommata glass, Table 2), following a polynomial function. An intermediate evolution of the LF height with increasing water is observed in Etna basaltic glasses with a decline of about 17% in water-poor glasses (0.40–1.75 wt%), and an increase of 29% at higher water contents (1.75–4.95 wt%). Bending of calibration curves in mafic glasses is thus related to the non-linear effects of water
dissolution on glass structure and LF topology.
As a whole, the slopes of LF calibration lines increase with NBO/T values. This trend is clearly related to the progressive decrease of the LF intensity with decreasing polymerisation degree (Fig. 6). Finally, our data suggest that internal calibration using the area of the LF band for normalisation is appropriate for quantifying water content dissolved in both
polymerised and depolymerised glasses because: (i) the LF band is very intense and affected by small errors in baseline subtraction at low NBO/T; (ii) the water dissolution has a linear effect on the area of this band in all glass sets. In contrast, LF calibrations based on the band heights are questionable for depolymerised glasses.
5.2.3. HF internal calibration
All hydrous glasses plot on distinct linear trends when the intensity of the H2OT band is normalised to the HF reference band (Fig. 8e and f). Calibration lines cross the origin axis with a very small scattering (R2 up to 0.99) and allow precise measurement of total dissolved water content. The slopes decrease with increasing NBO/T and are steeper than with the LF internal calibration. Steep slopes are a pre-requisite for the definition of precise calibrations, but possibly enhance the composition dependence. With this procedure, the three mafic sets and the two phonolitic sets (iron-poor and iron-rich) define diverging calibrations.
Composition dependence is higher in calibrations based on band areas (Fig. 8e). Slope decrease is clearly controlled by increasing HF intensity with NBO/T and iron content (Fig. 5a). The observed linearity is instead due to the small linear decrease in the HF band height with increased water content for each composition (Table 2; Eq. (3)).
The height of the HF bands is inversely proportional to the glass polymerisation degree and, in a complex way, to the iron content and iron oxidation state (Di Muro et al., 2008). We demonstrate that the redox state of iron has negligible effect on the calibration curves of mafic glasses (Fig. 6b). Actually, the HF height increases by only ~10% with an increase in the [Fe3+/FeT] ratio from 0.098 to 0.48 (Et basalt set). The slope of the HF calibration line in Etna basalts would be significantly affected (error bars above 10%) only by iron oxidation changes
>35%. It becomes even less sensitive to the iron speciation for tephritic and basanitic compositions. Calibrations based on band heights are affected by a limited matrix effect and are the most effective in reducing the influence of heterogeneities in iron oxidation state in both standards and unknowns. The HF band therefore represents the most suitable reference band for the internal calibration procedure when analysing depolymerised glasses.
6. Calculation of dissolved water content: a new approach
6.1. Prediction of calibration line slope
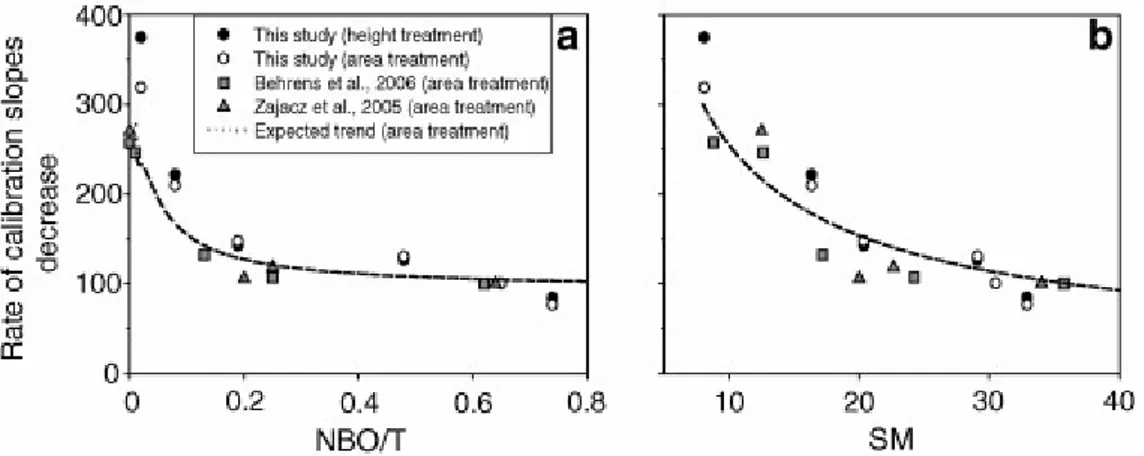
Here, we examine variations in the calibration line slopes when using the HF internal calibration methods as a function of NBO/T and SM parameters (Fig. 9). The LF band normalisation procedure is not effective in predicting the evolution of the calibration line slopes because of the scattering induced by the strong dependency of the LF on glass
polymerisation and water content. Instead, the HF internal calibration method provides much better fit providing a means for understanding the relationship between the slope of
calibration lines and the glass composition via a structural parameter. The decrease rate of the slope for linear calibrations based on band areas as a function of the compositional parameters NBO/T (Fig. 9a) or SM (Fig. 9b) has been calculated on the basis of: (a) the modelled LF/HF trend (Fig. 6a and b) and the constant slope of external calibrations for water (Fig. 8). The expected trend (dotted curve) fits the literature data and our own calibrations and
demonstrates that our model is able to capture the matrix effect that affects the HF procedure of internal calibration. The matrix effect progressively decreases from silicic to intermediate compositions and is very small in mafic glasses. The slope of calibration line can thus be predicted and eventually corrected when the composition of the available glass standard differs from that of the unknown samples. However, this approach would require systematic measurements on three different hydrous sets of standard glasses at least.
.2. Calculation of dissolved water content
Calibration of Eq. (5) allows the construction of a very simple equation able of predict the water concentration (CH2OT in wt%) dissolved in a glass of known bulk composition, such that:
where TOTN is the expected LF/HF band height ratio of the unknown determined with Eqs.
(8) and (9), IH2ON is the ratio IH2O/(ILF/IHF) measured on the hydrous unknown sample and k is the slope of Eq. (1). In order to apply the equation: (a) the theoretical evolution of TOTN must
be calibrated on a set of dry and hydrous glass standards and the composition of the unknown must be assessed; (b) k is daily calibrated on a set of hydrous standards; and (c) IH2ON is obtained by the measurement on the unknown after baseline subtraction. Such a procedure allows the use of any set of hydrous glass standards even very different from the unknown. However, TOTN value includes the sample H2OT content (Eqs. (8) and (9)) that is roughly estimated by using external calibration. Such approximation does not introduce significant error on the final results.
There is good agreement between the water content calculated using Eq. (10) and those determined on the bulk glass fragments by independent methods (Table 1a). The regressions presented in Fig. 10a and b give the following relationship:
where X is the reference water content, Y is the predicted water content, r is the correlation coefficient, SD is the standard deviation of the fit and n is the number of data points. Eqs. (11) and (12) are obtained as a function of NBO/T and SM parameters, respectively.
A better correlation is observed with the SM parameter than NBO/T. This is consistent with the observation that ILF/IHF ratios on anhydrous glasses present a smoother and better
correlation with SM than NBO/T (Fig. 6a and b). So, with this method, dissolved water can be estimated without necessarily standard glasses having exactly the same composition as the unknown sample. In order to minimise the q term of Eq. (5) and obtain Eq. (10), k value must be calibrated on absorbing glasses or at the depth of maximum signal intensity for transparent and semi transparent glasses. With this approach, the simple measurement of the height ratio between the main bands (H2OT, LF and HF) of the unknown hydrous glass allows to calculate its water content.
7. Conclusion
The quantification of the effects of bulk composition, water content and iron oxidation states on the relative intensity of the main Raman bands allows a prediction of the compositional dependence of micro-Raman calibration for quantitative water analysis in natural glasses. The intensity ratio (height or area) of the main bands related to vibrations of the silicate network (LF/HF) decreases with depolymerisation degree along a polynomial trend as a function of SM and NBO/T (structural parameters). This variation, which is best illustrated by SM parameters, can be predicted in hydrous glasses via empirical expressions (Eqs. (8) and (9)). The height of H2OT band linearly increases with dissolved water content on a single slope in all studied compositions and, in first approximation, can be used for semi-quantitative estimate of the water concentration. Our data support the hypothesis that the cross-section of the H2OT band is independent of the glass matrix composition. The height of this band must be measured at the sample surface in absorbing (mafic) or multi-phase
(glass + crystals + bubbles) glasses and at increasing depth in semi-transparent and
transparent (silicic) mono-phase glasses. Focusing errors and fluctuations of delivered laser energy significantly affect the precision of water measurement with external calibration. Internal calibration based on the H2OT band area normalised to LF band is accurate for all compositions. LF calibrations based on band heights are considered accurate only for acid and intermediate glasses. The slope of internal calibration lines, when the H2OT band intensity (height and area) is normalised to that of the HF band, decreases with increasing glass depolymerisation (as defined by NBO/T or SM). Iron oxidation state has only a minor effect
on mafic iron-rich samples like basalts from Etna and Stromboli. However, the effect of iron oxidation state cannot be ignored in moderately to highly polymerised glasses (e.g. andesites, pantellerites), in mafic glasses when the Fe3+/FeT value varies by >35% and in synthetic glasses where no competition between iron and another network former element occurs. For a given spectrometer, the constant molar scattering power (k) of bulk water and the modelling of the dependence of relative band height (ILF/IHF) on bulk glass composition allow us to propose a new procedure to quantify the water content in natural glasses. Calculated water concentrations with this procedure are in good agreement with the expected values for reference glasses with a standard deviation of 0.06 in the water range 0.4–7 wt%. Application of the proposed analytical procedure to the analysis of hydrous glasses with H2OT > 7wt% or highly depolymerised glasses (NBO/T > 1.2) requires the extension of the current
calibrations.
Acknowledgments
This work represents part of the Ph.D. research of M. Mercier and was supported by ANR program ANR-06-CATT-012-01 VOLGASPEC. We are grateful to D. Laporte for providing the water-rich rhyolitic sample. The manuscript benefited of the careful reviews of R.
Thomas, Z. Zajacz and of an anonymous reviewer and of the thoughtful handling of P. Ulmer. We thank B. Williamson for improving the English version of the paper.
References
Arias et al., 2006 A. Arias, M. Oddone, G. Bigazzi, A. Di Muro, C. Principe and P. Norelli, New data for the characterisation of Milos obsidians, J. Radioanal. Nuclear Chem. 268 (2006), pp. 371–386.
Arredondo and Rossman, 2002 E.H. Arredondo and G. Rossman, Feasibility of determining the quantitative OH content of garnets with Raman spectroscopy, Am. Mineral. 87 (2002), pp. 307–311.
Behrens et al., 2006 H. Behrens, J. Roux, D.R. Neuville and M. Siemann, Quantification of dissolved H2O in silicate glasses using confocal micro-Raman spectroscopy, Chem. Geol. 229 (2006), pp. 96–112
Bell et al., 1970 R.J. Bell, P. Dean and D.C. Hibbins-Butler, Localization of normal modes in vitreous silica, germania and beryllium fluoride, J. Phys. C Solid State Phys. 3 (1970), pp. 2111–2118.
Bell and Dean, 1972 R.J. Bell and P. Dean, Structure of vitreous silica. Validity of the random network theory, Philos. Mag. 25 (1972), pp. 1381–1398.
Bonnin-Mosbah et al., 2002 M. Bonnin-Mosbah, N. Métrich, J. Susini, M. Salomé, D. Massare and B. Menez, Micro X-ray absorption near edge structure at the sulfur and iron K-edges in natural silicate glasses, Spectrochim. Acta 57 (2002), pp. 711–725.
Chabiron et al., 2004 A. Chabiron, J. Pironon and D. Massare, Characterization of water in synthetic rhyolitic glasses and natural melt inclusions by Raman spectroscopy, Contrib. Mineral. Petrol. 146 (2004), pp. 485–492.
Cooney and Sharma, 1990 T.F. Cooney and S.K. Sharma, Structure of glasses in the system Mg2SiO4–Fe2SiO4, Mn2SiO4–Fe2SiO4, Mg2SiO4–CaMgSiO4 and MnSiO4–CaMnSiO4, J. Non-Cryst. Solids 122 (1990), pp. 10–32
Dingwell and Brearley, 1988 D.B. Dingwell and M. Brearley, Melt densities in the CaO– FeO–Fe2O3–SiO2 system and the compositional dependence of the partial molar volume of ferric iron in silicate melts, Geochim. Cosmochim. Acta 52 (1988), pp. 2815–2872.
Dingwell et al., 1988 D.B. Dingwell, M. Brearley and D. Virgo, The dual role of ferric iron in liquid silicates: effects on density & viscosity, Chem. Geol. 70 (1988), p. 86.
Dingwell et al., 1996 D.B. Dingwell, C. Romano and K.U. Hess, The effect of water on the viscosity of a haplogranitic melt under P–T–X conditions relevant to silicic volcanism, Contrib. Mineral. Petrol. 124 (1996), pp. 19–28.
Di Muro et al., 2004 A. Di Muro, A. Neri and M. Rosi, Contemporaneous convective and collapsing eruptive dynamics: the transitional regime of explosive eruptions, Geophys. Res. Lett. 31 (2004), p. L10607.
Di Muro et al., 2006a A. Di Muro, B. Villemant, G. Montagnac, B. Scaillet and B. Reynard, Quantification of water content and speciation in natural silicic glasses (phonolite, dacite, rhyolite) by confocal micro-Raman spectroscopy, Geochim. Cosmochim. Acta 70 (2006), pp. 2868–2884.
Di Muro et al., 2006b A. Di Muro, D. Giordano, B. Villemant, G. Montagnac, B. Scaillet and C. Romano, Influence of composition and thermal history of volcanic glasses on water content as determined by micro-Raman spectrometry, Appl. Geochem. 70 (2006), pp. 802– 812.
Di Muro et al., 2008 A. Di Muro, N. Métrich, M. Mercier, G. Giordano, D. Massare and G. Montagnac, Micro-Raman Determination of Iron Redox State in Dry Natural Glasses: Application to Peralkaline Rhyolites and Basalts, Chem. Geol. (2008)
Faurskov Nielsen, 1996 O. Faurskov Nielsen, Low-frequency spectroscopic studies and intermolecular vibrational energy transfer in liquids, Annu. Rep. Prog. Chem. Sect. C Phys. Chem. (1996), pp. 57–99.
Furukawa et al., 1981 T. Furukawa, K.E. Fox and W.B. White, Raman spectroscopic
investigation of the structure of silicate glasses. III. Raman intensities and structural units in sodium silicate glasses, J. Chem. Phys. 75 (1981), pp. 3226–3237.
F.L. Galeener, Planar rings in glasses, Solid State Comm. 44 (1982), pp. 1037–1040.
Galeener, 1982b F.L. Galeener, Planar rings in vitreous silica, J. Non-Cryst. Solids 49 (1982), pp. 53–62.
Giordano and Dingwell, 2003 D. Giordano and D.B. Dingwell, Non-Arrhenian
Giordano et al., 2004 D. Giordano, C. Romano, D.B. Dingwell, B. Poe and H. Behrens, The combined effects of water and fluorine on the viscosity of silicic magmas, Geochim.
Cosmochim. Acta 68 (2004), pp. 5159–5168.
Giordano et al., 2006 D. Giordano, A. Mangiacarpa, M. Potuzak, J.K. Russel, C. Romano, D.B. Dingwell and A. Di Muro, An expanded non-Arrhenian model for silicate melt viscosity, a treatment for metaluminous, peraluminous, and peralkaline liquids, Chem. Geol. 229
(2006), pp. 42–56.
Giordano et al., 2007 D. Giordano, P. Ardia, A. Mangiacapra, C. Romano, D.B. Dingwell, R. Cioni, M.W. Schmidt and K.U. Hess, The rheology of Vesuvius magmas, Geophys. Res. Abs.
9 (2007), p. 04796.
Giordano et al., 2008 D. Giordano, J.K. Russel and D.B. Dingwell, Viscosity of magmatic liquids: a model, Earth Planet. Sci. Lett. 271 (2008), pp. 123–134.
Kushiro, 1982 I. Kushiro, Density of tholeiite and alkali basalt magmas at high pressure, Carnegie Inst. Washington Year Book 82 (1982), pp. 305–309.
Lange and Carmichael, 1990 Lange R. and Carmichael I. S. E. (1990) Thermodynamics properties of silicate liquids with emphasis on density, thermal expansion and compressibility. In Understanding Magmatic Processes. Modern Methods of Igneous Petrology. Rev. Mineral. (eds. J. Nicholls and J. K. Russel), vol. 24, pp. 25–64.
Lesne et al., submitted for publication Lesne P., Scaillet B., Pichavant M., Iacono-Marziano G. and Beny J. M. (submitted for publication) The water solubility in alkali basalts from Italy: an experimental study. Contrib. Mineral. Petrol..
Linnen, 2005 R. Linnen, The effect of water on accessory phase solubility in subaluminous and peralkaline granitic melts, Lithos 80 (2005), pp. 267–280.
Litasov and Ohtani, 2007 K. Litasov and E. Ohtani, Effect of water on the phase relations in Earth’s mantle and deep water cycle, Geol. Soc. Amer. Spec. Paper (2007), p. 421.
Long, 1977 D.A. Long, Raman Spectroscopy, McGraw-Hill, Inc., Great Britain (1977) 275 p. Magnien et al., 2006 V. Magnien, D.R. Neuville, L. Cormier, J. Roux, J.-L. Hazemann, O. Pinet and P. Richet, Kinetics of iron redox reactions in silicate liquids, a high-temperature X-ray absorption and Raman spectroscopy study, J. Nuc. Mat. 352 (2006), pp. 190–195.
Matson et al., 1983 D.W. Matson, S.K. Sharma and J.A. Philpotts, The structure of high-silica alkali silicate glasses. A Raman spectroscopic investigation, J. Non-Cryst. Solids 58 (1983), pp. 323–352.
McMillan, 1984 P.F. McMillan, Structural studies of silicate glasses and melts, applications and limitations of Raman spectroscopy, Am. Mineral. 69 (1984), pp. 622–644.
McMillan and Remmele, 1986 P.F. McMillan and R.L. Remmele, Hydroxyl sites in SiO2 glass, a note on infrared and Raman spectra, Am. Mineral. 71 (1986), pp. 772–778.
McMillan et al., 1995 P.F. McMillan, B.T. Poe, P. Gillet and B. Reynard, A study of SiO2 glass and supercooled liquid to 1950 K via high-temperature Raman spectroscopy, Geochim. Cosmochim. Acta 58 (1995), pp. 3653–3664.
Mourtada-Bonnefoi and Laporte, 2004 C.C. Mourtada-Bonnefoi and D. Laporte, Kinetics of bubble nucleation in a rhyolitic melt, an experimental study of the effect of ascent rate, Earth Planet. Sci. Lett. 218 (2004), pp. 521–537.
Mysen and Virgo, 1980 B.O. Mysen and D. Virgo, Solubility mechanisms of water in basalt melt at high pressures and temperatures: NaCaAlSi2 O7·H2O as a model, Am. Mineral. 65 (1980), pp. 1176–1184.
Mysen et al., 1980a B.O. Mysen, D. Virgo, W.J. Harrison and C.M. Scarfe, Solubility mechanisms of H2O in silicate melts at high pressures and temperatures, a Raman spectroscopic study, Am. Mineral. 65 (1980), pp. 900–914.
Mysen et al., 1980b B.O. Mysen, F.A. Seifert and D. Virgo, Structure and redox equilibria of iron-bearing silicate melts, Am. Mineral. 65 (1980), pp. 867–884.
Mysen, 1988 B.O. Mysen, Structure and Properties of Silicate Melts, Elsevier, Amsterdam (1988).
Mysen et al., 1997 B.O. Mysen, F. Holtz, M. Pichavant, J.M. Beny and J.M. Montel, Solution mechanisms of phosphorous in quenched hydrous and anhydrous granitic glass as a function of peraluminosity, Geochim. Cosmochim. Acta 61 (1997), pp. 3913–3926
Mysen, 1999 B.O. Mysen, Structure and properties of magmatic liquids, from haplobasalt to haploandesite, Geochim. Cosmochim. Acta 63 (1999), pp. 95–112
Mysen, 2007 B.O. Mysen, The solution behavior of H2O in peralkaline aluminosilicate melts at high pressure with implications for properties of hydrous melts, Geochim. Cosmochim. Acta 71 (2007), pp. 1820–1834.
Pandya et al., 1992 N. Pandya, D.W. Muenow and K.S. Shiv, The effect of bulk composition on the speciation of water in submarine volcanic glasses, Geochim. Cosmochim. Acta 56 (1992), pp. 1875–1883.
Pasquarello and Car, 1998 A. Pasquarello and R. Car, Identification of Raman defect lines as signatures of ring structures in vitreous silica, Phys. Rev. Lett. 80 (1998), pp. 5145–5147. Persikov et al., 1990 E.S. Persikov, P.G. Zharikov and S.F. Polskoy, The effects of volatiles on the properties of magmatic melts, Eur. J. Miner. 2 (1990), pp. 621–642.
Pichavant et al., 2002 M. Pichavant, B.O. Mysen and R. MacDonald, Source and H2O content of high-MgO magmas in island arc settings, an experimental study of primitive calc-alkaline basalt from St. Vincent, Lesser Antilles arc, Geochim. Cosmochim. Acta 12 (2002), pp. 2193– 2209.
Richet et al., 1996 P. Richet, A.-M. Lejeune, F. Holtz and J. Roux, Water and the viscosity of andesite melts, Chem. Geol. 128 (1996), pp. 185–197.