Publisher’s version / Version de l'éditeur:
Analytical Chemistry, 87, 15, pp. 7996-8004, 2015-07-09
READ THESE TERMS AND CONDITIONS CAREFULLY BEFORE USING THIS WEBSITE. https://nrc-publications.canada.ca/eng/copyright
Vous avez des questions? Nous pouvons vous aider. Pour communiquer directement avec un auteur, consultez la première page de la revue dans laquelle son article a été publié afin de trouver ses coordonnées. Si vous n’arrivez pas à les repérer, communiquez avec nous à PublicationsArchive-ArchivesPublications@nrc-cnrc.gc.ca.
Questions? Contact the NRC Publications Archive team at
PublicationsArchive-ArchivesPublications@nrc-cnrc.gc.ca. If you wish to email the authors directly, please see the first page of the publication for their contact information.
NRC Publications Archive
Archives des publications du CNRC
This publication could be one of several versions: author’s original, accepted manuscript or the publisher’s version. / La version de cette publication peut être l’une des suivantes : la version prépublication de l’auteur, la version acceptée du manuscrit ou la version de l’éditeur.
For the publisher’s version, please access the DOI link below./ Pour consulter la version de l’éditeur, utilisez le lien DOI ci-dessous.
https://doi.org/10.1021/acs.analchem.5b02001
Access and use of this website and the material on it are subject to the Terms and Conditions set forth at
Direct determination of trace antimony in natural waters by
photochemical vapor generation ICPMS: method optimization and
comparison of quantitation strategies
Gao, Ying; Sturgeon, Ralph E.; Mester, Zoltán; Hou, Xiandeng; Zheng,
Chengbin; Yang, Lu
https://publications-cnrc.canada.ca/fra/droits
L’accès à ce site Web et l’utilisation de son contenu sont assujettis aux conditions présentées dans le site LISEZ CES CONDITIONS ATTENTIVEMENT AVANT D’UTILISER CE SITE WEB.
NRC Publications Record / Notice d'Archives des publications de CNRC:
https://nrc-publications.canada.ca/eng/view/object/?id=8346c7a2-f82e-4caf-9f9a-00240120467c https://publications-cnrc.canada.ca/fra/voir/objet/?id=8346c7a2-f82e-4caf-9f9a-00240120467c
Direct Determination of Trace Antimony in Natural Waters by
Photochemical Vapor Generation ICPMS: Method Optimization and
Comparison of Quantitation Strategies
Ying Gao,
†,‡Ralph E. Sturgeon,
†Zoltán Mester,
†Xiandeng Hou,
§Chengbin Zheng,
§and Lu Yang
*
,††
National Research Council Canada, Ottawa, Ontario K1A 0R6, Canada
‡
College of Geosciences, Chengdu University of Technology, Chengdu 610059, China
§
Key Laboratory of Green Chemistry and Technology, Ministry of Education, College of Chemistry, Sichuan University, Chengdu, Sichuan 610064, China
ABSTRACT: A novel and sensitive approach for the accurate determination of antimony (Sb) in natural waters is described using photochemical vapor generation (PVG) coupled with inductively coupled plasma mass spectrometry (ICPMS) for detection. Utilizing a unique flow-through photochemical reactor capable of subjecting the samples to deep-UV (185 nm) radiation, generation efficiency was found to be independent of whether Sb(III), Sb(V), or organometallic species [trimethyltantimony(V)dibromine, TMSb(V)] were present, eliminating the shortcoming of Sb species depended
sensitivity encountered during direct solution nebulization by ICPMS. Furthermore, the potentially severe matrix effect from seawater was efficiently eliminated by using a mixture of 5% (v/v) formic and 15% acetic acids (v/v) as the photochemical reductant, making direct determination of Sb in seawater feasible. The proposed method provides a 15-fold improvement in sensitivity over direct solution nebulization. A method detection limit of 0.0006 ng g−1based on external calibration was obtained (0.0002 ng g−1 for isotope dilution), yielding a 15-fold improvement over that for direct solution nebulization. Accuracy is demonstrated by analysis of two water certified reference materials (CRMs, e.g., SLRS-6 and NIST 1640a) with satisfying results. In addition, spike recoveries of 100.6 ± 5.5% and 100.8 ± 3.8% (standard deviation, n = 3) were obtained for NASS-6 and CASS-5 seawater CRMs, respectively, since no certified values for Sb has been established for these materials. The performance of several calibration strategies, including double isotope dilution (ID), multiple and single-point gravimetric standard additions with internal standardization, as well as multiple and single-point gravimetric standard additions alone was examined. High precision of determination of Sb in four natural water samples (0.51−1.4%) was realized based on ID calibration, whereas one-point gravimetric standard addition calibration with internal standardization provided precisions of 1.6% and 3.3% at 0.22 and 0.44 ng g−1levels, respectively, in seawater.
A
ntimony and its compounds are considered pollutants of priority interest by both the U.S. Environmental Protection Agency and the European Union.1,2 The general population is usually exposed to low levels of antimony from food and water.3In the aquatic environment, soil runoff, rock weathering, and anthropogenic activities contribute to the antimony burden,4−7 yielding typical concentrations inunpolluted waters4,8 of <1 ng g−1. The need to access such low concentrations in unpolluted natural waters frequently makes use of inductively coupled plasma mass spectrometry (ICPMS) as a consequence of its detection power.9,10 Unfortunately, sensitivity differences between different analyte species such as inorganic As(III) and As(V) with ICPMS or with inductively coupled plasma optical emission spectrometry (ICPOES) detection11,12 often complicate the accurate determination of total analyte concentration.11,12 It was reported that inorganic As(V) in 1% (v/v) HCl solution was 11% more sensitive than that of As(III) by ICPMS detection due to partial formation of AsCl3.11,13 Since Sb and As both
belong to group 15 elements in the periodic table, Sb may behave similarly to As5 and display species-dependent sensitivity, resulting biased results of total Sb by direct ICPMS measurements. Furthermore, direct determination of Sb in seawater remains a challenge due to its high salt content (3.5%) and low analyte concentration (subnanogram per gram).14,15 As such, chemical hydride generation (CHG) is often used to further enhance detection power by increasing analyte transport efficiency while eliminating troublesome matrix interferences.14 Unfortunately, response with CHG is species-dependent, relying on prereduction of Sb(V) to Sb(III) or preoxidation of all species to a single form prior to the determination of total Sb. This requirement leads to relatively lengthy analytical protocols and increases the possibility of
Received: May 28, 2015
Accepted: July 9, 2015
Published: July 9, 2015
sample contamination.16,17An underestimation of the total Sb concentration may still occur since natural waters may contain organic forms of Sb which cannot be decomposed using a prereduction approach typical of CHG. Furthermore, use of unstable KBH4/NaBH4 and the high concentration of HCl required for efficient CHG of Sb(V) are not favorable; greener, simpler, and more cost-effective sample preparation techniques are needed.
Photooxidation-based sample treatments are well-established and have become important approaches for many trace elements measurements and speciation schemes.17In addition, the risk of sample contamination is lower, and improved limits of detection (LODs) can be achieved due to the lower blank levels.16,17Use of UV irradiation alone or in combination with other chemical oxidants has been proposed for online photodecomposition of numerous species of several elements which serve to enhance analytical sensitivity16,18when coupled to ICPMS. Using a high-efficiency photooxidation reactor as a source of vacuum ultraviolet light at 185 nm provides efficient irradiation; organoarsenic species can be converted to As(V) within 3.5 s online without addition of any chemical oxidants.19 The extremely high efficiency arises from the powerful hydroxyl radical (with a redox potential of 2.8 V), efficiently produced from water molecules under the influence of 185 nm UV irradiation.19Yoon et al. also reported enhanced efficiency of oxidation of As(III) using this UV lamp when compared to other photochemical oxidation methods.20
By contrast, photoreduction has recently received increasing attention as an alternative sample introduction technique for trace element measurements. Photochemical vapor generation (PVG) utilizes free radicals generated by photoredox reactions in the presence of low molecular weight organic compounds as reducing agents.21−23 PVG not only retains the principle
advantages of conventional CHG but also provides simpler reactions and greener analytical chemistry. Moreover, the instability of plasma arising from introduction of large amounts of hydrogen generated during CHG is avoided with PVG. Consequently, PVG has been successfully applied to the determination of many elements over the past decade.22 However, for Sb, more than a 2-fold difference in efficiencies between Sb(III) and Sb(V) has been earlier reported with PVG,24 making its direct determination complicated. Fur-thermore, severe matrix effects are likely, as reported for the determination of Se in seawater by PVG.25 Consequently, a severalfold dilution of the sample prior to analysis was needed
for the quantification of Se, compromising the analytical performance of PVG. In the presence of low concentration of chloride, signal suppression was noted for the determination of Ni and Sn using PVG.26,27Recently, it has been reported that, when a relatively thin film of sample solution is exposed to the UV, the presence of deep-UV radiation (185 nm) facilitates PVG reactions, leading to enhanced analytical performance for Sn,27Br,28Se,29Hg,30and Pb.31
The purpose of this work was to develop a sensitive, accurate, and simple method for the direct determination of trace Sb in natural waters by ICPMS with use of a flow-through thin-film deep-UV reactor. The accuracy of the proposed method is demonstrated by successful analysis of two river water certified reference materials (NRC SLRS-6 and NIST 1640a) and recoveries of spikes to seawater CRMs.
■
EXPERIMENTAL SECTIONInstrumentation. An Agilent 7500 ICPMS (Mississauga, ON, Canada), equipped with a collision cell and an ESI spray chamber (Elemental Scientific; Omaha, NE, U.S.A.) which has two inlets to permit simultaneous introduction of both gaseous (vapor generation) and liquid nebulization (for convenient daily optimization of the instrument) was used. Solution nebulization was undertaken with a PFA ST nebulizer ES-2040 (Elemental Scientific; Omaha, NE, U.S.A.) operating at 0.40 mL min−1. For PVG optimization and sample analysis, gas flow to the nebulizer was stopped, as a result of wet plasma significantly decreasing the PVG response of Sb, possibly due to reabsorption of Sb volatile species onto mist of water in the spray chamber. The UV-PVG photoreactor was interfaced to the ICPMS as detailed earlier,31as shown inFigure 1. The 19 W UV-PVG photoreactor was obtained from Beijing Titan Instruments Co. (Beijing, China) and provided a source of 185 nm radiation. The sample solution was pumped through a narrow-bore synthetic quartz tube (800 μL internal volume) internally positioned along the central axis of the low-pressure mercury discharge. This allowed efficient and uniform irradiation of a thin film of the sample from all directions and with deep-UV lines from the discharge. Argon carrier gas was introduced through a “Y” connection between the outlet of the photoreactor and a homemade gas−liquid separator (GLS, ∼2 mL internal volume) maintained at 0 °C by immersion in an ice bath to minimize transport of any liquid droplets derived from condensation of water vapor to the ICP. The generated analyte vapor was directed from the GLS to the gas inlet port of Figure 1.Schematic of the UV-PVG reactor.
Analytical Chemistry Article
DOI: 10.1021/acs.analchem.5b02001 Anal. Chem. 2015, 87, 7996−8004
the spray chamber via a 0.25 m length of Teflon-lined Tygon tubing (0.25 in. o.d., VWR International).
Reagents and Solutions. Nitric and hydrochloric acids were purified in-house prior to use by sub-boiling distillation of reagent grade feedstock in a quartz still. High-purity deionized water (DIW) was obtained from a NanoPure mixed bed ion-exchange system fed with reverse osmosis domestic feedwater (Barnstead/Thermolyne Corp., Iowa, U.S.A.). High-purity formic (88%) and glacial acetic acids were obtained from GFS Chemicals Inc. (Powell, OH, U.S.A.). A 5% HNO3(v/v) rinse solution was introduced into the system between samples to efficiently eliminate memory effects. High-purity NaCl (trace SELECT, >99.999%) was obtained from Sigma-Aldrich Canada (Oakville, Ontario, Canada).
A 3643.1 μg g−1stock solution of antimony [mostly existing as Sb(V)] was prepared by dissolution of 0.36 g of the high-purity metal (Johnson, Matthey and Co. Limited, London, U.K.) in a solution of 9 mL of HCl and 3 mL of HNO3 followed by dilution with DIW. Enriched 123Sb isotope (as metal, 99.37%) was purchased from Trace Sciences Interna-tional (Richmond Hill, Ontario, Canada) and prepared in the same manner. Enriched 82Se isotope (as metal, 99.7%) was used as an internal standard and was obtained from Trace Sciences International. The metal was dissolved in a mixture of HNO3 and HCl followed by dilution with DIW. A working internal standard solution of 15.0 μg g−1 82Se(IV) was prepared by dilution of the stock solution with 2% HCl. A working spike solution of 25 ng g−1 was prepared by dilution of the 123Sb stock solution with 2% HCl. A working standard solution containing 25.0 ng g−1 Sb used for standard additions calibration or reverse isotope dilution was prepared by dilution of the stock with 2% HCl. A 1000 μg g−1 antimony(III) standard solution was prepared by dissolving Sb2O3(Aldrich, 99.95% purity) in 3 M HCl. A stock solution of Sb(V) was prepared by dissolving solid potassium hexahydroxoantimonate KSb(OH)6 (Aldrich, 99.95% purity) in DIW. Trimethylanti-mony dibromide (CH3)3SbBr2 (TMSb) was purchased from Aldrich (98% purity) from which a 1000 μg g−1stock solution was prepared in DIW. All standard solutions were stored in polyethylene bottles at 4 °C.
National Research Council Canada (NRCC, Ottawa, Canada) river water CRM SLRS-5 and seawater CRMs CASS-5 and NASS-6, as well as National Institute of Standards and Technology (NIST, Gaithersburg, MD, U.S.A.) natural water SRM1640a were used for method validation.
Sample Preparation and Analysis Procedure. For the determination of Sb in water samples using quantitation by isotope dilution, 10 g subsamples of three replicates of each water CRM (except NIST 1640a for which 1 g subsamples were used) were weighed into precleaned polyethylene bottles. Samples were spiked with appropriate masses of the 25 ng g−1 123Sb so as to yield a ratio of121Sb/123Sb near 0.5 in the sample. A 10 g mass of a solution containing 30% acetic acid (AA) and 10% formic acid (FA) was added to each subsample, resulting in final concentrations of 15% AA and 5% FA. NIST 1640a samples were diluted 20-fold to a final mass of 20 g with DIW in order to decrease HNO3 concentration and achieve high-efficiency PVG of Sb. Three sample blanks (spiked with 10% of the amount of the enriched spike used for the samples) were prepared in pH 1.6 DIW containing 5% FA, 15% AA, and 1.75% NaCl (to match salt content in prepared seawater samples). For reverse isotope dilution (ID), three replicates of 0.10 g aliquots of the 25 ng g−1 123Sb spike were accurately
weighed into precleaned polyethylene screw-capped bottles to which 0.14 g of a 25 ng g−1solution of natural abundance Sb was added such as to result in a121Sb/123Sb ratio near 0.5. The contents were then diluted to 20 g with pH 1.6 DIW containing 5% FA, 15% AA, and 1.7.5% NaCl. A 2 ng g−1 solution of natural abundance Sb prepared in pH 1.6 DIW containing 5% FA, 15% AA, and 1.75% NaCl was used for mass bias correction.
For comparison of performance, samples were prepared for the determination of Sb using standard additions calibration with and without an internal standard. Three replicates 40 g masses of both NASS-6 and CASS-5 were weighted into preclean polyethylene bottles, and 0.5 g of a 15.0 μg g−1 82Se(IV) internal standard was added to each bottle. Three 10 g subsamples of each of the above solutions were weighed into precleaned polyethylene bottles, and appropriate masses of a 25 ng g−1 solution of Sb were added so as to result in approximately a 1-, 2-, and 4-fold increase in the Sb concentration. An amount of 10 g of a solution containing 30% AA and 10% FA was then added to each, resulting in final solutions of 15% AA and 5% FA prior to analysis by PVG ICPMS.
Optimization of the 7500 ICPMS was performed daily. No collision mode was used for the determination of Sb. Typical operating conditions are summarized inTable 1. A 5% solution
of HNO3 was used to efficiently rinse the system between samples to eliminate any carryover. For ID calibration, seawater sample solutions and reverse ID solutions were measured on the same day. The mass bias correction solution was repeatedly measured between samples. Intensities of the Sb isotopes obtained from a blank solution containing 15% AA, 5% FA, and 1.75% NaCl (matching the seawater sample matrix, based on a 10 g seawater sample containing 3.5% NaCl diluted to a final 20 g solution) were subtracted from intensities of Sb isotopes obtained in all samples. For standard additions calibration, samples were measured as follows: unspiked sample, spiked 1×, Table 1. Typical ICPMS Operating Conditions
instrument settings ICPMS
rf power 1300 W
rf matching 1.83 V
plasma Ar gas flow rate 15.0 L min−1 auxiliary Ar gas flow rate 1.00 L min−1
sampler cone orifice 1.00 mm
skimmer cone orifice 0.88 mm
sample depth 5.3 mm torch-H 0.3 mm torch-V −0.2 mm extract 1 −199.9 V extract 2 0 V omega bias-ce −18 V omega lens-ce 4.2 V cell entrance −30 V QP focus 2 V cell exit −30 V OctP rf 131 V OctP bias −4.6 V dwell time 0.05 s UV-PVG Ar carrier gas flow rate to GLS 1.0 L min−1 sample uptake flow rate 0.7 mL min−1
spiked 2×, spiked 4×, unspiked sample. The blank-corrected intensity of 121Sb and 121Sb/82Se ratio was used for the determination of Sb using either standard additions calibration alone or standard additions calibration with internal stand-ardization, respectively.
Safety Considerations. The possible photochemically generated Sb species are unknown and potentially toxic, as may be those from cogenerated species in real sample solutions. Proper ventilation and personal protective equipment should be employed for all manipulations.
■
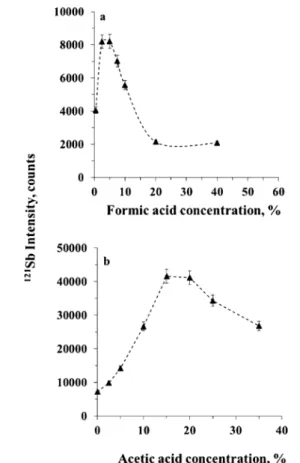
RESULTS AND DISCUSSIONOptimization of UV-PVG. PVG efficiencies are highly dependent on the type and concentration of organic reductants used.22Volatile species of Sb have been generated in formic, acetic, and propionic acid media.24 Among them, acetic acid was found to be more efficient for the PVG of Sb.32,33During the preliminary experiments, efficient photochemical reduction of Sb occurs (steady-state signal obtained) if the concentration of acetic acid is in a range of 10−30% (v/v), as shown inFigure 2a. Only background signal was obtained when the PVG UV
lamp was switched off, confirming sensitivity enhancement of Sb was indeed due to PVG. As reported for As, PVG efficiency was greatly enhanced when a mixture of acetic and formic acids was used.34Thus, the effect of using a mixture of both acids on the PVG efficiency of Sb was investigated. The PVG efficiency of Sb was only slightly higher when 2.5% formic acid was added to the Sb standard solution containing 20% (v/v) acetic acid, as
shown inFigure 2b. Higher concentrations of formic acid led to the decrease in PVG efficiency. Evidently, the use of acetic acid alone is considered sufficient for the PVG of volatile Sb species in Sb standard solution. As reported in previous studies, a severe matrix effect occurs in seawater,25and signals from Sn and Ni were significantly suppressed in the presence of low concentration of chloride.26,35To investigate the effect of this sample matrix on the PVG of Sb, 1 ng g−1Sb standard solution in 20% (v/v) acetic acid and 1.75% NaCl (w/v) (matching the matrix in the prepared seawater solutions) was introduced into the PVG reactor. Response from the solution was only 15% of that from the same concentration of matrix-free standard solution. Because of its complex nature compared to other natural waters, spiked seawater was thus used to investigate optimum PVG conditions for the determination of Sb.
The effect of the concentration of formic acid was first investigated using NASS-6 seawater spiked with 1 ng g−1Sb in the final sample solution. Sample flow rate through the photoreactor was set at 0.5 mL min−1with a carrier gas flow rate to the GLS at 1.0 L min−1. As shown inFigure 3a, response
sharply increased as the formic acid concentration increased from 0% to 2.5% (v/v). In the range of 2.5−5% it remained relatively constant, but declined 5-fold as the formic acid increased to 20% (v/v), thereafter leveling off. Overall, generation efficiency in seawater is much poorer (based on the effect of acetic acid) even in 5% formic acid (optimum) compared to that of standard solution, in agreement with the results of Zheng et. al.24By fixing the concentration of formic acid at 5% (v/v), response increased sharply as acetic acid Figure 2.Effect of formic and acetic acid concentrations on response
from 1 ng g−1 Sb standard solutions (steady-state signal): (a) acetic
acid; (b) formic acid in the presence of 20% acetic acid.
Figure 3.Effect of formic and acetic acid concentrations on response from Sb (steady-state signal) in a spiked NASS-6 seawater: (a) formic acid alone; (b) in the presence of 5% formic acid.
Analytical Chemistry Article
DOI: 10.1021/acs.analchem.5b02001 Anal. Chem. 2015, 87, 7996−8004
concentration increased from 0% to 15%, remained relatively constant from 15% to 20%, and declined sharply beyond 20%. A 7-fold improvement in signal response was obtained in the presence of 15% acetic acid. Interestingly, the generation efficiency of Sb in seawater in 15% (v/v) acetic and 5% formic acids (v/v) was comparable to that of Sb from a simple standard solution in 20% (v/v) acetic acid. This suggests that reductive radicals arising from photodecomposition of formic acid may participate in the generation of both SbH3and SbCO (as in the case of Se),23but also consume potentially oxidative radicals generated from the sample matrix, effectively alleviating the effect of the seawater matrix and facilitating PVG of Sb. A mixture of 15% acetic and 5% formic acids was thus selected for all subsequent studies.
The Ar carrier gas flow rate to the GLS influences the liquid−gas separation efficiency of the volatile Sb species as well as influences the sampling depth in the ICP. Its impact on response from spiked NASS-6 seawater was optimized in the range of 0.8−1.1 L min−1. As shown inFigure 4, an optimum is
obtained at flow rates between 0.975 and 1.05 L min−1 most likely reflects the alteration of the optimum depth of sampling in the plasma at such high flow rates. An optimal Ar carrier gas flow rate to the GLS of 1.0 L min−1 was selected for all subsequent measurements.
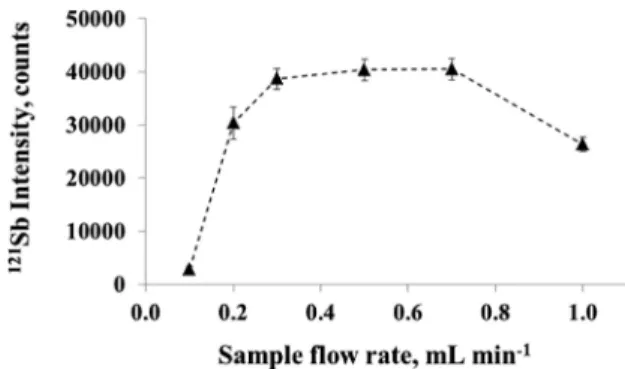
Sample flow rate determines both the irradiation time and the rate of delivery of Sb to the PVG reactor (and by consequence to the ICP). Its effect over the range of 0.1−1.0 mL min−1 was investigated using a NASS-6 seawater spiked with 1 ng g−1Sb containing 15% acetic and 5% formic acids. Results are shown inFigure 5. An optimum is evident in the range of 0.3−0.70 mL min−1, decreasing at both lower and higher values. Low sample uptake rates lead to a smaller rate of delivery of analyte to the PVG reactor and generation of many gas bubbles, resulting in signal fluctuation (the RSD is high under such conditions). Conversely, high flow rates lead to short irradiation times and potentially inefficient reduction of analyte. A 0.7 mL min−1sample uptake rate was chosen for all subsequent measurements, in consideration of sample throughput and sensitivity. At this flow rate, the irradiation time is approximately 60 s.
Figures of Merit.Under optimal experimental conditions, a 15-fold enhancement in sensitivity for Sb is realized using PVG compared to direct solution nebulization (under its optimum conditions). Precision of 4% RSD was obtained from replicate measurements of NASS-6 spiked with 1 ng g−1Sb (n = 5). As
shown inFigure 6, good linear response (slope, 33046 ± 13; intercept, −887 ± 1100; R2 > 0.9999) was obtained from Sb
standard solutions prepared in the range of 0.05−200 ng g−1. When using external calibration, a method detection limit of 0.0006 ng g−1 is obtained, based on 3 times the standard deviation of the analyte concentration arising from the method blank which comprises a solution of 1.75% NaCl, 5% formic acid, and 15% acetic acid in DIW. This LOD is superior to a value of 0.009 ng g−1 obtained using direct solution nebulization based on solutions prepared in 1% HCl. Since steady-state signals are generated, approximately 4 min are required per sample, yielding a throughput of 15 samples/h.
The PVG methodology suffers from memory effects similar to those reported for CHG ICPMS.36Thus, after each analysis, a solution of 5% HNO3was introduced to the PVG reactor for 45 s, efficiently eliminated all carryover.
PVG of Sb in Natural Waters. According to previous reports,11,12the sensitivity of inorganic As(V) was better than As(III) by direct ICPMS and ICPOES determination. Since Sb and As both belong to group 15 elements in the periodic table, they are often considered to behave similarly.5 It is of interest to compare sensitivities among different Sb species by direct ICPMS detection using a PFA ST nebulizer ES-2040. Standards were prepared in 1% HNO3and DIW, respectively; sensitivity differences between Sb(III) and Sb(V) were found to be within 5%. However, inorganic Sb(V) was found approximately 12% more sensitive than Sb(III) when both prepared in 1% HCl, likely due to the formation of SbCl3, similar to that observed for As.11,13 For TMSb prepared in DIW and 1% HCl solutions, respectively, sensitivities were only 50% of that for Sb(V), but increased to 80% in 1% HNO3solution. On the basis of these observations, the measurement accuracy could be improved by using 1% HNO3medium for the determination of Sb in fresh
Figure 4.Effect of Ar carrier gas flow rate on the response from Sb in a spiked NASS-6 seawater.
Figure 5.Effect of sample uptake rate on the response (based on a steady-state signal) of Sb in spiked NASS-6 seawater.
Figure 6.PVG calibration curve generated from standard solutions containing 1.75% NaCl, 5% formic acid, and 15% acetic acid.
water. However, for seawater analysis, high concentration of Cl−in sample matrix might also cause large uncertainty for Sb detection even when 1% HNO3medium is used.
Inorganic species [Sb(V) and Sb(III)] dominate in natural waters, while methylated Sb usually accounts for <10% of the total dissolved Sb.4,37 The monomethyl species is more abundant than the dimethyl form.4 Unfortunately, mono-methylantimony and dimono-methylantimony are not commercially available; thus, trimethylantimony was used as a surrogate to evaluate the PVG efficiency of organo-Sb.38The PVG efficiency for each antimony species was evaluated under optimized conditions by comparing the resultant intensity with that arising from an equal concentration of Sb(V). When the lamp is off, no signals are detected from these standard solutions. With the lamp on, no significant differences (within 5%) in sensitivity for Sb(III) and TMSb(V) are realized compared to Sb(V) standard solution, confirming species-independent generation efficiency. This observation is inconsistent with Zheng et al.,24 wherein more than a 2-fold difference was reported for Sb(III) and Sb(V) under optimized conditions. The discrepancy is likely attributable to the use of different PVG reactors and acid media. As reported by Cabon et al.,16Sb(III) was oxidized to Sb(V) within 5 s of exposure to UV irradiation in the absence of added chemical oxidants. In the presence of 15% acetic and 5% formic acids, photooxidation and photoreduction processes occur simultaneously. It is likely that Sb(III) and any organometallic species are initially rapidly oxidized to Sb(V) and then reduced to their volatile forms, similar to the reactions reported by Suzuki et al.29for the various forms of Se. The elevated temperature of the sample solution through the PVG reactor likely further facilitates these reduction processes. Details of the mechanism clearly need to be further explored, including the identification of the volatile PVG products, which is beyond the scope of this study. Nevertheless, use of this highly efficient PVG reactor permits direct determination of total Sb in natural waters including heavy matrix seawater.
Since HNO3 often has an adverse effect on the PVG efficiencies of many analytes,31,39its effect on response from Sb was also investigated. As shown in Figure 7, significant signal suppression occurs when the concentration of HNO3 exceeds 0.05%. Since NASS-6 and CASS-5 seawater CRMs as well as SLRS-5 river water were acidified with 0.025% HNO3to ensure their long-term stability, no significant impact on PVG
performance is expected with these samples due to HNO3. However, NIST SRM 1640a contains 2% HNO3, necessitating that this CRM be diluted 20-fold with DIW to eliminate the impact of HNO3.
Quantification Strategies. For quantification, external calibration is undoubtedly the most popular for the determination of trace elements. Unfortunately, only 15% recovery was obtained for Sb in seawater when an external calibration established from Sb standard solutions in 20% acetic acid (optimum acid concentration for standard solutions) was used. Obviously, it is not possible to utilize direct determination of Sb in seawater. To compensate for matrix effects and achieve accurate results, standard additions and ID calibrations are often used. ID is capable of compensating for matrix effects, instrument drift, and any losses of analyte during subsequent sample preparation39providing isotopic equilibration has been achieved prior to analysis. Use of ID-ICPMS leverages superior accuracy and precision of results because a ratio, rather than an absolute intensity measurement, is used for quantitation. However, such procedures are obviously not possible for monoisotopic elements, and for their determination in complex matrixes, the use of standard additions provides an alternative strategy. Multiple point standard additions calibration is a more common practice than single-point gravimetric standard addition calibration, despite the former being a more time-consuming process.40The use of internal standardization may further improve analytical precision by correcting for signal drift during analysis.40−42 Evaluation of these various calibration
strategies was examined in this study, including double isotope dilution (ID), multiple and single-point gravimetric standard additions with internal standardization, as well as multiple and single-point gravimetric standard additions calibration alone. 82Se was selected as the internal standard.
Quantitation of Total Sb by Isotope Dilution. Double ID was applied as the “gold standard” among analytical methodologies for quantitation of Sb in CASS-5 and NASS-6 seawater as well as SLRS-5 river water and SRM1640a spring water in accordance with the following equation:43
= ′ − − ′ − − ′ w wm m m m A B R B R A B R A A B R x z y x z y y y xz xz xz xz y y n n n n (1)
where wxis the mass fraction of Sb in the sample (ng g−1); wzis
the mass fraction of primary assay standard (ng g−1); m yis the
mass of spike used to prepare the blend solution of sample and spike (g); mxis the mass of sample used (g); mzis the mass of primary assay standard (g); m′y is the mass of spike used to
prepare the blend solution of spike and primary assay standard solution for reverse ID (g); Ayis the abundance of the reference
isotope in the spike; Byis the abundance of the spike isotope in the spike; Axzis the abundance of the reference isotope in the
sample or primary assay standard; Bxzis the abundance of the spike isotope in the sample or primary assay standard; Rnis the measured reference/spike isotope ratio (mass bias corrected) in the blend solution of sample and spike; R′n is the measured reference/spike isotope ratio (mass bias corrected) in the blend solution of spike and primary assay standard.
To confirm the interference-free measurements of Sb in river water and seawater, unspiked SLRS-5, CASS-5, and NASS-6 were analyzed under the chosen experimental conditions using PVG-ICPMS. Values of 1.34 ± 0.03, 1.32 ± 0.03, and 1.35 ± 0.04 (1 SD, n = 3) for the mass bias corrected121Sb/123Sb ratios were obtained for SLRS-5, CASS-5, and NASS-6, respectively, Figure 7.Effect of HNO3concentration on response from 1 ng g−1Sb
in a mixture of 5% formic and 15% acetic acids and 1.75% NaCl.
Analytical Chemistry Article
DOI: 10.1021/acs.analchem.5b02001 Anal. Chem. 2015, 87, 7996−8004
in good agreement with the expected abundance ratio of 1.337 reported by IUPAC44 confirming interferences free on Sb isotopes. Results are summarized inTable 2, from which it is evident that determined concentrations of Sb in SLRS-5 and NIST 1640a are in agreement with their certified values, confirming the accuracy of the methodology. A method detection limit of 0.0002 ng g−1 based on ID calibration is estimated from 3 times the standard deviation of the analyte concentrations obtained from three spiked blanks. Good precisions, in the range of 0.51−1.4%, were realized.
Quantitation of Total Sb by Standard Additions Calibration. As noted earlier, for monoisotopic elements, such as As, Bi, and Co, ID calibration cannot be employed, and thus alternative techniques must be used. For heavy matrix samples such as seawater, the method of additions is needed to help ensure accuracy. CASS-5 and NASS-6 were selected to compare the performances of several standard additions calibration strategies. In an effort to further compensate for signal drift and fluctuations so as to enhance precision, the impact of addition of82Se [as Se(IV)] as an internal standard (at 10 ng g−1) was studied, based on the premise that PVG of Se is highly efficient and that it behaves in an identical manner to Sb regarding the impact of any changes in plasma conditions, presence of matrix, or variations in other experimental conditions. The possibility of using61Ni for this purpose was also investigated, but82Se(IV) provided a more favorable result for Sb since it exhibited similar behavior during the PVG process.32Note that other added internal standards or naturally existing elements in the sample which have adequate concentrations can be used in combination with standard additions calibration, as long as they have similar behavior to that of the analyte.
Equation 2is used for the calculation of the mass fraction of Sb using multipoint gravimetric standard additions calibration with internal standardization:
= + = − ‐ ‐ m w m m m bR a and w a i i x x i x std std s f (2) where wxis the mass fraction of Sb in the sample (ng g−1); w
std is the mass fraction of Sb in the primary standard solution (ng g−1); R
i is the measured intensity ratio of Sb to internal
standard in a set of standard additions solutions, i = 0
(unspiked sample), 1 (spiked at 1×), 2 (spiked at 2×), 4 (spiked at 4×); mstd‑iis the mass of natural abundance standard used to prepare the spiked sample (g), i = 1, 2, 4; ms‑iis the mass of sample aliquot used to prepare the spiked sample (g), i = 1, 2, 4; mx is the mass (g) of the original sample; mxfis the
final mass (g) of the original sample after addition of internal standard (g); b is the slope and a is the intercept.
Equation 3is used for the calculation of the mass fraction of Sb using multipoint gravimetric standard additions calibration alone: = + = − ‐ ‐ ‐ ‐ m w m m m bI m m a and w a i i x x i s i i x std std s f f s (3)
where wxis the mass fraction of Sb in the sample (ng g−1); w std is the mass fraction of Sb in the primary standard solution (ng g−1); m
std‑iis the mass of natural abundance standard added to prepare the spiked samples (g), i = 0 (unspiked sample), 1 (spiked sample at 1×), 2 (spiked sample at 2×), 4 (spiked sample at 4×); ms‑i is the mass of sample aliquot used to prepare the spiked samples (g), i = 1, 2, 4; msf‑iis the final mass of spiked sample (g), i = 1, 2, 4; mx is the mass (g) of the
original sample; mxfis the final mass (g) of the original sample after addition of internal standard (g); Ii is the measured intensity in the prepared samples, i = 0, 1, 2, 4; b is the slope and a is the intercept.
Equation 4is used for the calculation of the mass fraction of Sb using single-point gravimetric standard addition calibration with internal standardization:
= − w w m m R R R m m x x x std std 0 un sp un f (4) where wxis the mass fraction of the Sb in the sample (ng g−1);
wstdis the mass fraction of Sb in the primary standard solution (ng g−1); R
unis the measured intensity ratio of Sb to internal standard in the unspiked sample; Rspis the measured intensity ratio of Sb to internal standard in the spiked sample (spiked at 2×); mstd is the mass of the standard added to the spiked sample (g); m0is the mass of sample aliquot used to prepared the spiked sample (g); mx is the mass (g) of the original
sample; mxf is the final mass of the original sample after addition of internal standard.
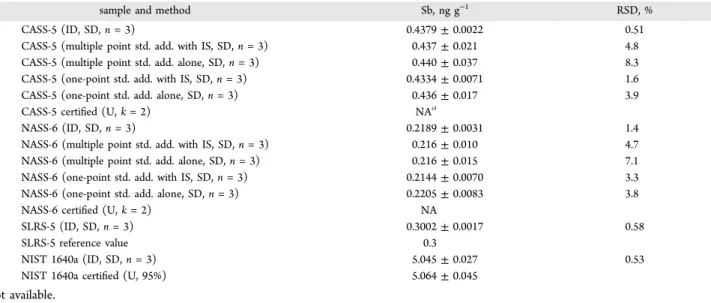
Table 2. Determination of Sb in River Water and Seawater
sample and method Sb, ng g−1 RSD, %
CASS-5 (ID, SD, n = 3) 0.4379 ± 0.0022 0.51
CASS-5 (multiple point std. add. with IS, SD, n = 3) 0.437 ± 0.021 4.8
CASS-5 (multiple point std. add. alone, SD, n = 3) 0.440 ± 0.037 8.3
CASS-5 (one-point std. add. with IS, SD, n = 3) 0.4334 ± 0.0071 1.6
CASS-5 (one-point std. add. alone, SD, n = 3) 0.436 ± 0.017 3.9
CASS-5 certified (U, k = 2) NAa
NASS-6 (ID, SD, n = 3) 0.2189 ± 0.0031 1.4
NASS-6 (multiple point std. add. with IS, SD, n = 3) 0.216 ± 0.010 4.7
NASS-6 (multiple point std. add. alone, SD, n = 3) 0.216 ± 0.015 7.1
NASS-6 (one-point std. add. with IS, SD, n = 3) 0.2144 ± 0.0070 3.3
NASS-6 (one-point std. add. alone, SD, n = 3) 0.2205 ± 0.0083 3.8
NASS-6 certified (U, k = 2) NA
SLRS-5 (ID, SD, n = 3) 0.3002 ± 0.0017 0.58
SLRS-5 reference value 0.3
NIST 1640a (ID, SD, n = 3) 5.045 ± 0.027 0.53
NIST 1640a certified (U, 95%) 5.064 ± 0.045
Equation 5is used for the calculation of the mass fraction of Sb using solely a single-point standard addition calibration:
= − ⎛ ⎝ ⎜⎜ ⎞ ⎠ ⎟⎟ w I w m I m I m m m x x x un std std sp of un 0 f (5) where wxis the mass fraction of Sb in the sample (ng g−1); wstd is the mass fraction of Sb in the standard solution (ng g−1); I
un is the measured intensity of Sb in the unspiked sample; Ispis the measured intensity of Sb in the spiked sample (spiked at 2×);
mstdis the mass of standard added to the spiked sample (g); m0 is the mass (g) of aliquot of sample used to prepared the spiked sample (g); mofis the final mass of the spiked sample (g); mxis
the mass of the original sample (g); mxfis the final mass of the original sample after addition of internal standard (g).
Results are summarized inTable 2. Good agreement among the different calibration strategies is evident, but it is clear that the use of an internal standard significantly improves measurement precision. Compared to multipoint standard additions, precision is enhanced when single-point gravimetric standard addition calibration is performed, and this is further improved by incorporating internal standardization. Since the linear range of modern ICPMS is large (at least 6 orders of magnitude) and gravimetric sample preparation eliminates any possibility of gross error, one-point gravimetric standard addition calibration with/without internal standardization offers an extremely attractive choice for high-throughput accurate quantitation of monoisotopic elements. As expected, however, ID calibration provides the best results.
Unfortunately, no certified value is provided for Sb in either seawater CRM. To further validate the method for analysis of seawater, spike recovery tests were performed. Seawater samples were spiked at 0.25 and 1 ng g−1 of Sb in NASS-6 and CASS-5, respectively. Single-point gravimetric standard addition calibration with internal standardization was applied to these samples. Spike recoveries of 100.6 ± 5.5% and 100.8 ± 3.8% (SD, n = 3) were obtained for NASS-6 and CASS-5, respectively, confirming the accuracy of the proposed method for analysis of seawater.
■
CONCLUSIONA novel and sensitive approach for the direct, accurate, and precise determination of total Sb in natural waters is presented based on PVG sample introduction and ICPMS detection. A 15-fold enhancement in sensitivity was realized compared to direct solution nebulization. The method provides LODs of 0.0006 and 0.0002 ng g−1 for Sb using external and isotope dilution calibration, respectively, suitable for ultratrace deter-minations of Sb in natural waters. The severe matrix effect from seawater was efficiently eliminated by using a mixture of formic and acetic acids as the photochemical reductant, making direct determination of Sb in seawater feasible. Although ID calibration provides superior measurement precisions, one-point gravimetric standard addition calibration with internal standardization provides an inexpensive fit-for-purpose strategy for the analysis of seawater samples.
■
AUTHOR INFORMATIONCorresponding Author
*E-mail: lu.yang@nrc-cnrc.gc.ca.
Notes
The authors declare no competing financial interest.
■
ACKNOWLEDGMENTSThe National Natural Science Foundation of China (Grant Nos. 21205007, 21128006), the China Scholarship Council and The National Natural Science Foundation of China (Grant Nos. 21205007, 21128006), the China Scholarship Council, the Scientific Research Fund of Science and Technology Depart-ment of Sichuan province (No. 2014JY0155), and the “cultivating program of middle-aged supporting teachers” of Chengdu University of Technology (Grant No. KYGG2014) are acknowledged for financial support.
■
REFERENCES(1) Water Related Fate of the 129 Priority Pollutants, Vol. 1; EP-440/ 444-479-029A; United States Environmental Protection Agency, U.S. Government Printing Office: Washington, DC, 1979.
(2) Council Directive 76/464/EEC of 4 May 1976 on Pollution Caused by Certain Dangerous Substances Discharged into the Aquatic Environment of the Community. Off. J. Eur. Communities: Legis. 1976,
L129, 23−29.
(3) Iyengar, G. V.; Tanner, J. T.; Wolf, W. R.; Zeisler, R. Sci. Total
Environ. 1987, 61, 235−252.
(4) Filella, M.; Belzile, N.; Chen, Y. W. Earth-Sci. Rev. 2002, 57, 125− 176.
(5) He, M.; Wang, X.; Wu, F.; Fu, Z. Sci. Total Environ. 2012,
421-422, 41−50.
(6) Chen, Y. W.; Deng, T. L.; Filella, M.; Belzile, N. Environ. Sci.
Technol. 2003, 37, 1163−1168.
(7) Okkenhaug, G.; Zhu, Y.-G.; He, J.; Li, X.; Luo, L.; Mulder, J.
Environ. Sci. Technol. 2012, 46, 3155−3162.
(8) Miravet, R.; Hernandez-Nataren, E.; Sahuquillo, A.; Rubio, R.; Lopez-Sanchez, J. F. TrAC, Trends Anal. Chem. 2010, 29, 28−39.
(9) Hill, S. Inductively Coupled Plasma Spectrometry and Its
Applications; Blackwell Publishing: Oxford, U.K., 2007; pp 98−121.
(10) Hansen, H. R.; Pergantis, S. A. Anal. Chem. 2007, 79, 5304− 5311.
(11) Narukawa, T.; Kuroiwa, T.; Chiba, K. Talanta 2007, 73, 157− 165.
(12) Yu, L. L.; Butler, T. A.; Turk, G. C. Anal. Chem. 2006, 78, 1651−1656.
(13) Narukawa, T.; Chiba, K.; Kuroiwa, T.; Inagaki, K. J. Anal. At.
Spectrom. 2010, 25, 1682−1687.
(14) Calvo Fornieles, A.; Garcia de Torres, A.; Vereda Alonso, E. I.; Cano Pavon, J. M. J. Anal. At. Spectrom. 2013, 28, 364−372.
(15) Ellwood, M. J.; Maher, W. A. J. Anal. At. Spectrom. 2002, 17, 197−203.
(16) Cabon, J. Y.; Madec, C. L. Anal. Chim. Acta 2004, 504, 209− 215.
(17) Bendicho, C.; Pena, F.; Costas, M.; Gil, S.; Lavilla, I. TrAC,
Trends Anal. Chem. 2010, 29, 681−691.
(18) Miravet, R.; Bonilla, E.; Lopez-Sanchez, J. F.; Rubio, R. Appl.
Organomet. Chem. 2006, 20, 12−19.
(19) Nakazato, T.; Tao, H. Anal. Chem. 2006, 78, 1665−1672. (20) Yoon, S. H.; Lee, J. H.; Oh, S.; Yang, J. E. Water Res. 2008, 42, 3455−3463.
(21) Guo, X. M.; Sturgeon, R. E.; Mester, Z.; Gardner, G. J. Anal.
Chem. 2004, 76, 2401−2405.
(22) Yin, Y.; Liu, J.; Jiang, G. TrAC, Trends Anal. Chem. 2011, 30, 1672−1684.
(23) Sturgeon, R. E.; Grinberg, P. J. Anal. At. Spectrom. 2012, 27, 222−231.
(24) Zheng, C.; Ma, Q.; Wu, L.; Hou, X.; Sturgeon, R. E. Microchem.
J. 2010, 95, 32−37.
(25) Guo, X. M.; Sturgeon, R. E.; Mester, Z.; Gardner, G. J. Anal.
Chem. 2003, 75, 2092−2099.
(26) Liu, L.; Deng, H.; Wu, L.; Zheng, C.; Hou, X. Talanta 2010, 80, 1239−1244.
Analytical Chemistry Article
DOI: 10.1021/acs.analchem.5b02001 Anal. Chem. 2015, 87, 7996−8004
(27) Duan, H.; Gong, Z.; Yang, S. J. Anal. At. Spectrom. 2015, 30, 410−416.
(28) Sturgeon, R. E. Anal. Chem. 2015, 87, 3072−3079.
(29) Suzuki, T.; Sturgeon, R. E.; Zheng, C.; Hioki, A.; Nakazato, T.; Tao, H. Anal. Sci. 2012, 28, 807−811.
(30) De Jesus, A.; Sturgeon, R. E.; Liu, J.; Silva, M. M. Microchem. J. 2014, 117, 100−105.
(31) Gao, Y.; Xu, M.; Sturgeon, R. E.; Mester, Z.; Shi, Z.; Galea, R.; Saull, P.; Yang, L. Anal. Chem. 2015, 87, 4495−4502.
(32) Zheng, C.; Sturgeon, R. E.; Brophy, C.; Hou, X. Anal. Chem. 2010, 82, 3086−3093.
(33) Zheng, C. B.; Ma, Q.; Wu, L.; Hou, X. D.; Sturgeon, R. E.
Microchem. J. 2010, 95, 32−37.
(34) Guo, X. M.; Sturgeon, R. E.; Mester, Z.; Gardner, G. J. J. Anal.
At. Spectrom. 2005, 20, 702−708.
(35) Duan, H.; Gong, Z.; Yang, S. J. Anal. At. Spectrom. 2015, 30, 410−416.
(36) Kumamaru, T.; Yamamoto, M.; Nakata, F.; Tsubota, H.; Nishikida, K.i. Anal. Sci. 1994, 10, 651−653.
(37) Ungureanu, G.; Santos, S.; Boaventura, R.; Botelho, C. J.
Environ. Manage. 2015, 151, 326−342.
(38) De Gregori, I.; Quiroz, W.; Pinochet, H.; Pannier, F.; Potin-Gautier, M. J. Chromatogr. A 2005, 1091, 94−101.
(39) Zheng, C. B.; Yang, L.; Sturgeon, R. E.; Hou, X. D. Anal. Chem. 2010, 82, 3899−3904.
(40) Yang, L.; Pagliano, E.; Mester, Z. Anal. Chem. 2014, 86, 3222− 3226.
(41) Chen, S. Y.; Zhang, Z. F.; Yu, H. M.; Liu, W. Q.; Sun, M. Anal.
Chim. Acta 2002, 463, 177−188.
(42) Serapinas, P.; Labarraque, G.; Charlet, P.; Ezerinskis, Z.; Juzikiene, V. J. Anal. At. Spectrom. 2010, 25, 624−630.
(43) Yang, L.; Sturgeon, R. E. J. Anal. At. Spectrom. 2009, 24, 1327− 1335.
(44) Berglund, M.; Wieser, M. E. Pure Appl. Chem. 2011, 83, 397− 410.