Pépite | Développement et caractérisation d’un démonstrateur de générateur thermoélectrique à base de membranes de silicium couplées à de l’ingénierie phononique
144
0
0
Texte intégral
(2) Thèse de Thierno Moussa Bah, Université de Lille, 2019. Page |2. © 2019 Tous droits réservés.. lilliad.univ-lille.fr.
(3) Thèse de Thierno Moussa Bah, Université de Lille, 2019. Page |3. THESE Présentée à l’Université de Lille Ecole Doctorale des Sciences pour l’Ingénieur Institut d’Electronique, de Microélectronique et de nanotechnologies de Lille STMicroelectronics Crolles Pour obtenir le grade de : DOCTEUR DE L’UNIVERSITE Spécialité: MICRO-NANO SYSTEMES ET CAPTEURS Par. Thierno Moussa BAH Development and characterization of a thermoelectric harvester demonstrator using phonon engineered silicon membranes Soutenue le 03 Juillet 2019 devant le Jury composé de : Mr. Olivier BOURGEOIS, Directeur de Recherche CNRS, Institut Néel, Grenoble Mme. Sylvie HEBERT, Directrice de Recherche CNRS, CRISMAT, Caen. Président du Jury Rapporteur Rapporteur. Mme. Edith KUSSENER, Enseignant-Chercheur, ISEN-IM2NP, Toulon. Examinateur. Mr. Guillaume SAVELLI, Ingénieur R&D – Chef de Projets, CEA-Liten, Grenoble. Examinateur. Mr. Stéphane MONFRAY, Ingénieur R&D , STMicroelectronics, Crolles. Co-encadrant de thèse. Mr. Jean-François ROBILLARD, Enseignant-Chercheur, ISEN-IEMN, Lille. Co-encadrant de thèse. Mr. Thomas SKOTNICKI, Professeur, CEZAMAT-Univ. Polytech. Varsovie. Co-Directeur de thèse. Mr. Emmanuel DUBOIS, Directeur de recherche CNRS, ISEN-IEMN, Lille. Directeur de thèse. © 2019 Tous droits réservés.. lilliad.univ-lille.fr.
(4) Thèse de Thierno Moussa Bah, Université de Lille, 2019. Page |4. © 2019 Tous droits réservés.. lilliad.univ-lille.fr.
(5) Thèse de Thierno Moussa Bah, Université de Lille, 2019. Page |5. Mille Mercis Cette thèse a été effectué au sein du l’Institut d’Electronique Microélectronique et Nanotechnologies de Lille (IEMN) et financé par (convention CIFRE) par STMicroelectronics Crolles et a été possible grâce au concours de plusieurs personnes à qui je voudrais témoigner toute ma gratitude. Je voudrais tout particulièrement adresser toute ma reconnaissance à mes directeurs de thèses, les Dr. Emmanuel Dubois et Prof. Thomas Skotnicki, ainsi qu’à mes co-encadrants, Dr. JeanFrançois Robillard et Dr. Stephane Monfray tout d’abord pour la confiance placée en moi en me confiant cette thématique de thèse. Mais encore plus pour leur patience, disponibilités et conseils, … en somme pour m’avoir mis dans les meilleures conditions pour la réalisation de cette thèse. Un grand merci aussi à Maciej Haras et Valeria Lacatena mes prédécesseurs sur cette thématique pour les travaux effectués avant et surtout pour leurs accompagnements et conseils durant mes premiers mois de thèse. Je remercie aussi le reste de l’équipe µE Si : Justine Philippe, Jean-Marc Boucaud, Mathieu Berthomé, Stanislav Didenko, Tianqi Zhu, Di Zhou, Jun Yin, Arun Bhaskar and Quentin Hivin pour l’aide qu’ils m’ont apporté sur l’utilisation des équipements ou la compréhension de technologies qui ne m’étaient pas familier(e)s ainsi que les suggestions et collaborations que j’ai pu effectuer avec certains d’entre eux. Un grand merci aussi à Jean-Michel Droulez qui a mis à ma disposition tous les outils informatiques indispensables à la réalisation de mes travaux et aussi à Florence Alberti pour avoir grandement facilité les différents déplacements effectués durant cette thèse, ainsi que l’organisation de la soutenance de thèse. Les travaux effectués durant cette thèse et présentés dans les chapitres suivants ont été majoritairement effectués au sein de la centrale de micro et nano fabrication de l’IEMN, dont je souhaiterais remercier le directeur de l’IEMN Lionel Buchaillot et l’équipe de la centrale : François Vaurette, Marc François, Pascal Tilmant, Christiane Legrand, Dmitri Yarekha, Garrett Curley, Laurent Fugère, David Delcroix, Marc Dewitte, Annie Fattorini, Christophe Boyaval, Arnaud Pageau, Flavie Braud, Isabelle Roch-Jeune, Bertrand Grimbert et Guillaume Cochez pour les formations à l’utilisation des différents équipements qui ont été indispensables à la réalisation de mes travaux, aussi pour les opérations réalisées par leurs soins lorsque je n’en avais pas les compétences ou que les équipements n’étaient pas ouvert à tous les usagers. Après la réalisation des composants, les différentes étapes de caractérisations des composants réalisés ont été effectués au sein de la plateforme de caractérisation de l’IEMN. J’exprime ma gratitude à Sylvie Lepilliet pour son accompagnement tout au long de la caractérisation thermoélectrique des composants, Etienne Okada pour son aide lors de la réalisation des images infrarouges et son aide sur la caractérisation thermoélectrique lorsque Sylvie n’était pas disponible, ainsi que Sophie Eliet et Vanessa Avramovic. Mes remerciements vont aussi à Fuanki Bavedila, Carlos Alberto Paragua, Malek Zegaoui, Vinay Kumar Chinni, Colin Mismer et Sara Bretin pour leurs aides « au quotidien » lorsque j’ai débuté mes travaux en centrale de micro-nano fabrication pour le développement de recettes de fabrications, l’utilisation de certains équipements. Je remercie également Adama, Kathia, Cybelle, Joao, khadim, Sidy, Boubacar, Hassimiou, Cheick, Ibrahima et Mohammed pour leur soutien, ainsi que pour m’avoir facilité l’installation sur Lille. Enfin, Je remercie grandement ma famille, mes parents et notamment mon père Boubacar Bah qui malgré toutes les difficultés que cela représentait, a toujours insisté et tout mis en place afin que mes frères et moi puissions poursuivre nos études et réaliser nos ambitions. Je ne peux conclure ces remerciements, sans témoigner toute la gratitude que j’ai à l’égard de Mr. Bernard Salvaing et toute sa famille qui ont toujours soutenu et continuent à soutenir l’éducation de mes frères et moi.. © 2019 Tous droits réservés.. lilliad.univ-lille.fr.
(6) Thèse de Thierno Moussa Bah, Université de Lille, 2019. Page |6. © 2019 Tous droits réservés.. lilliad.univ-lille.fr.
(7) Thèse de Thierno Moussa Bah, Université de Lille, 2019. Page |7 MILLE MERCIS ............................................................................................................................................ 3 THESIS SUMMARY: ..................................................................................................................................... 11 RESUME DE LA THESE : ................................................................................................................................ 11 GENERAL INTRODUCTION ......................................................................................................................... 13 CHAPTER 1:. SILICON BASED THERMOELECTRIC HARVESTERS: PROBLEMATICS AND CHALLENGES ..... 15. ABSTRACT ................................................................................................................................................ 15 1.1 WIRELESS SENSORS NETWORKS AND POWER SUPPLY ............................................................................. 16 1.2 THERMOELECTRIC ENERGY HARVESTING ............................................................................................. 18 1.2.1 Thermoelectric Effects .............................................................................................................. 18 1.2.1.1 1.2.1.2 1.2.1.3. The Seebeck Effect ................................................................................................................... 18 The Peltier Effect ...................................................................................................................... 18 The Thomson Effect.................................................................................................................. 18. 1.2.2 Thermoelectric properties......................................................................................................... 18 1.2.2.1 1.2.2.2 1.2.2.3. Thermal conductivity ................................................................................................................ 20 Seebeck Coefficient .................................................................................................................. 20 Electrical conductivity............................................................................................................... 21. 1.2.3 Materials choice....................................................................................................................... 21 1.3 SILICON FOR THERMOELECTRIC HARVESTING ........................................................................................ 24 1.3.1 Silicon enhancement to an efficient thermoelectric material ..................................................... 25 1.3.1.1 1.3.1.2. Nanowires ................................................................................................................................ 25 Phononic engineering ............................................................................................................... 27. 1.3.2 Silicon based micro-harvesters state of the art .......................................................................... 33 1.3.3 Silicon germanium based micro harvester ................................................................................. 35 1.4 BEST MICRO-HARVESTERS FOR NEAR ROOM TEMPERATURE APPLICATIONS ................................................... 37 CONCLUSION ............................................................................................................................................ 41 CHAPTER 2: MODELING STUDIES OF THE SI BASED THERMOELECTRIC HARVESTER WITH RESPECT TO A COMMERCIAL STATE-OF-THE-ART .................................................................................................................. 43 ABSTRACT ................................................................................................................................................ 43 2.1 SILICON TEG MODELING ................................................................................................................. 43 2.1.1 The model ................................................................................................................................ 44 2.1.1.1 2.1.1.2 2.1.1.3. Thermal conduction ................................................................................................................. 45 Conducto-convection ............................................................................................................... 46 Thermal radiation ..................................................................................................................... 46. 2.1.2 Finite Element Modeling........................................................................................................... 47 2.1.3 Equivalent analytic modeling .................................................................................................... 48 2.1.4 Optimal Si-TEG dimensions ....................................................................................................... 50 2.2 COMMERCIAL MICRO TEG STUDY ..................................................................................................... 51 2.2.1 Commercial TEG model ............................................................................................................ 51 2.2.2 Commercial model validation ................................................................................................... 52 2.2.3 Effect of the cooling conditions on the TEG performances ......................................................... 52 2.3 TEGS BENCHMARKING ................................................................................................................... 54 2.3.1 Thermal gradient management in the Si planar based TEG ....................................................... 55 2.3.2 Si based TEG Vs. Commercial micro generator .......................................................................... 56 2.3.3 Planar BiTe and Vertical Si: What can we expect? ..................................................................... 58 CONCLUSION ............................................................................................................................................ 60 CHAPTER 3:. SILICON BASED THERMOELECTRIC HARVESTER DEMONSTRATORS REALIZATION ........... 63. ABSTRACT ................................................................................................................................................ 63 3.1 DEVICES DESIGN ........................................................................................................................... 65 3.1.1 TEGs demonstrators ................................................................................................................. 65 3.1.2 Thermoelectric properties extraction platform .......................................................................... 68 3.1.3 Doping level Measurements ..................................................................................................... 70 3.1.4 Thermal gradient management devices .................................................................................... 71 3.2 DEVICES REALIZATION .................................................................................................................... 72 3.2.1 Wafer cleaning & Alignment markers patterning ...................................................................... 73. © 2019 Tous droits réservés.. lilliad.univ-lille.fr.
(8) Thèse de Thierno Moussa Bah, Université de Lille, 2019. Page |8 3.2.2 Phononic engineering patterning .............................................................................................. 75 3.2.2.1 3.2.2.2. Dots on the fly.......................................................................................................................... 75 Overdosing method .................................................................................................................. 76. 3.2.3 Ion implantation ...................................................................................................................... 78 3.2.3.1 3.2.3.2. SOI oxidation............................................................................................................................ 79 Ion implantation parameters .................................................................................................... 81. 3.2.4 Cavities Opening & SiN removing from SOI ............................................................................... 83 3.2.5 Metal deposition ...................................................................................................................... 86 3.2.5.1 3.2.5.2. Platinum metallization .............................................................................................................. 87 Gold metallization .................................................................................................................... 89. 3.2.6 Silicon membranes suspension ................................................................................................. 90 3.2.6.1 3.2.6.2. XeF2 vapor etching.................................................................................................................... 91 HF Vapor etching ...................................................................................................................... 92. 3.3 THE REALIZED DEVICES ................................................................................................................... 93 3.3.1 Electrical conductivity measurements device ............................................................................ 93 3.3.2 Thermal gradient management device ..................................................................................... 94 3.3.3 Thermoelectric properties measurements platforms ................................................................. 94 3.3.4 Thermoelectric harvester demonstrators .................................................................................. 95 CONCLUSION ............................................................................................................................................ 95 CHAPTER 4:. SILICON BASED THERMOELECTRIC HARVESTER DEMONSTRATORS CHARACTERIZATION 98. ABSTRACT ................................................................................................................................................ 98 4.1 CHARACTERIZATION PROTOCOL ...................................................................................................... 100 4.1.1 Doping level / Electrical conductivity measurement ................................................................ 100 4.1.1.1 4.1.1.2. Principle ................................................................................................................................. 100 Measurement conditions ........................................................................................................ 102. 4.1.2 Thermal gradient management .............................................................................................. 103 4.1.2.1 4.1.2.2. Principle ................................................................................................................................. 103 Characterization conditions .................................................................................................... 104. 4.2 THERMOELECTRIC PROPERTIES CHARACTERIZATION .............................................................................. 105 4.2.1 Doping level ........................................................................................................................... 105 4.2.2 Phononic engineering impact on the electrical conductivity..................................................... 106 4.2.3 Phononic engineering impact on the temperature gradient management ............................... 108 4.2.3.1 4.2.3.2. Pt heater serpentine calibration.............................................................................................. 108 Temperature gradient management ....................................................................................... 109. 4.3 THERMOELECTRIC HARVESTER DEMONSTRATORS ................................................................................. 110 4.3.1 Characterization methodologies ............................................................................................. 111 4.3.1.1 4.3.1.2 4.3.1.3. Pt heaters calibration ............................................................................................................. 111 Seebeck measurement ........................................................................................................... 112 Demonstrators’ Current-Voltage curves .................................................................................. 112. 4.3.2 Last realized demonstrators’ characterizations ....................................................................... 113 4.3.2.1 4.3.2.2 4.3.2.3 4.3.2.4. Demonstrators hot sources calibration ................................................................................... 114 Seebeck coefficient measurements ......................................................................................... 115 Current-Voltage curves ........................................................................................................... 116 Phonon engineering TEG performance Vs. Plain TEG performance........................................... 120. 4.3.3 First realized demonstrators ................................................................................................... 122 4.3.3.1 4.3.3.2. First batch .............................................................................................................................. 123 Second batch.......................................................................................................................... 124. 4.3.4 Measurements vs. Finite Element Model................................................................................. 124 4.3.5 Benchmarking with micro-harvesters state of the art .............................................................. 125 4.4 THERMOELECTRIC COOLING WITH THE SAME DEMONSTRATORS? ............................................................. 126 4.4.1 Characterizations’ principle .................................................................................................... 127 4.4.2 Raw IR Imaging ...................................................................................................................... 127 4.4.3 Peltier effect extraction .......................................................................................................... 128 CONCLUSION .......................................................................................................................................... 129 GENERAL CONCLUSION & PERSPECTIVES ................................................................................................ 132 SCIENTIFIC PRODUCTION ........................................................................................................................ 136. © 2019 Tous droits réservés.. lilliad.univ-lille.fr.
(9) Thèse de Thierno Moussa Bah, Université de Lille, 2019. Page |9 JOURNALS: ............................................................................................................................................. 136 CONFERENCES: ....................................................................................................................................... 136 AWARDS: .............................................................................................................................................. 136 ACTIVITIES: ............................................................................................................................................ 137 BIBLIOGRAPHY ........................................................................................................................................ 138. © 2019 Tous droits réservés.. lilliad.univ-lille.fr.
(10) Thèse de Thierno Moussa Bah, Université de Lille, 2019. P a g e | 10. © 2019 Tous droits réservés.. lilliad.univ-lille.fr.
(11) Thèse de Thierno Moussa Bah, Université de Lille, 2019. P a g e | 11. Thesis Summary: The lack of reliable, safe and low-cost energy source seems to delay the blooming of the internet of things (IoT) and wireless sensors nodes. Thermoelectric harvesters feature those key advantages. Silicon presents the advantages to be most abundant, less environmental harmful and to benefit from facilities and technological processes for low cost thermoelectric harvesters mass production compared to the conventional materials (bismuth telluride alloys). However, silicon is a poor thermoelectric material due to its high thermal conductivity (150𝑊𝑚−1 𝐾 −1 ). The possibility to reduce the thermal conductivity while preserving electrical conductivity and Seebeck coefficient is the key to upgrade silicon as an efficient thermoelectric material. To that end, efforts are oriented towards the phononic part of heat transport, which is the dominant contribution in semiconductors. The researches carried out during this thesis dealt with the integration of phonon engineered silicon membranes into thermoelectric harvester demonstrators and their characterizations with respect to the state of the art. The results demonstrated the feasibility of a silicon based thermoelectric harvester exhibiting performance (from few µW/cm2 for ΔT~5-10K to few mW/cm2 for ΔT>100K) sufficient for autonomous sensor nodes’ power supplying and comparable performance with the bismuth telluride state of the art harvester according to the harvesters’ cooling conditions. Moreover, this thesis demonstrated, in addition to the energy harvesting, the possibility of developing silicon based thermoelectric coolers, opening the way to possible integration of thermoelectric coolers in silicon based micro-electronic devices.. Résumé de la thèse : L'essor de l'internet des objets (IoT) et des capteurs autonomes et communicants semble être retardé en raison du manque de source d’énergie fiable, sûre et à faible coût. Les récupérateurs d’énergies thermoélectriques présentent ces avantages clés. Le silicium présente les avantages d'être très abondant, moins polluant et de bénéficier d'installations et de procédés technologiques permettant la production en série de récupérateurs d’énergies thermoélectriques à faible coût par rapport aux matériaux conventionnel (alliages de tellure de bismuth). Toutefois, le silicium est un matériau thermoélectrique médiocre en raison de sa conductivité thermique élevée (150𝑊𝑚−1 𝐾 −1 ). La possibilité de réduire la conductivité thermique tout en préservant la conductivité électrique et le coefficient Seebeck est la clé pour améliorer le silicium en tant que matériau thermoélectrique efficace. À cette fin, les efforts sont orientés vers la partie phononique du transport de chaleur, qui constitue la contribution dominante dans les semi-conducteurs. Les recherches menées au cours de cette thèse ont porté sur l'intégration des membranes de silicium nanostructurées de réseaux phononiques dans des démonstrateurs de récupérateurs d’énergies thermoélectriques et leur caractérisation au regard de l'état de l’art. Les résultats de ces études ont démontré la faisabilité d’un récupérateur d’énergie thermoélectrique à base de silicium présentant des performances (De quelques µW/cm2 pour ΔT~5-10K à quelques mW/cm2 pour ΔT>100K) suffisantes pour l’alimentation en énergie de nœuds de capteurs autonomes et des performances comparables à celles d’un récupérateur (état de l’art) à base de tellure de bismuth en fonction des conditions de refroidissement de ces derniers. De plus, cette thèse a démontré, outre la récupération d'énergie, la possibilité de développer des refroidisseurs thermoélectriques à base de silicium, ouvrant la voie à une possible intégration de refroidisseurs thermoélectriques dans des dispositifs microélectroniques à base de silicium. © 2019 Tous droits réservés.. lilliad.univ-lille.fr.
(12) Thèse de Thierno Moussa Bah, Université de Lille, 2019. P a g e | 12. © 2019 Tous droits réservés.. lilliad.univ-lille.fr.
(13) Thèse de Thierno Moussa Bah, Université de Lille, 2019. P a g e | 13. General Introduction The blooming of the so-called Internet of things (IoT) and wireless sensors nodes (WSN) raise the problematic of finding reliable and easily available energy sources. Moreover, according to [Nordrum 2016], this blooming seems to be delayed owing to the lack of reliable, safe and low-cost energy source. Thermoelectric energy harvesting features key advantages of reliability and is complementary to other energy sources. However, its efficiency is intrinsically limited to a few percent around room temperature and usually relies on harmful materials. Indeed, for near room temperature applications the best thermoelectric materials are alloys of bismuth and telluride (rare, expensive and environmentally harmful). These drawbacks of the best thermoelectric material limit currently thermoelectric harvesting to specific applications. Silicon (the most abundant and used semiconductor) can be the key to answer the problematics of cost and environmental impact rose by conventional materials use. However, silicon is a poor thermoelectric material due to its very high thermal conductivity (hundred times higher than bismuth telluride thermal conductivity). Reducing the silicon thermal conductivity became for the two last decades a subject of high interest in the thermoelectric community. The results from this research demonstrated the importance of developing low dimensionality material in order to reduce the silicon thermal conductivity. Indeed, significant silicon thermal conductivity reduction have been demonstrated by using silicon nanowires [Boukai et al. 2008] and thin films patterned with nanoscale holes [Tang et al. 2010] for example. Research also focus on developing silicon based micro thermoelectric harvester demonstrators. Those demonstrators are mainly made of silicon nanowires and thin films. However, those demonstrators do not exhibit sufficient performances to compete with the bismuth telluride state of the art micro thermoelectric harvesters (cf. chapter 1). The work carried out throughout this thesis aims at studying and developing a silicon based micro thermoelectric harvester demonstrator, sufficiently efficient to power supply autonomous sensors nodes. This work is in the continuity of two previous thesis [Haras 2016; Lacatena 2016] aiming at improving the silicon’s thermoelectric properties by reducing its thermal conductivity. By coupling the Si membranes dimension reduction with phononic engineering patterning, the two thesis allowed to reduce the thermal conductivity from 148 W/m/K (bulk silicon) to 34.5 W/m/K [Haras et al. 2016]. The manuscript includes four chapters. The first chapter reviews the need of energy harvesting rose by the development and blooming of wireless sensor networks (WSN) by comparing the energy needed to power supply the WSN and the harvestable energy from common energy harvesting techniques. Later, the theory behind thermal energy harvesting, before reviewing key results of micro energy harvesters. The review focuses mainly on silicon thermoelectric properties improvement and its integration into micro thermoelectric harvesters for near room temperature applications. The review focuses also on the best micro-harvesters developed so far for applications near room temperature (even if they are not made of silicon). The second chapter deals with the theoretical study of the silicon based thermoelectric harvester demonstrator developed. This study aims at: . © 2019 Tous droits réservés.. Estimating the performances that we can expect from such generators Determining the optimal dimensions for the demonstrators’ realization Benchmarking the planar Si based TEG with commercial based thermoelectric harvester o Understand the benefits and the drawbacks of the Si based TEG with respect to the commercial one.. lilliad.univ-lille.fr.
(14) Thèse de Thierno Moussa Bah, Université de Lille, 2019. P a g e | 14 Modeling is done by means of FEM (Finite Element Modeling). Analytic models are also developed in order to: . Check the consistency of the FEM and an analytic model based on thermoelectric equations Save computation time, after checking the consistency of FEM and analytic model The third chapter describes the realization process of the phonon engineered silicon membranes based thermoelectric harvester demonstrator. In addition to the harvester demonstrators’ realization (main objective of this chapter) elementary devices indispensable, to complete the demonstrators’ characterization (thermal conductivity, Seebeck coefficient and electrical conductivity measurement platforms) are also characterized. The chapter presents first the different devices designs, before detailing the different fabrication steps. The fourth and last chapter describes the characterization of the different devices realized during this thesis work and discuss the different results. The chapter is organized in four main parts: . . . . © 2019 Tous droits réservés.. First, the description of the different characterization protocols: How the measurements are performed on the different devices, under which environment are performed the measurements, the different apparatus needed for the characterizations. Second, the chapter focuses in the thermoelectric properties on the different elementary devices (all except the demonstrators) and especially, the impact of the phonon engineering on those thermoelectric properties. Third, the harvester demonstrators’ characterizations are performed. In this third section (the main one), the demonstrators’ characterization methodologies are detailed before focusing on extracting the different thermoelectric performances (thermoelectric voltage, produced electrical power, …) and the performances discussion with respect to the modeling results presented in chapter 2 and the state of the art micro-harvesters’ performances. Finally, after the problematic of thermoelectric harvesting, the chapter deals with the possibility of using the developed demonstrators as thermoelectric coolers through the investigation of the Peltier effect on the developed demonstrators.. lilliad.univ-lille.fr.
(15) Thèse de Thierno Moussa Bah, Université de Lille, 2019. P a g e | 15. Chapter 1:. Silicon based thermoelectric harvesters: Problematics and Challenges. Abstract This first chapter reviews the need of energy harvesting rose by the development and blooming of wireless sensor networks (WSN) by comparing the energy needed to power supply the WSN and the harvestable energy from common energy harvesting techniques. Later, the theory behind thermal energy harvesting, before reviewing key results of micro energy harvesters. The review focuses mainly on silicon thermoelectric properties improvement and its integration into micro thermoelectric harvesters for near room temperature applications. The review focuses also on the best micro-harvesters developed so far for applications near room temperature (even if they are not made of silicon). ABSTRACT ................................................................................................................................................ 15 1.1 WIRELESS SENSORS NETWORKS AND POWER SUPPLY ............................................................................. 16 1.2 THERMOELECTRIC ENERGY HARVESTING ............................................................................................. 18 1.2.1 Thermoelectric Effects .............................................................................................................. 18 1.2.1.1 1.2.1.2 1.2.1.3. The Seebeck Effect ................................................................................................................... 18 The Peltier Effect ...................................................................................................................... 18 The Thomson Effect.................................................................................................................. 18. 1.2.2 Thermoelectric properties......................................................................................................... 18 1.2.2.1 1.2.2.2 1.2.2.3. Thermal conductivity ................................................................................................................ 20 Seebeck Coefficient .................................................................................................................. 20 Electrical conductivity............................................................................................................... 21. 1.2.3 Materials choice....................................................................................................................... 21 1.3 SILICON FOR THERMOELECTRIC HARVESTING ........................................................................................ 24 1.3.1 Silicon enhancement to an efficient thermoelectric material ..................................................... 25 1.3.1.1 1.3.1.2. Nanowires ................................................................................................................................ 25 Phononic engineering ............................................................................................................... 27. 1.3.2 Silicon based micro-harvesters state of the art .......................................................................... 33 1.3.3 Silicon germanium based micro harvester ................................................................................. 35 1.4 BEST MICRO-HARVESTERS FOR NEAR ROOM TEMPERATURE APPLICATIONS ................................................... 37 CONCLUSION ............................................................................................................................................ 41. © 2019 Tous droits réservés.. lilliad.univ-lille.fr.
(16) Thèse de Thierno Moussa Bah, Université de Lille, 2019. P a g e | 16. 1.1 Wireless Sensors Networks and power supply Energy harvesting is a known concept, wind turbines and solar farms are the most common example. In this work, we focus on developing energy harvesters of much lower power scale dedicated to power supply small and autonomous sensors devices capable of monitoring their surrounding environment called wireless sensors nodes. The final goal of wireless sensor nodes development is to combine them to form a network of sensors capable of monitoring their surroundings and exchange information wirelessly between them, called wireless sensor network (WSN). The smallest dimensions and lower cost of these sensors will generalize their use: . Industrial monitoring: WSNs can be used for rare event detection or periodic data collection in industrial environment [Low and Win 2005]. For rare event detection, WSNs will detect and classify unusual events due to failure of machines, processes, security … On the other hand periodic data gathering will aim to monitor and/or control materials flows, machines, processes, manufacturing pollution … WSNs would allow engineers to gather real-time data for a better management of the manufacture. Smart cities development: The perpetual increase of cities’ population generates new kind of problems for the cities. Indeed, this increase will generate more and more challenges (e.g traffic jams, energy consumption management, …) [Chourabi et al. 2012]. WSNs use would allow a better management of those cities or megacities by: o Traffic monitoring: Management of transport systems have a direct influence on the cities’ economy. A well-managed, easily accessible public transportation is indispensable to attract workers and investors in a city. Urban WSNs can allow a better traffic congestion monitoring by deploying sensors along the road in order to gather real time traffic information and make it available to citizens. o Infrastructures monitoring and control: preserving historical patrimonies but also improved the quality of life of citizens implies to invest in roads and buildings health care monitoring and control. The use of WSNs will allow gathering continual and enormous data of these infrastructures’ integrity by deploying sensors allowing the monitoring of their stress, deformations and the impact of the pollution for example [Lynch and Loh 2006]. o Waste management: The growth of cities goes with the growth of waste. A good waste management policy is indispensable to avoid the development of unsanitary cities. In [Nuortio et al. 2006] it is recommended to use smart containers to detect the level of load and optimize the trucks’ route. o Energy consumption monitoring: WSNs can also allow a better energy consumption management by gathering information of energy consumption throughout the city. Body sensors: This is an important and fast growing market for wireless sensor networks. The best application field is in medicine where wearable or implantable sensors can be used for medical treatment. Indeed, sensors able to continuously monitor a patient vitals and alert emergencies if needed can facilitate the patient care [Stojmenović 2005]. Chronically-ill patients can also be helped by WSNs to monitor constantly the biological signs linked to the illness like hypertension, heart disease, diabetes[Martins et al. 2004; Zhang et al. 2016; Darwish and Hassanien 2011; Lee and Chung 2009]. The development of wireless sensor nodes due to the reduction in size and in power consumption of electronic devices raises the question of their power supplying. The first idea will be to use batteries. Indeed, batteries have the advantage to power supply at the desired. © 2019 Tous droits réservés.. lilliad.univ-lille.fr.
(17) Thèse de Thierno Moussa Bah, Université de Lille, 2019. P a g e | 17 voltage. However, batteries can be cumbersome to small sensors and the lifetime of batteries raises the issue of their replacement, which can be expensive if we have many sensors [Zhu and Beeby 2011]. Moreover, the function of many sensors will be to monitor environment where we already have energy sources like heat, vibrations … Making interesting the idea of developing energy harvesters to power supply the sensors from the surrounding environment than using batteries for example. Vullers et al. [Vullers et al. 2009] summed up the estimated power consumption and energy autonomy of some electronic devices. Electronic device. Power consumption. Energy autonomy. Smartphones. 1W. 5h. MP3 Player. 50 mW. 15 h. Hearing Aid. 1 mW. 10 days. Wireless sensor node. 100 µW. Infinite. Cardiac Pacemaker. 50 µW. 7 years. Quartz watch. 5 µW. 5 years. Table 1- 1: common electronic devices power consumption and autonomy [Vullers et al. 2009]. From table 1-1 we notice that a wireless sensor node requires 100µW to run, the question now is what amount of energy can we expect from the different available energy sources? In the same paper [Vullers et al. 2009], Vullers et al. answer the question by the table given hereafter. Energy sources. Available Power. Harvestable Power. 0.1 mWcm-2 100 mWcm-2. 10 µWcm-2 10 mWcm-2. 0.5m @ 1Hz, 1ms-2 @ 50 Hz 1m @ 5Hz, 10ms-2 @ 1 kHz. 4 µWcm-2 100 µWcm-2. 20 mW.cm-2 100 mWcm-2. 30 µWcm-2 (ΔT~5-10K) 1-10 mWcm-2 (ΔT>50K). 0.3 µWcm-2. 0.1 µWcm-2. Ambient Light Indoor Outdoor Vibration/motion . . Human Industrial. Thermal Energy . . Human Industrial. RF / Cell phone. Table 1- 2: Energy harvesting sources, available power and harvestable power [Vullers et al. 2009]. Choosing the right harvester, will of course depend on the output power of the harvester, but also on the available energy in the sensor’s ambient environment. In this thesis, we will not deal with all the different methods of energy harvesting but only with thermal energy harvesting. The table shows that with thermal energy harvesters, wireless sensor nodes can be power supplied.. © 2019 Tous droits réservés.. lilliad.univ-lille.fr.
(18) Thèse de Thierno Moussa Bah, Université de Lille, 2019. P a g e | 18. 1.2 Thermoelectric Energy Harvesting Thermoelectricity is a reversible physical phenomenon allowing the direct conversion of heat into electricity (Seebeck Effect) or the direct conversion of an electrical current into heat (Peltier Effect).. 1.2.1 Thermoelectric Effects Three effects characterize thermoelectricity: the Seebeck Effect, the Peltier Effect and the Thomson Effect. Each effect bears the name of the scientist who discovered it.. 1.2.1.1 The Seebeck Effect Discovered in 1822 by Thomas Seebeck, it consists on the generation of electrical field ⃗ 𝑇 through two electrically different materials, associated 𝐸⃗ in response to a thermal gradient ∇ electrically in series and thermally in parallel. The relation between these two physical parameters is: ⃗𝑇 𝐸⃗ = 𝑆 ∙ ∇. equation 1- 1. S [V.K-1] being the Seebeck coefficient or thermopower. S depends on the carriers’ nature and concentrations. It can be positive or negative depending on the nature of the majority carriers. This is the effect used to develop thermoelectric generators/harvesters.. 1.2.1.2 The Peltier Effect Discovered one decade after the Seebeck effect by Jean Charles Peltier, this effect is the opposite of the Seebeck effect. Indeed, it consists in the absorption or generation of heat 𝑞 due the propagation of an electrical current 𝑗 through two electrically different materials, associated electrically in series and thermally in parallel as previously. The relation between the heat exchanged and the current is: 𝑞 =𝜋∙𝑗. equation 1- 2. π [V] being the Peltier coefficient. This effect is used to develop coolers well known as Peltier modules.. 1.2.1.3 The Thomson Effect From the work of William Thomson (Lord Kelvin), this effect combines the two previous effects but this time, we consider just one material. Indeed, when at the same time, an ⃗ 𝑇propagate through a material, heat is electrical current 𝑗 and a thermal gradient ∇ absorbed/generated 𝑞 by the material. The exchanged heat is expressed as follows as a function of the electrical current and the thermal gradient. 𝑞 = 𝛽 ∙ 𝑗 ∙ Δ𝑇. equation 1- 3. ΔT and β [VK-1] being respectively the temperature difference between the two ends of the material and the Thomson coefficient.. 1.2.2 Thermoelectric properties Thermoelectric harvesters are made of an assembly of electrically different materials. These materials are associated electrically in series and thermally in parallel. Though Seebeck voltages can be generated using any pair of conducting materials, it took more than one century. © 2019 Tous droits réservés.. lilliad.univ-lille.fr.
(19) Thèse de Thierno Moussa Bah, Université de Lille, 2019. P a g e | 19 before Ioffe [Ioffe et al. 1959] and Goldsmid [Goldsmid et al. 1958] established heavily doped semiconductors as best thermoelectric materials enabling practical use of TE generation. Currently, thermoelectric harvesters are made of p-doped and n-doped semi-conductors associated electrically in series and thermally in parallel as shown in figure 1-1-. Figure 1- 1: Thermoelectric energy harvesting principle. The efficiency of an ideal thermoelectric harvester is given by η: 𝜂 = (1 −. 𝑇𝐶 √(1 + 𝑧𝑇𝑚 ) − 1 )∙ 𝑇𝐻 √(1 + 𝑧𝑇 ) + 𝑇𝐶 𝑚 𝑇𝐻. equation 1- 4. This maximal efficiency is the product of the Carnot efficiency 𝜂𝐶 and the efficiency linked to the thermoelectric properties of the materials used to develop the harvester 𝜂 𝑇𝐸 . 𝜂𝐶 = 1 − 𝜂 𝑇𝐸 =. 𝑇𝐶 𝑇𝐻. equation 1- 5. √(1 + 𝑧𝑇𝑚 ) − 1 𝑇 √(1 + 𝑧𝑇𝑚 ) + 𝑇𝐶 𝐻. equation 1- 6. 2. 𝑧𝑇𝑚 =. (𝑆𝑝 − 𝑆𝑛 ). (√𝜌𝑛 𝜅𝑛 + √𝜌𝑝 𝜅𝑝 ) 𝑇𝑚 =. 𝑇𝐶 + 𝑇𝐻 2. 2. × 𝑇𝑚. equation 1- 7. equation 1- 8. TC, TH, zTm being respectively the temperature of cold source (ambient air for example), the temperature of the hot source and the figure of merit of the thermocouple (p and n doped material association) at the average temperature Tm. The hot and cold source temperature being constant, the leverage to improve the efficiency of the thermoelectric harvester is the maximizing of the figure of merit ZT m according to equation 1-4. Maximizing the figure of merit consists in choosing or developing materials with high Seebeck coefficient, high electrical conductivity and low thermal conductivity. This is contradictory because in nature a good electrical conductor is also a good thermal conductor.. © 2019 Tous droits réservés.. lilliad.univ-lille.fr.
(20) Thèse de Thierno Moussa Bah, Université de Lille, 2019. P a g e | 20. 1.2.2.1 Thermal conductivity Heat diffuses according to three phenomena, Heat conduction (in solids), convection (in fluids, gas) and thermal radiation (in vacuum and in air). The thermoelectric harvester being made of crystalline materials, the heat will diffuse through thermal conduction according to the Fourier law: ⃗𝑇 𝑞 = −𝜅 ∙ ∇. equation 1- 9. In metals, the heat diffuses through the electrons’ propagations. The thermal conductivity is given by the Wiedemann-Franz law, which relates the electron thermal conductivity to the material electrical conductivity (equation 1-10). The electronic contribution is related to electrical conductivity through the Lorenz’ number L. 𝜅𝑒 = 𝜎 ∙ 𝐿 ∙ 𝑇. equation 1- 10. On the other hand, in insulating materials, the heat diffuses through the lattice vibrations (phonons). The Debye’s relation as presented by equation 1-11 formulates the lattice thermal conductivity in first approximation, the phononic contribution depends on the volumetric specific heat C of the material, the phonons’ mean free path Λ and group velocity v. 𝜅𝑝ℎ =. 𝐶∙Λ∙𝑣 3. equation 1- 11. In thermoelectric materials, mostly semiconductors the heat diffuses through both mechanisms. The thermal conductivity is given by equation 8. 𝜅 = 𝜅𝑒 + 𝜅𝑝ℎ. equation 1- 12. 1.2.2.2 Seebeck Coefficient The Seebeck coefficient represents the ability of the material to convert any thermal gradient into an electric field (see section II.1-a). The Seebeck coefficient is defined as follows: 𝑆=. Δ𝑉 | Δ𝑇 Δ𝑇→0. equation 1- 13. From equation1-13, it is difficult to extract a general formula for the Seebeck coefficient calculation. However, Cutler et al in [Cutler and Mott 1969] defined a general formula known as Mott formula, allowing in metals or degenerate semiconductors the calculation of the Seebeck coefficient. This formula is based on the coupling of the Seebeck coefficient with the electrical conductivity. 𝑆=. 𝜋 2 ∙ 𝑘𝐵2 𝑑(ln[𝜎(𝐸)] ∙𝑇∙ |𝐸=𝐸𝐹 3𝑞 𝑑𝐸. equation 1- 14. kB, q and EF being respectively the Boltzmann constant, the electronic charge and the Fermi energy. In [Fritzsche 1971] Fritzsche developed a general expression for semiconductors Seebeck coefficient by : 𝑆𝑛 =. © 2019 Tous droits réservés.. 𝑘𝐵 𝐸𝑐 − 𝐸𝐹 ∙( + 𝐴𝑛 ) 𝑞 𝑘𝐵 𝑇. equation 1- 15. lilliad.univ-lille.fr.
(21) Thèse de Thierno Moussa Bah, Université de Lille, 2019. P a g e | 21 𝑘𝐵 𝐸𝑣 − 𝐸𝐹 ∙( + 𝐴𝑝 ) 𝑞 𝑘𝐵 𝑇. 𝑆𝑝 =. Ec, Ev, An and Ap being the conduction band energy, the valence band energy and constants depending on the materials. By introducing the carriers’ concentration, the Seebeck coefficients are then: 𝑘𝐵 𝑁𝐶 ∙ (ln( ) + 𝐴𝑛 ) 𝑞 𝑛 𝑘𝐵 𝑁𝑣 𝑆𝑝 = − ∙ (ln( ) + 𝐴𝑝 ) 𝑞 𝑝 𝑆𝑛 =. equation 1- 16. NV and NC denote the effective density of states in valence and conduction bands, respectively. p and n denotes the holes and the electrons concentrations.. 1.2.2.3 Electrical conductivity The electrical conductivity is the ability of a material to conduct electricity. This conduction is made through electrons, holes, or both according to the nature of the materials. This electrical conductivity results from the material’s electronic lattice and its fermi level. The electrical conductivity [𝑆𝑚−1 ] is defined as the product of the carriers’ concentrations (p or n), their mobility µ and the electronic charge q. 𝜎𝑛 = 𝜇𝑛 ∙ 𝑛 ∙ |𝑞| 𝜎𝑝 = 𝜇𝑝 ∙ 𝑝 ∙ |𝑞|. equation 1- 17. Generally, the materials contain electrons and holes, the electrical conductivity is then the sum of the holes and electrons contributions. Moreover, the electrical conductivity is temperature-dependent. Indeed in metals, the temperature increase favorites the electrons’ diffusion and the lattice vibration resulting in the mobilities reduction and in semiconductors, the temperature increase favorites an increase of the carries’ concentration. In the semiconductors, the carriers’ concentration increases exponentially with the band gap energy Eg and the temperature T: exp (-Eg/kBT).. 1.2.3 Materials choice The materials’ choice is critical to realize efficient thermoelectric harvesters. Indeed, as presented in the section II-2, the thermoelectric generator efficiency is function of the Carnot efficiency and mainly of the thermopiles’ figure of merit, which is function of the materials’ thermoelectric properties (equation 1-7).For a single thermoelectric material, the figure of merit becomes: 𝑧𝑇 =. 𝜎 ∙ 𝑆2 ×𝑇 𝜅. equation 1- 18. Best materials will then be materials with the highest electrical conductivity and Seebeck coefficient and the lowest thermal conductivity. Insulators can be the good choice to satisfy criteria of high Seebeck Coefficient and low thermal conductivity, but not the criteria of high electrical conductivity. On the other hand, metals satisfy the criteria of high electrical conductivity but feature a high thermal conductivity. Therefore, the only choice left is the use of semi-conductors and these semiconductors must be highly doped according to Ioffe’s works [Ioffe et al. 1959]. The optimum doping level to maximize the material’s figure of merit is about( 1019 𝑐𝑚−3 (figure 1-2) [Gardner 1994]. Indeed, the Seebeck coefficient decreases. © 2019 Tous droits réservés.. lilliad.univ-lille.fr.
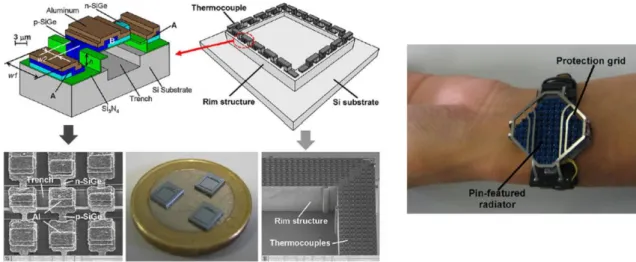
(22) Thèse de Thierno Moussa Bah, Université de Lille, 2019. P a g e | 22 quickly with the carriers’ concentration increase (Seebeck coefficient proportional to the logarithm of the carriers’ concentration (cf. equation 1-16)).. Figure 1- 2: Optimum doping level for thermoelectric applications [Gardner 1994]. In addition to a doping level around 1019 𝑐𝑚−3 , a good thermoelectric material must have a band gap close to 10 ∙ 𝑘𝐵 𝑇 at the working temperature T [Mahan 1989]. Indeed, small band gaps favorite carriers’ mobility, but too small will favorite negative contribution from the minority carriers on the Seebeck coefficient. According to Tritt [Tritt 2000] good thermoelectric materials must also be multi-valley semiconductors with high crystal structures symmetry to produce equivalent bands in order to avoid the reduction of carriers’ mobility by the increase of effective mass. The materials must be composed of elements with low electronegativity differences in order to minimize the carrier scattering by optical phonons, then the reduction of the carrier mobility [Slack 1995]. In addition to good electronic properties, the material’s thermal conductivity is also an important parameter for thermoelectric application. In semiconductors, the thermal conductivity features two contributions (see section I.2.a) dominated by the phononic contribution while the electronic plays negligible role [Jin 2014] (cf. figure 1-2). The idea now is to use or develop materials with the lowest phononic contribution to the thermal conductivity. This is achievable by using materials with high phononic scattering frequency (small mean free path) and/or materials presenting low phononic group velocity by using for example materials made of heavy elements, many atoms per unit cell … Following these guidelines, the majority of state-of-the-art materials are alloys with high carrier concentration [Ioffe et al. 1959]. High carrier concentration enable an improvement of the electrical conductivity while disrupting the phononic heat transport, resulting in a thermal conductivity reduction. These materials are alloys of bulk Bi, Te, Sb and Pb for room and moderate temperature applications and alloys of Si and Ge for high temperature applications as presented in figure 1-3 [Minnich et al. 2009].. © 2019 Tous droits réservés.. lilliad.univ-lille.fr.
(23) Thèse de Thierno Moussa Bah, Université de Lille, 2019. P a g e | 23. Figure 1- 3: Best thermoelectric materials [Minnich et al. 2009]. Figure 1-3 presents the state of the art (mainly from laboratories) of mostly used materials for thermoelectric harvesting and cooling. The dashes lines represent bulk materials and the solid lines, nanostructured materials. From this figure, we can see clearly that nanostructuring materials improves considerably the thermoelectric efficiency. Indeed, by nanostructuring the materials, the constraints on phonon displacements are accentuate, resulting in a supplementary thermal conduction reduction. In addition to these materials, researches carried out allow the emergence of new promising materials. The panel of thermoelectric materials is wide and keep expanding from organic materials, semiconductors to semimetals, ceramics … They can be monocrystalline, polycrystalline, 3D materials, 2D materials, etc… Hereafter are presented some of these materials. . . . . © 2019 Tous droits réservés.. Skutterudites: Skutterudites materials are based on the fact that the unit cell contains empty spaces, which, can be filled by loosely bound atoms known as rattlers [H. Julian Goldsmid 2010]. These rattlers’ oscillations induce the thermal conductivity reduction. The general formula of these materials are MX3 where M is Co, Rh or Ir and X is P, As or Sb. However, they can be encountered as V2M8X24 where V is the loosely bound atom that can act as dopant. They exhibits a figure of merit close to unity for 500-700K temperature range [Uher 2001]. Half-Heusler: Heusler alloys are ferromagnetic materials. The best-known Heusler material is Cu2MnAl, it has a structure in which Cu forms a primitive cubic cell with alternative cells of Mn and Al. The half Heusler structure is the same except that half of the Cu sites are empty. They are stable at high temperature and exhibit good thermoelectric performances after doping. Ti0.5Zr0.25Hf0.25NiSn exhibits a figure of merit of 1-5 at 700K according to Muta et al. [Muta et al. 2006]. Clathrates: Intermetallic compounds, they are composed of Si, Ge or Sn with guest atoms in different sites of the crystallographic structure. They are good thermoelectric materials for high temperature applications. For example Ba8Ga16Ge30 presents a figure of merit of 1-3 at 1000K [Hou et al. 2009]. Oxides: Oxide materials are interesting for high temperatures applications [Fergus 2012]. Indeed, they are chemically inert and potentiality stable. The most promising materials are cobalt oxide based materials used as p type materials and presenting figure of merit close to unity at temperatures around 870 K [Funahashi et al. 2000].. lilliad.univ-lille.fr.
(24) Thèse de Thierno Moussa Bah, Université de Lille, 2019. P a g e | 24 . . Organic materials: Owing to low thermal conductivities (0.1-1 Wm-1 K-1) and to the advantages to be printable, flexible and moldable, polymers [Petsagkourakis et al. 2018] are investigated for thermoelectric applications. Indeed, the amorphous morphology and their non-covalent bindings increase the phonons’ diffusion and then the material thermal conductivity reduction. However, those same advantages are also drawbacks, since the amorphous structure contributes to reduce their electrical conductivity, limiting the developed generators’ performances to few nWcm-2. Nevertheless, organometallic polymers use can allow achieving few µWcm-2 under tenth of kelvins as temperature difference across the generator [Sun 2012] Nanostructured materials: Nanostructured materials for thermoelectric harvesting have been investigated first by Hicks and Dresselhaus [Hicks and Dresselhaus 1993b; Hicks and Dresselhaus 1993a]. They predicted by their simulations, a significant increase of the figure of merit for bismuth telluride nanowires with respect to the figure of merit of bismuth telluride. Low dimensional materials are used for two purposes. First, to increase the electron quantum-confinement to increase the Seebeck coefficient and second, to use the numerous interfaces (material’s borders and/or impurities) to scatter preferentially and strongly the phonons, resulting into a thermal conductivity reduction [Dresselhaus et al. 2007]. Dimensionality reduction is the best example of material thermoelectric improvement by nanostructuration. Indeed, Mahan and Sofo demonstrated in [Mahan and Sofo 1996] that narrowest and sharpest will be the energy carriers distribution of a material, better will be the material for thermoelectric applications (cf. figure 1-4). It is important to note, that in this case, purely originates from electronic confinement without taking care of possible phononic impact due to the nano-structure itself.. Figure 1- 4: Density of states versus energy for: Bulk material (a), 2D material (b), 1D material (c) and 0D material (d). [R. Szczech et al. 2011]. The development of low dimensionalities materials can be a key to improve the thermoelectric properties of non-conventional materials like silicon and/or silicon germanium for near room temperature applications. 2D material can be thin films or superlattices, 1D can be nanowires development and 1D quantum dots use. In the next section, we focus on the main problematic of this thesis: the use of silicon for thermoelectric harvesters’ development.. 1.3 Silicon for thermoelectric harvesting Figure 1-3 tells us that for thermoelectric harvesting, we can use everything except silicon. However, silicon based thermoelectric harvesters development is a topic of high interest in the thermoelectric community. Indeed, Silicon has the advantages to be the most abundant semi-conductor material, to benefit from existing facilities and technological processes for low cost and mass production. Moreover, silicon is less environmentally harmful than most materials used currently. All these advantages make silicon a material of great interest in the thermoelectricity community. However, silicon is not used for thermoelectric harvesting because of its poor thermoelectric properties regarding other materials like Bi2Te3. Indeed, the. © 2019 Tous droits réservés.. lilliad.univ-lille.fr.
(25) Thèse de Thierno Moussa Bah, Université de Lille, 2019. P a g e | 25 figure of merit of bulk silicon is at best 0.01at 300K where Bi2Te3 exhibits hundred times higher value at same temperature. This gap is mainly explained by their thermal conductivities. At room temperature, for bulk materials, the thermal conductivities of Bi2Te3 (~1-5 𝑊𝑚−1 𝐾 −1 ) [Goldsmid et al. 1958] and that of Si (~150 𝑊𝑚−1 𝐾 −1 ) [Asheghi et al. 1998] are separated by two orders of magnitude. Thermal conductivity reduction is therefore the principal issue to upgrade silicon as an efficient thermoelectric material. In this chapter, we will discuss the silicon enhancement to an efficient thermoelectric material with respect to bulk silicon, it integration into a thermoelectric harvester and finally present the best state of the art room temperature thermoelectric harvesters.. 1.3.1 Silicon enhancement to an efficient thermoelectric material Silicon thermoelectric properties improvement focuses on developing nanostructured silicon, aiming to reduce the thermal conductivity with minor impact on the electrical conductivity. This is possible thanks to the recent progress in nanotechnology and the decoupling between the electronic and phononic contributions to the thermal conductivity. Indeed, The huge difference between the phonons mean free path (~200 − 300 𝑛𝑚)[Marconnet et al. 2013] and the electrons mean free path (𝑓𝑒𝑤 𝑛𝑎𝑛𝑜𝑚𝑒𝑡𝑒𝑟𝑠)[Weber and Gmelin 1991] for bulk silicon and at room temperature, allows the alteration of the phonons transport with minor impact on the electronic carriers. Nanotechnology then permit the realization of materials with dimensionalities lower than the phonons mean free path and/or the inclusion of impurities into the material. In such materials phonons collisions with the material borders and the impurities are favored (cf. figure 1-5).. Figure 1- 5: Silicon thermal conductivity reduction methodology. Figure 1-5 shows the mechanism of the phonons scattering in the bulk silicon vs. in the nanostructured silicon. The nanostructuration increases the frequency of the phonons scattering leading by definition to the reduction of the phonons mean free path and then to the phononic contribution to the thermal conductivity, the dominant contribution [Dechaumphai and Chen 2012]. Hereafter, are given the most common nanostructured silicon based materials for thermoelectric harvesting.. 1.3.1.1 Nanowires Nanowires for thermoelectric applications have been investigated theoretically by Hicks and Dresselhaus [Hicks and Dresselhaus 1993]. They investigated the effect of 1D nanostructuration along the different axes on the different thermoelectric properties of bismuth telluride.. © 2019 Tous droits réservés.. lilliad.univ-lille.fr.
(26) Thèse de Thierno Moussa Bah, Université de Lille, 2019. P a g e | 26. Figure 1- 6: Effect of bismuth telluride nanowires’ diameter to the thermoelectric performances [30]. The results show a significant improvement of the figure of merit with the reduction of the wire diameter. The simulations predicted a figure of merit up to 15 for a bismuth telluride nanowire of 0.5nm as diameter. Concerning silicon nanowires, the principle is the same, by developing silicon nanowires with the smallest possible diameter, the phonons borders scattering and the quantum confinement phenomenon increases, reducing then the thermal conductivity. The decisive experimental proof of thermoelectric properties improvements by silicon nanowires has been presented by Boukai et al. and Hochbaum et al entitled respectively “Silicon nanowires as efficient thermoelectric materials” [Boukai et al. 2008] and “Enhanced thermoelectric performance of rough silicon nanowires” [Hochbaum et al. 2008] both published in 2008 by nature. By theoretical and experimental investigation, Boukai et al demonstrate the impact of silicon dimensionality (silicon nanowires) reduction and impurity addition (doping) on the thermal conductivity and the thermoelectric performances. They reported a thermal conductivity reduction up to a factor of 200 (10nm as diameter and 200K) and a figure of merit of one at 200K for a nanowire of 20nm as diameter and doped at 1 × 10¹⁹ 𝑐𝑚−3 (cf. figure 1-7).. Figure 1- 7: Silicon thermal conductivity reduction (a) and thermoelectric properties enhancement (b) from Boukai et al. work [Boukai et al. 2008]. Hochbaum et al took an interest in the evolution of the different thermoelectric properties from a bulk material to a nanowire. In figure 1-8, is represented the evolution of the thermal conductivity from bulk to 50nm diameter nanowire (Figure 1-8-a) and the power factor and figure of merit values with respect to the temperature for a 52nm (Figure 1-8-b) diameter nanowire. The results depict that the power factor is not significantly affected by the. © 2019 Tous droits réservés.. lilliad.univ-lille.fr.
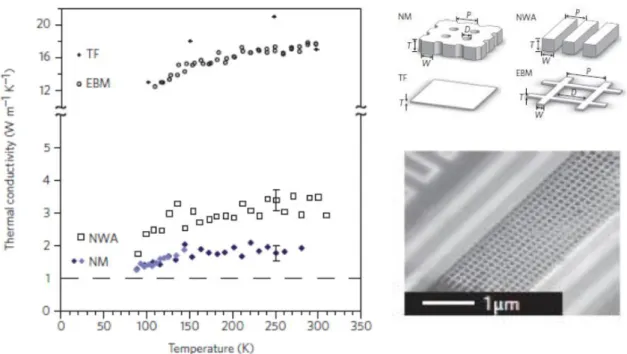
(27) Thèse de Thierno Moussa Bah, Université de Lille, 2019. P a g e | 27 nanostructuration, while the thermal conductivity is a two order of magnitude lower at 300K (Figure 1-8-a). Finally, it shows that it is possible to achieve a zT of 0.6 at 300K for a silicon nanowire of 52nm diameter (Figure 1-8-b). This result demonstrates that the dimensionality reduction has a bigger impact on the phonon conduction rather than the electronic density of states.. Figure 1- 8: Thermal conductivity reduction by developing a 50nm diameter silicon nanowire, open squares (highly doped silicon), black squares (intrinsic silicon) and the power factor variation (a). Power factor variation and figure of merit of a 52nm diameter silicon nanowire (b).. As a complement to Boukai et Hochbaum works, Lim et al investigated in [Lim et al. 2012] the effect of silicon nanowires surface roughness on the thermal conductivity. The results show a thermal conductivity reduction down to 5 𝑊𝑚−1 𝐾 −1 The work shows also that the roughness has more impact on thermal conductivity reduction than the wire diameter.. 1.3.1.2 Phononic engineering In 1952, Sondheimer investigated the effect of the thickness reduction on the silicon electrical conductivity [Sondheimer 1952] in thin planar films. The Casimir-Ziman model is the equivalent for phononic transport. Equation 1-19 gives the thin membrane thermal conductivity with respect to bulk: 𝜅𝑚𝑒𝑚𝑏𝑟𝑎𝑛𝑒. 𝑡 3(1 − 𝑝 ) ∞ 1 1 1 − exp(− Λ 𝜉) = 𝜅𝑏𝑢𝑙𝑘 (1 − ) ∫ ( 3 − 5) 𝑑𝜉 2𝛿 𝜉 1 − 𝑝𝑒𝑥𝑝(− 𝑡 𝜉) 1 𝜉 Λ. equation 1- 19. where t is the thickness, Λ the phonon mean free path at 300K and p the fraction of phonons specularly reflected at the boundaries. The model developed by Sondheimer for Λ=300nm at 300K and p assumed to be 0 is validated by experimental measurements for several silicon thickness (cf. figure 1-9). Silicon thinning allows for a significant reduction of the thermal conductivity down to ~25 𝑊𝑚−1 𝐾 −1 for a 20nm thick silicon membrane [Liu and Asheghi 2004] ~9 𝑊𝑚−1 𝐾 −1 for a 9nm thick silicon membranes [Chávez-Ángel et al. 2014] . This incredible reduction offered by a thickness reduction down to tenths of nanometers, opens the way to the integration of thin silicon film to industrial converters compatible with the CMOS technology.. © 2019 Tous droits réservés.. lilliad.univ-lille.fr.
(28) Thèse de Thierno Moussa Bah, Université de Lille, 2019. P a g e | 28. Figure 1- 9: Silicon thermal conductivity versus thickness. The Fuchs-Sondheimer model (line) is used to fit values reported in the literature (circles) [Haras et al. 2016].. The silicon thinning allows a significant reduction of the thermal conductivity but it remains much higher than the bismuth telluride thermal conductivity or amorphous silicon. The amorphous value constitutes a commonly admitted lower limit to the thermal conductivity of any material [Cahill et al. 1992].The key to downscale further the thermal conductivity is to couple the thinning with a phononic engineering solution. This solution consists on patterning the thin film with regular and periodic features. The idea here is to play on the phonons’ frequency and wavelength to reduce their contribution to the thermal conductivity [Maldovan 2013]. Indeed, phonons, quantum of lattice vibrations carry sound for frequencies from few Hz to hundreds of GHz and heat for frequencies over hundredth of GHz to hundredth of THz (cf. figure 1-10).. Figure 1- 10: Phononic spectrum [Maldovan 2013]. The heat being carried at high frequency and on short distances, it can be controlled by nanostructuring the thin silicon film (figure 1-11). The network of periodic holes presented in figure 1-11 allows by the nanoscale dimensions of the holes and the pitch between the holes to act like diffuser for THz phonons and then to reduce the thermal conductivity. Such network is called “Phononic Crystal”. At room temperature, the phonon coherence length is very short (few nm) such that the transport regime is purely diffusive and the detailed geometry (periodic or not) of the hole pattern has no impact on the thermal conductivity reduction. In that extent, the term “Phononic Crystal” should not be understood here as a media which phonon transmission is coherently impacted by a periodic structure but rather a material maximizing. © 2019 Tous droits réservés.. lilliad.univ-lille.fr.
(29) Thèse de Thierno Moussa Bah, Université de Lille, 2019. P a g e | 29 the diffusion of phonons in order to reduce thermal transport. Engineering” replaces then the term “Phononic Crystal”.. “Phononic or Phonon. Figure 1- 11: Periodic holes network (“Phononic Engineering”) for heat transport management [Maldovan 2013]. Phononic engineering is not just a concept. It has been studied both by theoretical and experimental means. Reference works being, those carried out by Tang et al. [Tang et al. 2010], Yu et al. [Yu et al. 2010], Hopkins et al [Hopkins et al. 2011] and Dechaumphai and Chen. [Dechaumphai and Chen 2012]. In [Tang et al. 2010], Tang et al investigated the thermal efficiency of a 100nm thick silicon membrane patterned with several phononic engineering pattern as presented in figure 1-12.. Figure 1- 12: Holey silicon geometry and the measured thermal conductivity at 300K [Tang et al. 2010], * denotes doped samples (Boron 5 ∙ 1019 𝑐𝑚 −3). All the samples presented in Figure 1-12 have the same thickness. Beyond, the benefit of phononic engineering for thermal conductivity reduction, these results show that the pitch and the neck size between holes are key parameters to further reduce the thermal conductivity and thus potentially improve the thermoelectric figure-of-merit. In addition, the doping has an impact on the thermal conductivity. Indeed, by doping we add impurities into the material, which will increase the probability of phononic scattering and reduce the thermal conductivity. Finally, from this work, we can report a thermal conductivity reduction down to 1.73 𝑡𝑜 2.03 𝑊𝑚−1 𝐾 −1 , almost close to bismuth telluride thermal conductivity (1.5 𝑊𝑚−1 𝐾 −1 ) and to the amorphous value of silicon −1 −1 (~1.8 𝑊𝑚 𝐾 [Wada and Kamijoh 1996]). The figure of merits of the doped samples are. © 2019 Tous droits réservés.. lilliad.univ-lille.fr.
Figure
![Figure 1- 6: Effect of bismuth telluride nanowires’ diameter to the thermoelectric performances [30]](https://thumb-eu.123doks.com/thumbv2/123doknet/3567622.104551/26.892.257.645.129.399/figure-effect-bismuth-telluride-nanowires-diameter-thermoelectric-performances.webp)


+7


Documents relatifs
By treating the Grfineisen constant as a temperature dependent semiadjustable parameter we find that the high temperature lattice thermal conductivity of Ge and Si can be
Finally there are the diameter-modulated cc/as nanowires, where three distinctive configurations are considered (labeled DMCS, Fig. 2 ): (i) the C1 configuration, in which the
On constate l’hétérogénéité de déformation de l’éprouvette sur la figure 1(b) avec des contractions latérales plus faibles pour les zones les plus fortement réticulées..
For the enriched sample, the specific value of the thermal conductivity at the peak is different, however the thermal conductivity obtained from theory between 3 K and 10 K and
We show that mini- mizing a weighted combination of energy per bit and average delay per bit is equivalent to a convex optimization problem which can be solved exactly using
Although no clear evidence of coherent reduction of the thermal conductivity could be shown in the fishbone PnCs, the effect of surface scattering is, in that
Our molecular dynamics simulations show that the nanocapacitor stores monochromatic terahertz lattice waves, which can be used for phonon lasing - the emission of coherent
