HAL Id: hal-00544659
https://hal.archives-ouvertes.fr/hal-00544659
Submitted on 8 Dec 2010
HAL is a multi-disciplinary open access
archive for the deposit and dissemination of
sci-entific research documents, whether they are
pub-lished or not. The documents may come from
teaching and research institutions in France or
abroad, or from public or private research centers.
L’archive ouverte pluridisciplinaire HAL, est
destinée au dépôt et à la diffusion de documents
scientifiques de niveau recherche, publiés ou non,
émanant des établissements d’enseignement et de
recherche français ou étrangers, des laboratoires
publics ou privés.
DESIGNS FOR HIGH ACCURACY LASER
RANGING OF KILOMETER SCALE DISTANCES IN
SPACE
Clément Courde, Ha Phung, Alain Brillet, Michel Lintz
To cite this version:
Clément Courde, Ha Phung, Alain Brillet, Michel Lintz. IMPLEMENTATION OF TWO
TELEME-TER DESIGNS FOR HIGH ACCURACY LASER RANGING OF KILOMETELEME-TER SCALE
DIS-TANCES IN SPACE. ICSO 2010, International Conference on Space Optics, Oct 2010, Rhodes,
Greece. �hal-00544659�
IMPLEMENTATION OF TWO TELEMETER DESIGNS FOR HIGH ACCURACY
LASER RANGING OF KILOMETER SCALE DISTANCES IN SPACE
C. Courde1, D. H. Phung1, A. Brillet1 and M. Lintz1.
1ARTEMIS, Université de Nice Sophia-Antipolis, CNRS, Observatoire de la Côte d'Azur
Boulevard de l'Observatoire, 06304 Nice cedex, France michel.lintz @ oca.eu
ABSTRACT
We present two different laser ranging systems under development, both based on the use of a high frequency modulated beam. The first range meter makes no use of interferometry: only the phase of the return beam is detected, in a way that rejects cyclic errors due to optical and electronic crosstalk. An Allan deviation slightly better than 10nm has been obtained with this simple system. The other range meter should provide better resolution, at the expense of a somewhat more sophisticated procedure, as it involves both time-of-flight and interferometry measurements.
I. INTRODUCTION
High accuracy long distance ranging is essential, for instance, for the alignment of high energy particle accelerators and colliders [1], and more generally for large scale installations [2]. Electronic distance measurement is often a challenge in formation flight space missions that require, at some level depending of the mission goal, knowledge of the absolute distances during all the formation flight.
Beyond the basic time-of-flight measurement, unable to reach micron-scale resolution for a measurement of 1s duration, many different measurement schemes have been considered. Measuring the phase of an amplitude modulation at high frequency can provide high resolution. However, not only phase measurements can be biased by signal cross-talk, but also they are obtained modulo
2
π
. Increasing the modulation frequencyF
, and hence, decreasing "synthetic wavelength"Λ
=
c
/
F
, improves the measurement resolution, but also results in a smaller non-ambiguity range, the range beyond which the distance measurement cannot be obtained without some additional information. Multi-wavelength interferometry has been able to provide both long synthetic wavelength and sub-wavelength accuracy [3]. Using multiple 40GHz phase modulations of a CW laser, MSTAR [4] has reached nm-scale accuracy. More recently Coddington et al. [5] have demonstrated a laser ranging scheme that efficiently combines time-of-flight and interference measurements in a single measurement inspired from optical linear sampling [6]. Spurious reflexions, that would affect the measurements made following [3, 4], are under control in [5], as the corresponding signals occur in a specific time window, and can be rejected, at least when they do not coincide with the ranging signal to be exploited.These advances, however, are obtained at the expense of sophisticated set-ups that might require significant engineering to be space-qualified.
In [7] we presented a measurement scheme that allows a distance to be obtained from the phase of a high frequency (HF) amplitude modulation, with no bias from signal cross-talk of phase drifts in the electronic or optical channels. A measurement was presented, with an Allan deviation slightly below 1 micron. The measurement procedure has been modified to prevent optical interference in the optics. As will be shown in sect II, the Allan deviation now shows a minimum slightly below 10nm, yet with a set-up that remains very simple, and with no additional information needed.
It can be shown [7] that, due to fundamental limits, a measurement in which the scale is given by a
≈
10 mm synthetic wavelength is inadequate for distance measurements with a resolution well below the nm level: only optical interferometry can provide very high resolution. This is why we have considered another measurement scheme, in which a two-mode laser beam is split in two, propagates along a reference and a measurement path, and is recombined to produce an interference. The detected signal will have "mixed" features, with both- (two-mode) HF intensity modulation, with a scale given by the synthetic wavelength, - and (single-mode) optical interference, with a scale given by the optical wavelength. Preliminary analysis of the method and the signal is given in sect. III.
II. TWO-MODE AMPLITUDE MODULATION A. Principles of the measurement
Phase measurements can be done with high resolution, but the accuracy of the phase measurements is limited by systematic errors due to
-i) offsets and drifts in the electronics
-ii)cyclic errors due to cross-talk or spurious signals at the same frequency as the processed signals. In [8], contribution -i) was kept below 5µ m by measuring a reference target every minute. If perfectly constant, contribution -ii) can be removed [9] by numerical processing. Otherwise, it will remain as a systematic error. As shown in [7], shifts and drifts, altogether with cyclic errors, can be removed by use of
- a polarisation switch that allows the roles of the measurement and reference paths to be exchanged with respect to the two photodiodes (see Fig. 1) at a kHz rate,
- and a lock-in amplifier (LIA) to monitor the phasemeter output signal.
If the LIA output is locked to zero through a feedback to the VCO, then the reference and measurement modulations are in phase when they recombine at the PBS cube, and in that case, not only contributions -i) are totally eliminated, but also cyclic errors (contribution -ii)), provided that the signal amplitude is not affected in the measurement/reference switching. Then the path length difference
∆
L
is recovered through)
(
/
)
(
)
(
t
K
t
Kc
F
t
L
=
Λ
=
∆
. (1)The frequency
F
(t
)
can be measured with high accuracy, andK
is an integer, that can be determined at the start of the measurements byK
=
F
1/(
F
2−
F
1)
where the frequenciesF
1 andF
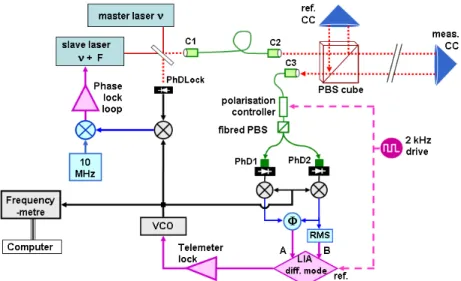
2 correspond to two successive zeroes of the LIA output [10].Fig. 1. Two-mode amplitude modulation: experimental set-up. C1, C2, C3: fibred collimators. CC: hollow
corner cube. PBS: polarising beam splitter. PhD: high frequency photodiodes. Φ: XOR phase-meter. RMS: RMS-to-dc converter, to remove the contribution due to amplitude-to-phase coupling in the phase-meter [10].
Red: laser beams. Black, HF signals. Blue, intermediate frequency signals. Purple: low frequency signals. B. Implementation
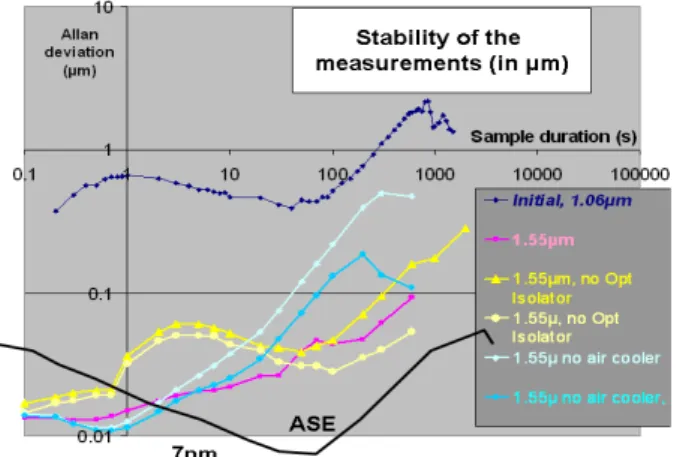
In [10] the high-frequency modulated beam was obtained by phase-locking two single-mode lasers as shown in Fig. 1. The polarization switch was obtained by a polarization controller followed by a fibred polarising beam splitter. The Allan deviation of the length measurements is plotted in dark blue in Fig. 2 and shows a bump for frequencies of 1 or a few Hz. In [10], interference effects, between the photodiode (return loss 15dB) and the fibred collimator, were considered as a possible origin for this noise. This has been confirmed using low return loss (typ. 35dB) photodiodes: the noise is roughly 10 times lower (yellow curves in Fig. 2), as expected if the noise is due to an interference. The fact that a further reduction is obtained by inserting optical isolators (light blue and purple curves in Fig. 2) also confirms this interpretation.
Fig. 2. 13.6 GHz amplitude modulation: stability of the distance measurements, obtained using
photodiodes with 15 dB return loss (dark blue points) or with 35 dB return loss (all other data). Yellow points: without optical isolators. Blue and purple points: with optical isolator. The amplitude modulation was obtained by phase locking two single-mode lasers, except for the black line, obtained with a broadband, ASE (amplified
spontaneous emission) source and a fibred, integrated amplitude modulator. C. Optical cross-talk and interference
Among other sources of systematic effects [10], optical cross-talk has to be considered. At first sight the finite extinction ratio of the PBS cube, used to separate between the measurement and reference paths, would seem to be a serious problem. In our measurement, however, the phase of the measured signals is not affected. Let us consider, for instance, that the PBS cube reflects, not only the S polarisation, but also a small fraction (typ.
≈
2 p
r
1% in optical power) of the P polarisation. Then the expected signal to be measured in the P (measurement path) channel,I
P(t
)
=
(I
/
2
)
×
cos
[
δ
(
t
−
L
/
c
)
]
in the case of a ideal PBS cube, is replaced by[
]
[
]
[
] [
]
+
−
−
−
+
−
+
−
−
×
=
)
2
/
)
(
(
cos
/
)
(
cos
)
1
(
2
)
/
(
cos
)
/
(
cos
)
1
(
)
2
/
(
)
(
'
2 2 4 2 2c
l
L
t
c
l
L
r
r
c
l
t
r
c
L
t
r
I
t
I
av p p p p Pδ
ω
δ
δ
, (2)where
δ
=
2
π
F
is the pulsation of the HF modulation, andω
av=
2
π
(
ν
MasterLaser+
F
/
2
)
is the average optical pulsation. The third term (the second in size) results from the interference term between the two paths. In range meters that measure the phase of the modulated beam, the third term is a significant source of systematic error, since it contributes to the signal with a phaseδ
(
L
+
l
)
/
2
c
≠δ
L
/
c
. In our measurement, these contributions are present. But since we operate at a frequency such thatδ
(
L
−
l
)
/
c
is locked to zero (mod.2
π
), the phases,δ
(
L
+
l
)
/
2
c
for the third term (orδ
l
/
c
for the second) are identical toδ
L
/
c
(mod.π
). Hence the phases of the optical beat-note remains unaffected by this, otherwise large, systematic effect.Fig. 3. Scan of the frequency of the master laser (the scan, done manually, is not strictly regular)
in the situation where the PBS cube in Fig. 1 is set at normal incidence and gives rise to interference effects. Green: open-loop telemeter signal. Blue: amplitude of one of the two photodiodes, demodulated with the same
signature as the telemeter signal. The absence of correlation between the two signals shows that the contribution that affects the telemeter signals is not due to amplitude-to-phase coupling. The open loop
For any other interference the same conclusion does not hold, since the lengths involved do not share the same relation. For instance, reflexion at the entrance and exit sides of the PBS cube are expected to give rise to systematics. This can be checked by scanning the frequency of the master laser, and recording the open loop output of the LIA, all other parameters being kept constant. As shown in Fig. 3, the telemeter signal wobbles around its average value, in regular pattern. Two obvious free spectral ranges can be observed,
- 4 GHz, which corresponds to interference inside the 25mm PBS cube
- 300 MHz, which also involves two reflexions at the PBS cube on the way through the corner cube. These two contributions are absent when the PBS cube is replaced by a thick, 45° plate polariser [11] to prevent interference effects. In that case the open loop signal is smaller than 1µ m peak-to-peak.
Thus, reducing interference effects is critical for reaching high accuracy. The fact that, in the scheme presented above the HF amplitude modulation is obtained through the beat-note of two single-mode lasers is very useful in tracking the origin of systematic effects. But once they are minimised by choosing optics that minimise reflexion at normal incidence, then the importance of systematic effects can be further reduced by using a source with a coherence length shorter than the cavity involved in the interference.
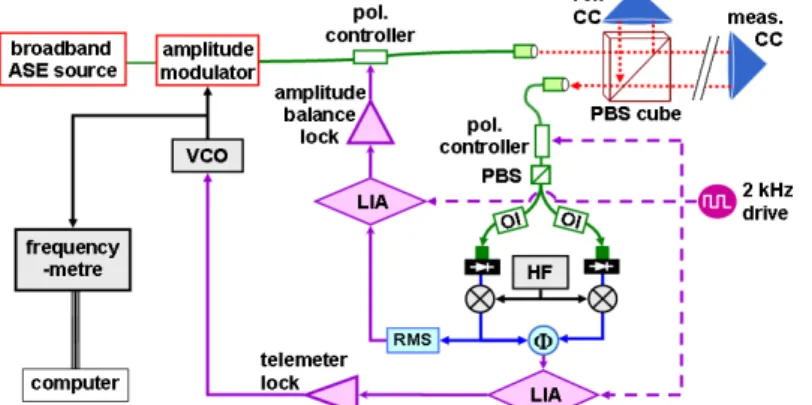
Fig. 4 shows a typical set-up for a telemeter that would exploit modulation of a broadband source. A stability of about 7nm at 1 minute duration has been obtained with such a set-up (black curve in Fig. 2), using a ≈5nm bandwidth, ASE (amplified spontaneous emission) source. The fact that stability is somewhat worse for shorter and longer time scales seems to be due to technical noise in the ASE source, and to drifts in the polarisation controller, respectively. It seems reasonable to expect further improvements at long and short time scales.
Fig. 4. Setup for a telemeter that exploits an amplitude modulated broadband source. OI: optical isolator.
The amplitude balance lock aims at keeping the measurement/reference optical balance, whatever the distance, hence cancelling systematics related to amplitude-to-phase coupling.
III. THE MIXED, INTERFERENCE+MODULATION, APPROACH A. Principles of the measurement
Although a remarkably simple set-up such as Fig. 4 is certainly of interest for space applications, it is expected to be limited to a ≈1nm/√Hz noise floor due to photon statistics for 1mW detected light power. The search for better resolution implies that optical interference lies at the heart of the measurement. In the set-up in Fig. 5, the signal delivered by the "measurement photodiode" PhD1 results from the interference between the measurement beam (path length
L
) and the reference beam (path lengthl
) and is exploited using the amplitude and phase reference provided by the "reference photodiode" PhD0.The data acquisition records the values of the amplitudes
A
0, A
1 and phasesϕ
0,
ϕ
1 of the HF modulations detected by PhD0 and PhD1. Considering the different contributions to the signal at frequencyF
=
δ
/
2
π
, and writingε
²
the fraction of power (of the order of one or a few %) that propagates along the reference path, one gets, for the HF signal from photodiode PhD1, the expression] 2 / ) ( [ 2 ) / ( 2 ) / ( 2 ) ( 1 1
(
1
)
2
1
cos[
(
)
/
]
c l L t i av c l t i c L t i t ie
e
L
l
c
e
e
A
δ−ϕ=
−
ε
δ −+
ε
δ −+
ε
−
ε
ω
−
δ − + , (3)in which constant factors have been omitted. The first two terms correspond to the beams that have followed, respectively, the measurement and reference path. In the "phasor" representation, they correspond to two (one large and one small) vectors, constant as long as
L
,l
andδ
are constant. Only the third term, the interferenceterm, involves the optical wavelength, through
ω
av=
2 c
π
/
λ
. When the optical wavelength is scanned over more thanc
/(
L
−
l
)
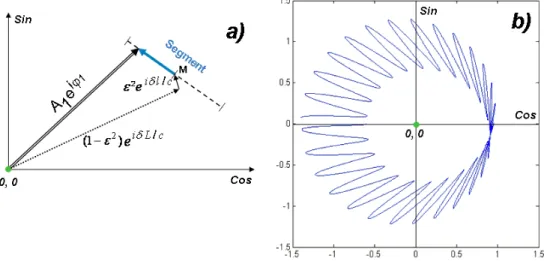
, the amplitude of the third term oscillates, and the corresponding vector in the phasor representation of Fig. 6, ranges from one to the other end of the segment drawn in dashed line.Fig. 5. Set-up for detection of the mixed signal. PhD0 and PhD1:reference and measurement
fast photodiodes. λ/2: fixed half-wave plate. (P)BS: (polarising) beam splitter.
When the optical wavelength is kept constant, and the measurement path length
L
is scanned, not only the oscillating behavior mentioned above is observed for the third term of (3), but at the same time,- the first term of (3) rotates with the phase factor
e
iδL/c and describes a circle centered at (0,0), - the third term also rotates, although with a speed twice smaller, as the phase factor ise
iδ(L+l)/2c for the interference term. This is the reason for this peculiar shape of the pattern in Fig. 6-b).Fig. 6. Phasor representation of the detected PhD1 high frequency signal. a) shows the "segment"drawn by the
resultant vector when the optical wavelength is scanned. b) shows the curve drawn by the resultant vector when the measurement path length
L
is scanned over more one synthetic wavelengthΛ
=
c
/
F
. For the clarityof the figure, an unrealistic value of 25 has been assumed for the ratio
Λ
/
λ
. The actual HF frequency is 20GHz andλ
=
1
.
5
µ m so thatΛ
/
λ
≈ 104and the actual pattern in b) is actually made of 104 "spikes".
Fig. 7. Recordings of the "segments" (see Fig. 6- a)) on
the PhD1 signal (using PhD0 as a phase and amplitude reference) for 18 different positions of the target corner cube at a distance of 1.5m with 0.5 mm increments. Analog to digital conversion is made at the output of a mixer that shifts the frequency of the signal from 20 GHz to 20 MHz. The signal is kept low enough that the mixer is far from saturation.
B. Exploitation of the mixed signal
This complex shape may seem difficult to exploit for laser ranging. However, a time-of-flight measurement can be done beforehand, yielding
∆
L
TOF≡
(
L
−
l
)
TOF with an accuracy better than 0.1mm [12]. This preliminary information can be used to measure the mixed signal for three valuesλ
,
λ
'
andλ
'
'
of the optical wavelength that differ byc
/(
2
∆
L
TOF)
andc
/(
4
∆
L
TOF)
. Then, appropriate exploitation ofAe
iϕ as a function ofλ
provides -i) the middle (M, in Fig. 6-a) of the segment, from which∆
L
synth, the intermediate precision ranging can be retrieved and -ii) the interferometric phase2
π
∆
L
/
λ
, from which the high resolution ranging∆
L
Interf can be obtained. This last value will be a high accuracy (sub-nm)∆
L
determination, provided that-
λ
, locked to a known reference, is known with the required accuracy- the measurement of the amplitude and phase of the PhD1 signal is made with an accuracy much below 10-4 and 10-4 cycle in amplitude and phase, respectively.
Preliminary mixed signal data (Fig. 7), recorded with no optics at normal incidence, show deviations (3x10⁻³ peak-to-peak) that mainly originate in the non-linearity in the commercial oscilloscope used for data acquisition. More work is needed to bring the accuracy to better than 10-4 and 10-4 cycle in the amplitude and phase measurements of the HF signal from PhD1.
IV. CONCLUSION
We have presented two ranging systems under development that exploit a laser beam with high frequency amplitude modulation. With a simple setup in which a low coherence source can be used, as the measurement makes no use of interference, a resolution of 10 nm has been obtained after analysis and reduction of systematic errors. The highest resolution will be obtained by implementing an interferometer with a two-mode source, in a way that generates a high-frequency signal in which the amplitude and phase are modulated by optical interference. Preliminary data confirm the principle of the measurement, as well as the importance of removing any optics at which unwanted interference can take place. A digital electronics will have to deal with the control of the optical wavelength during data acquisition and with the processing of the data.
ACKOWLEDGMENTS
This work is funded by CNES and by Agence Nationale pour la Recherche (contract ANR-07BLAN0309-01). C.C. acknowledges financial support from Thales Alenia Space and Region PACA.
REFERENCES
[1] J. A. Greenwood and G. J. Wojcik, "Massive Metrology: Development and Implementation of a 3D Reference Frame for the Realignment of Fermilab's Tevatron", http://www.slac.stanford.edu/econf/ C06092511/presents/TH011_PPT.PDF
[2] W. T. Estler, K. L. Edmundson, G. N. Peggs, D. H. Parker, “Large scale metrology - an update” CIRP Ann. Manuf. Technol., vol. 51, 587-609, 2002.
[3] Y. Salvadé, N. Schuhler, S. Lévêque and S. Le Floch, "High-accuracy absolute distance measurement using frequency-comb referenced multiwavelength source", Appl. Opt. vol. 47, 2715-2720, 2008.
[4] O.P. Lay et al., "MSTAR: a sub-micrometer absolute metrology system", Opt. Lett. vol. 28, 890-892 (2003).
[5] I. Coddington, W. C. Swann, L. Nenadovic, N. R. Newbury, “Rapid and precise absolute distance measurements at long range”, Nature Photonics, vol. 3, 351-356, 2009.
[6] C. Dorrer, D.C. Kilper, H.R. Stuart, G. Raybon and M. G. Raymer, “Linear optical sampling” IEEE Photon. Technol. Lett., vol. 15, 1746-1748, 2003.
[7] C. Courde, M. Lintz and A. Brillet, Meas. Sci. Technol. vol. 20, 127002, 2009.
[8] J. M. Payne, D. Parker and F. Bradley, "Rangefinder with fast multiple range capability", Rev. Sci. Instrum. vol 63, 3311-3316.
[9] I. Fujima, S. Iwasaki, K. Seta, "High-resolution distance meter using optical intensity modulation at 28GHz", Meas. Sci. Technol. vol. 9, 1049-1052, 1998
[10] M. Lintz, C. Courde, A. Brillet, C. N. Man,, "Asolute measurements using two-mode laser telemetry", ICSO 2008 conference (Toulouse), http://www.icsoconference2008.com/cd/page_30sessions.pdf
[11] Optida, Vilnius, Lithuania, www.optida.lt [12] E. Samain, private communication.