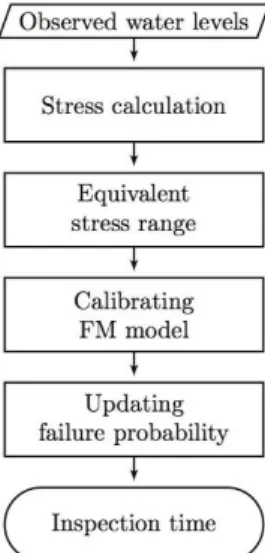
Updating the failure probability of miter gates based on observation of water levels
Texte intégral
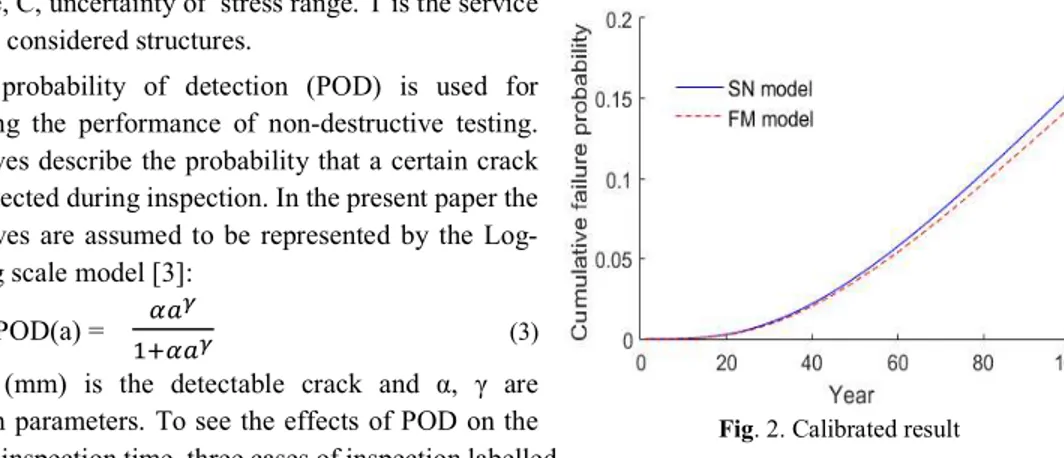
Figure
Documents relatifs
The unitary maps ϕ 12 will be very useful in the study of the diagonal action of U(2) on triples of Lagrangian subspaces of C 2 (see section 3).. 2.4
of disorders of consciousness, functional neuroimaging and machine learning algorithms. The forth
Ce type d’interface neuronale a ´ et´ e utilis´ ee pour le contrˆ ole d’un bras robotique par un patient t´ etrapl´ egique [51], le d´ eveloppement d’une proth` ese
Il faut souligner que c’est dans ce canton que se concentre la majorité (33%) des Équatoriennes et Équatoriens résidant (avec ou sans papiers) en Suisse 1. D’un point de vue
Ein verwandt- schaftliches Empfinden ergab sich vor allem aus dem gemeinsamen Status einer Republik, aber auch aufgrund der ähnliehen politischen Institutionen und
In the Falck case, the far-sighted family champion of change Alberto Falck—with crucial support of the external CEO Achille Colombo—was able to de-escalate the family business
C’était le moment choisi par l’aïeul, […] pour réaliser le vœu si longtemps caressé d’ accroître son troupeau que les sècheresses, les épizoodies et la rouerie de
L’archive ouverte pluridisciplinaire HAL, est destinée au dépôt et à la diffusion de documents scientifiques de niveau recherche, publiés ou non, émanant des
