HAL Id: hal-03186447
https://hal.archives-ouvertes.fr/hal-03186447
Submitted on 31 Mar 2021
HAL is a multi-disciplinary open access
archive for the deposit and dissemination of
sci-entific research documents, whether they are
pub-lished or not. The documents may come from
teaching and research institutions in France or
abroad, or from public or private research centers.
L’archive ouverte pluridisciplinaire HAL, est
destinée au dépôt et à la diffusion de documents
scientifiques de niveau recherche, publiés ou non,
émanant des établissements d’enseignement et de
recherche français ou étrangers, des laboratoires
publics ou privés.
A Core Set of Microsatellite Markers for Western Corn
Rootworm (Coleoptera: Chrysomelidae) Population
Genetics Studies
Kyung Seok Kim, Uwe Stolz, Nicholas J. Miller, Eric R. Waits, Thomas
Guillemaud, Douglas V. Sumerford, Thomas W. Sappington
To cite this version:
Kyung Seok Kim, Uwe Stolz, Nicholas J. Miller, Eric R. Waits, Thomas Guillemaud, et al.. A Core
Set of Microsatellite Markers for Western Corn Rootworm (Coleoptera: Chrysomelidae) Population
Genetics Studies. Environmental Entomology, Entomological Society of America, 2008, 37 (2),
pp.293-300. �10.1093/ee/37.2.293�. �hal-03186447�
A Core Set of Microsatellite Markers for Western Corn Rootworm
(Coleoptera: Chrysomelidae) Population Genetics Studies
KYUNG SEOK KIM,1UWE STOLZ,2,3NICHOLAS J. MILLER,1,4ERIC R. WAITS,2THOMAS GUILLEMAUD,4 DOUGLAS V. SUMERFORD,1ANDTHOMAS W. SAPPINGTON1,5
Environ. Entomol. 37(2): 293Ð300 (2008)
ABSTRACT Interest in the ecological and population genetics of the western corn rootworm,
Diabrotica virgifera virgiferaLeConte, has grown rapidly in the last few years in North America and Europe. This interest is a result of a number of converging issues related to the increasing difÞculty in managing this pest and the need to characterize and understand gene ßow in the context of insect resistance management. One of the key components needed for successful population genetics studies is the availability of suitable molecular markers. Using a standard group of microsatellite markers enables researchers from different laboratories to directly compare and share their data, reducing duplication of effort and facilitating collaborative work among laboratories. We screened 22 candidate microsatellite loci against Þve criteria to create a core set of microsatellite markers for D. v. virgifera population genetics studies. The criteria for inclusion were moderate to high polymorphism, unam-biguous readability and repeatability, no evidence of null alleles, apparent selective neutrality, and no linkage between loci. Based on our results, we recommend six microsatellite markers to be included as a core set in future population genetics studies of D. v. virgifera along with any other microsatellite or genetic markers. As more microsatellites are developed, those meeting the criteria can be added to the core set. We encourage other groups of researchers with common interests in a particular insect species to develop their own core sets of markers for population genetics applications.
KEY WORDS Diabrotica, western corn rootworm, microsatellites, population genetics, DNA markers
The western corn rootworm, Diabrotica virgifera
vir-giferaLeConte, causes huge economic losses annually in the United States (Metcalf 1983, Sappington et al. 2006) and is now responsible for increasing damage in Europe as it continues to expand its range after its initial detection in the early 1990s (Barcˇic´ et al. 2003, Hemerik et al. 2004, Miller et al. 2005). In addition, this pest is becoming more difÞcult to manage in parts of its range in North America because of the develop-ment of resistance to chemical insecticides (Meinke et al. 1998, Wright et al. 2000) and to crop rotation (Le-vine et al. 2002). Transgenic Bt corn expressing the Cry3Bb1 toxin from Bacillus thuringiensis has proven
very effective in the United States (Al-Deeb and Wilde 2005), but there is concern that D. v. virgifera could evolve resistance to this product as well. An insect resistance management (IRM) strategy has been mandated in the United States to prolong the effective life of Bt corn, but the effectiveness of the IRM plan depends in part on rates and patterns of movement among rootworm populations, something that is not well understood. Indeed, the rate of resis-tance evolution will depend in part on both movement and gene ßow, as well as the size of populations. The availability of robust molecular markers for rootworms will be instrumental in population genetics studies to determine effective population sizes, genetic struc-turing, and rates of gene ßow.
Any type of genetic marker that is neutral and poly-morphic can be used for studying the population ge-netics of Diabrotica or any other insect. Microsatellites enjoy a number of advantages making them a popular genetic marker system, widely used to test ecological and evolutionary hypotheses in natural or experimen-tal populations (Zhang and Hewitt 2003, Selkoe and Toonen 2006). They are highly polymorphic, codomi-nant, and usually effectively neutral. In addition, this marker system is reliable and amenable to multiplex-ing, high-throughput genotypmultiplex-ing, and automated scor-ing. Although developing new microsatellite markers
Mention of trade names or commercial products in this article is solely for the purpose of providing speciÞc information and does not imply recommendation or endorsement by the U.S. Department of Agriculture.
1USDAÐARS Corn Insects and Crop Genetics Research Unit,
Ge-netics Laboratory, Iowa State University, Ames, IA 50011.
2U.S. Environmental Protection Agency, Molecular Ecology
Re-search Branch, National Exposure ReRe-search Laboratory, 26 W Martin Luther King Dr., Cincinnati, OH 45268.
3Current address: College of Public Health, The Ohio State
Uni-versity, M-006 Starling-Loving Hall, 320 West 10th Ave., Columbus, OH 43210.
4Equipe “Biologie des Populations en Interaction,” UMR 1112
R.O.S.E. INRA-Universite´ de Nice-Sophia Antipolis, 400 Route des Chappes, BP 167 06903 Sophia Antipolis cedex, France.
5Corresponding author, e-mail: Tom.Sappington@ars.usda.gov.
by sequencing clones from repeat-enriched genomic libraries usually involves considerable time and sig-niÞcant cost (Zane et al. 2002), once they are devel-oped, genotyping is rapid and cost effective. The es-tablishment of an international Diabrotica Genetics Consortium was fueled in large part by the desire of scientists in several laboratories to avoid costly dupli-cation of effort in developing microsatellite markers for this insect (Sappington et al. 2006). Diabrotica microsatellite markers have been developed by three collaborating laboratories (Kim and Sappington 2005b, Kim et al. 2008, Waits and Stolz 2008). Several of these markers have been successfully used to assess genetic structure of both natural populations (Kim and Sappington 2005a, Miller et al. 2006, 2007, Kim et al. 2008) and laboratory colonies (Kim et al. 2007) of
D. v. virgifera,and to identify routes of invasion in Europe (Miller et al. 2005).
One of the priorities established by consortium sci-entists meeting at the International Diabrotica Genet-ics Conference in December 2004 was to develop a core set of microsatellite markers to facilitate future D.
v. virgifera population genetics studies (Sappington et al. 2006). Use of the same microsatellites in different laboratories will allow direct comparisons among data sets, including studies of temporal changes in genetic structure within a region, spatial differences in struc-ture across regions, and meta-analyses. Moreover, common use of a core set of markers allows direct sharing of D. v. virgifera genotype datasets across lab-oratories, thereby reducing unnecessary duplicate genotyping of overlapping populations. For example, the Agricultural Research Service provided raw mic-rosatellite genotype data from U.S. populations ana-lyzed for one study (Kim and Sappington 2005b) to the French team using the same markers to analyze invasion routes of D. v. virgifera in Europe (Miller et al. 2005), thus saving the latter signiÞcant resources and time to the beneÞt of all.
Here, we report development of a core set of mic-rosatellite markers for D. v. virgifera that we recom-mend for any future population genetics studies of this insect where microsatellites are to be used. We de-scribe the criteria used for inclusion of a marker in the core set, the methods for testing candidate markers, and standardization of the chosen markers across lab-oratories. We encourage other laboratories to con-sider collaborating in the development of core sets of microsatellites for population genetics applications in their target species as well, and hope this case study with D. v. virgifera will provide a useful template for developing such panels.
Materials and Methods Microsatellites and Fragment Analysis
A total of 22 rootworm microsatellites were consid-ered for inclusion in the D. v. virgifera core set of microsatellites for population genetic studies. These candidate loci were initially isolated by the USDAÐ ARS, Corn Insects and Crop Genetics Research Unit,
Ames, IA, from a D. v. virgifera genomic DNA using biotin-enrichment methods (Kim and Sappington 2005b), and the U.S. Environmental Protection Agency, Molecular Ecology Research Branch (EPA), Cincinnati, OH. The EPA laboratory developed mic-rosatellites from genomic DNA pooled from Mexican corn rootworms, D. v. zeae Krysan and Smith, and northern corn rootworms, D. barberi Smith and Law-rence, by an enrichment method using core repeat motifs different from the ARS team (Waits and Stolz 2008). D. v. virgifera and D. v. zeae are subspecies that differ morphologically and are partially reproduc-tively isolated, but which hybridize in nature (Krysan et al. 1980, Giordano et al. 1997). Cross-ampliÞcation of loci in these subspecies is usually successful (Kim and Sappington 2005b, Waits and Stolz 2008).
Genotyping of individuals was conducted using adults of mixed sexes that were frozen after collection. Genomic DNA was extracted from individual root-worms using Bio-RadÕs Aqua Pure isolation kit (Bio-Rad, Hercules, CA), according to the manufacturerÕs protocol. Each microsatellite locus was ampliÞed in multiplexed or single polymerase chain reactions (PCR) in three laboratories: ARS, EPA, and the Institut National de la Recherche Agronomique (INRA), Sophia Antipolis, France. The PCR frag-ments were analyzed by capillary gel electrophoresis on two different automated sequencing systems: the EPA and INRA laboratories each used an ABI 3100 (Applied Biosystems, Foster City, CA), and ARS used a Beckman-Coulter CEQ 8000 Genetic Analysis Sys-tem (Beckman Coulter, Fullerton, CA). Genotypes were determined using Applied BiosystemsÕ Genemap-per software (EPA) or SoftGeneticsÕ GeneMarker pro-gram, version 1.40 (SoftGenetics, State College, PA) (INRA) for data from the ABI sequencers and using CEQ 8000 Software, version 5.0 (ARS), for data from the Beckman-Coulter CEQ 8000.
Evaluating Microsatellite Loci for Inclusion in the Core Set
The following criteria were used to guide the se-lection of microsatellite markers for the core set: mod-erate to high level of polymorphism; unambiguous readability and repeatability across laboratories; no evidence of null alleles; apparent selective neutrality; and not linked with other core markers.
Polymorphism. Polymorphism of each microsatel-lite marker was examined for a sample of 61 D. v.
virgiferaadults collected from Ankeny, IA, in 2003. Measures of polymorphism include the number of alleles per locus (A), observed heterozygosity (HO), and unbiased estimates of expected heterozygosity (HE) under Hardy-Weinberg assumptions (Nei 1987), all of which were calculated using the program CERVUS 2.0 (Marshall et al. 1998). We considered moderate to high polymorphism (0.4ⱕ HE⬍ 0.9) necessary for possible inclusion in the core set of microsatellites. Markers of low polymorphism may have insufÞcient power to detect structure among populations unless they are highly divergent.
Con-294 ENVIRONMENTALENTOMOLOGY Vol. 37, no. 2
versely, hypervariable microsatellites are at increased risk of size homoplasy, where alleles that are identical in state are not identical by descent, thus leading to underestimates in the degree of between-population divergence (Estoup et al. 1995). Such markers will underestimate measures of population differentiation such as FST (Estoup et al. 1995; Hedrick 1999), al-though they can be very useful for applications such as population assignment or parentage analysis.
Readability and Repeatability. DNA from the same set of 16 D. v. virgifera individuals collected from Pennsylvania in 2004 was ampliÞed and genotyped independently at three laboratories (ARS, EPA, INRA) and evaluated for readability and repeatability at each locus. The laboratories used different combi-nations of automatic sequencers and software for al-lele size calls and genotyping, as indicated above. The program MICRO-CHECKER (Oosterhout et al. 2004) was used to screen for technical errors that can occur during PCR ampliÞcation, such as stuttering, large allele dropout, and null alleles.
Null Alleles. A null allele arises from a mutation in a primer binding site that prevents PCR ampliÞcation of the microsatellite locus. If one of two alleles at a locus in an individual does not amplify, the genotype at that locus will be scored as homozygous for the allele that does amplify, when in fact the true identity of the unampliÞed allele is unknown. The presence of null alleles in the population thus biases estimates of population genetics parameters through overestima-tion of homozygosity, so it is important to exclude markers harboring such alleles from the core set. To screen for null alleles, controlled single-pair crosses of
D. v. virgiferawere made as described by Kim et al. (2008). Genomic DNA was extracted from the parents and⬇50 of the F1offspring from each cross. At each microsatellite locus, we checked for distortions to ex-pected Mendelian segregation of alleles among off-spring based on parental genotypes. All 22 microsat-ellite loci were examined across 10 families. The frequency (p) at which a null allele occurs and can be expected to be detected with 95% conÞdence from a given number of genes (n) can be calculated from the equation Y⫽ (1 ⫺ p)n, where Y is the chosen prob-ability level of not detecting a null allele (here, 0.05). Thus, for 10 families, assuming the parents in the single-pair matings were unrelated, we expected with 95% conÞdence to detect a null allele present in the population at a frequencyⱖ0.072. The potential oc-currence of null alleles also was tested in the Iowa sample of 61 adults using the program CHECKER (Oosterhout et al. 2004). MICRO-CHECKER infers the presence of a null allele when signiÞcant excess homozygosity is distributed evenly across all of the alleles at a locus.
Selective Neutrality. Population genetics structure analyses are based on the premise that genetic varia-tion and evoluvaria-tionary mechanisms have identical ef-fects across neutral loci. Thus, it is imperative that the markers used are selectively neutral. Absence of se-lection at each locus was examined by the Ewens-Watterson homozygosity test (Ewens-Watterson 1978) and
the Ewens-Watterson-Slatkin exact test (Slatkin 1994, 1996) using allele frequency distribution, as imple-mented with the software package Arlequin 3.1 (Schneider et al. 2000). In these tests, the null distri-bution of the homozygosity statistic (Fexp) under the inÞnite-alleles model and the sampling theory of neu-tral alleles of Ewens (1972) are obtained from com-puter simulations and are compared with the observed homozygosity (Fobs) from the original sample. Signif-icantly low P values (P⬍ 0.05) indicate the null hy-pothesis of selective neutrality should be rejected and imply the presence of selection, which can take the form of balancing selection in favor of heterozygotes or directional selection of advantageous alleles. Al-though these tests cannot prove the absence of selec-tion, they are the best available at this time, and any loci they ßag should be removed from consideration. Linkage Relationships. If two marker loci do not assort independently, estimates of population genetics parameters will be biased. Thus, even when two mi-crosatellite loci are suitable for population studies in every other way, if they are statistically linked, only one should be used in a given analysis. Parents and⬇50 offspring from four controlled families were geno-typed and used to test for linkage between the can-didate microsatellite loci. Potential linkage between each locus pair was examined with2goodness-of Þt tests between the observed numbers of genotypes in the offspring and those expected under free recom-bination of the loci. We also tested for linkage dis-equilibrium between pairs of loci for a sample of 61 D.
v. virgiferaadults collected from Ankeny, IA, in 2003 based on the Fisher method, using the genotypic dis-equilibrium option implemented in the program GENEPOP (Raymond and Rousset 1995).
Results Polymorphism
Of the 22 D. v. virgifera candidate microsatellites screened for inclusion in the core set, 13, 8, and 1 had dinucleotide, trinucleotide, and tetranucleotide re-peat motifs, respectively (Kim and Sappington 2005b, Waits and Stolz 2008). In the survey of 61 individuals, the number of alleles per locus ranged from 2 to 20, and HEvalues ranged from 0.192 to 0.886. Three dif-ferent measures showed the highest polymorphism in
DVV-D3and the lowest in Dba01. Five markers had a high level of polymorphism, with 0.8ⱕ HE⬍ 0.9. The majority of markers had a moderate level of polymor-phism, with 0.4ⱕ HE⬍ 0.8, whereas four showed low levels of polymorphism with HE⬍ 0.4 (Kim and Sap-pington 2005b, Waits and Stolz 2008).
Readability and Repeatability
Most of the markers were easy to score and were repeatable across the three laboratories. However, readability of a few of the markersÑD9,
DVV-D10, DVV-D11,and DVV-T1Ñwas variable across lab-oratories. Possible scoring errors caused by stuttering
were detected in DVV-D7 and DVV-T4 (Table 1). The MICRO-CHECKER analysis showed no evidence of large-allele dropout. However, differences in band intensity between the small and large alleles was ob-served for DVV-T1 and DVV-D10, making scoring of alleles at these loci difÞcult in some individuals. Null Alleles
For 9 of 22 loci examined by family analysis, alleles of the offspring did not match one of the parents in at least one family, showing abnormal segregation and therefore the presence of a null allele. Six of these loci also were ßagged by the MICRO-CHECKER analysis as having null alleles and homozygote excess (Table 1). Thus, three loci had null alleles that were too rare in the Iowa population to cause substantial deviations from Hardy-Weinberg expectations and be detected by MICRO-CHECKER. Although family analysis is the most sensitive approach for detecting null alleles, it is not always a practical option, and MICRO-CHECKER offers the best alternative.
Selective Neutrality
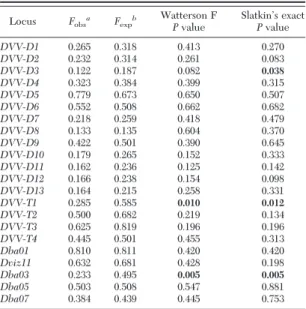
The homozygosity test of selective neutrality showed that observed homozygosity for two loci,
DVV-T1and Dba03, departed signiÞcantly (P⬍ 0.05) from expected values (Table 2). The DVV-D3 locus also showed evidence of non-neutrality in one of two neutrality tests (i.e., the Ewens-Watterson-Slatkin ex-act test). Thus, the null hypothesis of selective neu-trality was not rejected for 19 of the candidate loci.
Linkage Relationships
Linkage analysis using controlled families showed that the locus pairs DVV-D8/DVV-D9, Dba01/Dviz11,
Table 1. Genotyping characteristics of each D. v. virgifera microsatellite based on MICRO-CHECKER analysis and evidence of null alleles based on family analysis
Locus
MICRO-CHECKER Family analysisa
Homozygote excess Scoring error from stuttering Large allele dropout Null allele (frequency)
Null allele (no. parents with
null allele)
DVV-D1 No No No No (0.045) Yes (5)
DVV-D2 No No No No (0.054) No
DVV-D3 Yes No No Yes (0.062) Yes (3)
DVV-D4 No No No No (⫺0.038) No
DVV-D5 No No No No (⫺0.000) Yes (1)
DVV-D6 Yes No No Yes (0.163) Yes (3)
DVV-D7 Yes Yes No Yes (0.153) Yes (5)
DVV-D8 No No No No (⫺0.000) No
DVV-D9 No No No No (0.061) No
DVV-D10 No No Nob
No (0.025) No
DVV-D11 No No No No (0.008) No
DVV-D12 Yes No No Yes (0.132) Yes (5)
DVV-D13 Yes No No Yes (0.098) Yes (9)
DVV-T1 No No Nob
No (0.069) Yes (1)c
DVV-T2 No No No No (⫺0.009) No
DVV-T3 No No No No (0.011) No
DVV-T4 Yes Yes No Yes (0.163) Yes (2)
Dba01 No No No No (⫺0.113) No Dviz11 No No No No (0.029) No Dba03 No No No No (⫺0.044) No Dba05 No No No No (⫺0.022) No Dba07 No No No No (⫺0.016) No a
Based on a survey of Mendelian inheritance of offspring and parental genotypes in 10 unrelated families.
b
Marker showed substantial difference in band intensity between the small and large alleles by manual examination.
c
Might be caused by the poor readability of large allele size in one family.
Table 2. Results of selective neutrality tests of the 22 micro-satellite loci in a western corn rootworm population
Locus Fobsa Fexpb
Watterson F Pvalue SlatkinÕs exact Pvalue DVV-D1 0.265 0.318 0.413 0.270 DVV-D2 0.232 0.314 0.261 0.083 DVV-D3 0.122 0.187 0.082 0.038 DVV-D4 0.323 0.384 0.399 0.315 DVV-D5 0.779 0.673 0.650 0.507 DVV-D6 0.552 0.508 0.662 0.682 DVV-D7 0.218 0.259 0.418 0.479 DVV-D8 0.133 0.135 0.604 0.370 DVV-D9 0.422 0.501 0.390 0.645 DVV-D10 0.179 0.265 0.152 0.333 DVV-D11 0.162 0.236 0.125 0.142 DVV-D12 0.166 0.238 0.154 0.098 DVV-D13 0.164 0.215 0.258 0.331 DVV-T1 0.285 0.585 0.010 0.012 DVV-T2 0.500 0.682 0.219 0.134 DVV-T3 0.625 0.819 0.196 0.196 DVV-T4 0.445 0.501 0.455 0.313 Dba01 0.810 0.811 0.420 0.420 Dviz11 0.632 0.681 0.428 0.198 Dba03 0.233 0.495 0.005 0.005 Dba05 0.503 0.508 0.547 0.881 Dba07 0.384 0.439 0.445 0.753
SigniÞcant deviation from neutrality (Pⱕ 0.05) indicated in bold.
a
The observed homozygosity calculated by the sum of the squares of allele frequencies.
b
The expected homozygosity under neutrality generated by sim-ulating random neutral samples.
296 ENVIRONMENTALENTOMOLOGY Vol. 37, no. 2
and Dba03/DVV-D2 are tightly linked to one another. The exact tests for genotypic linkage disequilibrium between pairs of loci (231 tests) showed signiÞcant linkage disequilibrium for DVV-D8/DVV-D10, after correction for multiple tests. DVV-D8 was implicated by both tests but as part of different locus pairs. Thus, seven loci were implicated in linkage relationships by at least one test.
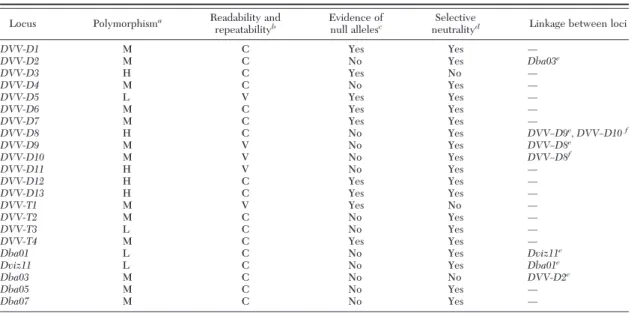
Recommended Core Set and Standardization Performance of the 22 loci relative to each of the criteria for inclusion in the core set of D. v. virgifera
microsatellites (i.e., moderate to high polymorphism, easily scored alleles, no evidence of null alleles, ap-parent selective neutrality, and no linkage with other core loci) is summarized in Table 3. There were six microsatellites that satisÞed all of the above criteria and are recommended as the core set for use in future population genetics studies of this species: DVV-D2,
DVV–D4, DVV–D8, DVV-T2, Dba05, and Dba07 (Table 4).
In addition to the six core microsatellites, Þve ad-ditional loci should be usable in studies of D. v.
vir-giferapopulations but are excluded from the core set because of an HEvalue⬍0.4 (DVV-T3 and Dviz11 or
Table 3. Summary of performance of D. v. virgifera microsatellites relative to each criterion for inclusion in the core set Locus Polymorphisma Readability and
repeatabilityb Evidence of
null allelesc Selective
neutralityd Linkage between loci
DVV-D1 M C Yes Yes Ñ DVV-D2 M C No Yes Dba03e DVV-D3 H C Yes No Ñ DVV-D4 M C No Yes Ñ DVV-D5 L V Yes Yes Ñ DVV-D6 M C Yes Yes Ñ DVV-D7 M C Yes Yes Ñ DVV-D8 H C No Yes DVV–D9e, DVV–D10f DVV-D9 M V No Yes DVV–D8e DVV-D10 M V No Yes DVV–D8f DVV-D11 H V No Yes Ñ DVV-D12 H C Yes Yes Ñ DVV-D13 H C Yes Yes Ñ DVV-T1 M V Yes No Ñ DVV-T2 M C No Yes Ñ DVV-T3 L C No Yes Ñ DVV-T4 M C Yes Yes Ñ
Dba01 L C No Yes Dviz11e
Dviz11 L C No Yes Dba01e
Dba03 M C No No DVV-D2e
Dba05 M C No Yes Ñ
Dba07 M C No Yes Ñ
aBased on the expected heterozygosity (H
E); 0⬍ low (L) ⬍ 0.4, 0.4 ⱕ moderate (M) ⬍ 0.8, 0.8 ⱕ high (H) ⬍ 0.9.
bC, clear; V, variable across laboratories. cPresence of null allele based on family analysis.
dYes denotes the null hypothesis of selective neutrality against the presence of selection was not rejected for that locus at P⫽ 0.05, and
no denotes the null hypothesis of neutrality was rejected for that locus.
eLinkage analysis from controlled family.
fLinkage disequilibrium based on FisherÕs exact test for genotypic linkage disequilibrium using the program GENEPOP 3.3 (Raymond and
Rousset 1995).
Table 4. Recommended core set of D. v. virgifera microsatellite markers for population genetics studies and characteristics from a survey of 61 wild individualsa
Locus name
(repeat motif) Primer sequences (5⬘Ð3⬘)
Size range (bp) No. of alleles GenBank accession no. DVV-D2 F: CACGCAGCACTTAATTGGTTT 182Ð208 9 AY738532 (dinucleotide) R: CTATGCCTCCCAATTCGTGT DVV-D4 F: TGTGTGCAGTGTCCCGTTAT 221Ð239 7 AY738534 (dinucleotide) R: GTGGCCAGTATTCACGACCT DVV-D8 F: AAGGCAGGTAGTAATGTTGGTGA 211Ð249 20 AY738538 (dinucleotide) R: TCATCACTAATGGGGAAACGA DVV-T2 F: ATCGGTTTTGGCTGGATATG 212Ð224 3 AY738546 (trinucleotide) R: GTTCAACAACTCGCAAACCA
Dba05 F: GCTGAGGAGGCTTATGTC 215Ð235 5 EF524280
(trinucleotide) R: CAATGGAGGTTGGCTATT
Dba07 F: ATCGGTGTAACTTTTCCACA 215Ð235 6 EF524282
(tetranucleotide) R: CACATCGGCATAGGATAGAC
a
Data for DVV loci are from Kim and Sappington (2005b). Dba loci were described by Waits and Stolz (2008), but data for size range and no. of alleles were determined independently in this study from the same set of 61 wild individuals as the DVV loci.
Dba01), linkage disequilibrium with a core microsat-ellite (DVV–D10), or they exhibited variable read-ability across laboratories (DVV-D9, DVV–D10, DVV–
D11). Although variability across laboratories disqualiÞes the latter markers from the core set, they probably will be consistent and work well within any particular laboratory. DVV-T3 and Dviz11 exhibited only two and three alleles, respectively, in the Iowa population surveyed, but more alleles may yet be discovered in other populations.
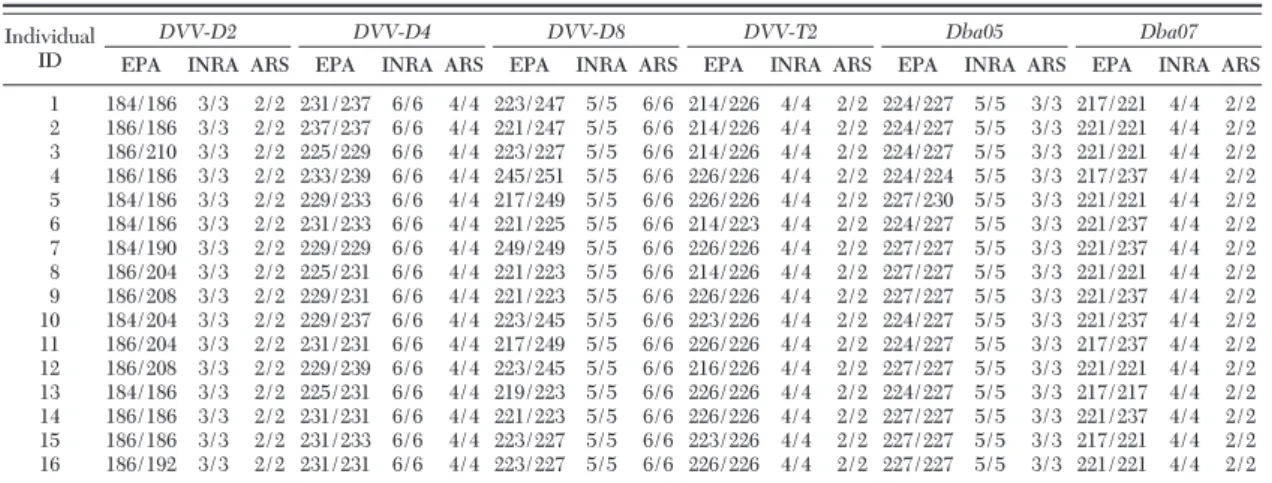
Apparent allele sizes can differ depending on the equipment and software used, so standardization of allele calls using reference DNA from a common panel of individuals is important (Roslin Institute 2002). For the selected core set of microsatellites, we compared genotypes obtained from 16 D. v. virgifera individuals in three different laboratories (ARS, EPA, INRA) to test the consistency of genotyping using different electrophoresis platforms and analysis software. Allele calls differed by up to six bases, depending on the laboratory and the locus. However, there was a con-sistent offset in allele size between the laboratories, so that samples showed the same genotypes across the three laboratories after correcting for these offsets in allele calls (Table 5).
Discussion
Although a standardized set of microsatellite mark-ers is desirable for studying the population genetics of any organism, it is especially useful for organisms that are the subject of research in multiple laboratories and countries. Obvious candidates include organisms of economic signiÞcance and wide geographic distribu-tion, including insect pests such as D. v. virgifera.
The concept of a core set, or universal panel, of microsatellite markers for use across all laboratories for a given organism was pioneered by researchers concerned with conserving genetic diversity in do-mestic farm animals (FAO 1995, Bradley 1996, Bau-mung et al. 2004, Hoffmann et al. 2004). However,
despite widespread familiarity with this concept within the livestock genetics community and virtually unanimous acknowledgment of its beneÞts, adoption of the recommended markers has been patchy de-pending on the species (Baumung et al. 2004). Failure to adopt the recommended markers most often occurs when a laboratory already has developed its own markers and does not want to switch to new ones for various reasons (Baumung et al. 2004). In other words, inconsistent adoption arises from an embarrassment of riches: hundreds of microsatellite markers had been developed for various species of farm animals in mul-tiple laboratories by the mid-1990s when the Þrst list of recommended markers was compiled (FAO 1995). With a few exceptions, such as Drosophila (Wilder et al. 2002) and other insects whose genomes have been sequenced (Archak et al. 2007), there is no such embarrassment of riches for insect species. Ironically, the relative lag in progress in developing microsatel-lites in insects provides entomologists with a valuable window of opportunity to standardize markers from the outset for their favorite species. Such an opening now exists for the western corn rootworm, as recog-nized by Diabrotica Genetics Consortium participants (Sappington et al. 2006).
Based on our results, we propose a core set of six D.
v. virgiferamicrosatellites that have met stringent cri-teria for usefulness in population genetics applica-tions. We identiÞed Þve additional markers that are also generally suitable for population genetics studies, although they did not meet all the proposed criteria. On the basis of a survey of 16 D. v. virgifera individuals, the core set of microsatellites gave the same genotypes across three laboratories after correcting for system-atic offsets in allele size estimates. Therefore, we rec-ommend that at least this core set of markers be used in future population genetic studies of D. v. virgifera. When such a core set of markers is constructed for other insects, it will be important to survey polymor-phism from more than one population. In the case of
D. v. virgifera, previous studies using the four core
Table 5. Genotypes of 16 western corn rootworm individuals for the core set of D. v. virgifera microsatellites from the EPA laboratory and relative offset in allele size for genotypes from other laboratories
Individual ID
DVV-D2 DVV-D4 DVV-D8 DVV-T2 Dba05 Dba07
EPA INRA ARS EPA INRA ARS EPA INRA ARS EPA INRA ARS EPA INRA ARS EPA INRA ARS 1 184/186 3/3 2/2 231/237 6/6 4/4 223/247 5/5 6/6 214/226 4/4 2/2 224/227 5/5 3/3 217/221 4/4 2/2 2 186/186 3/3 2/2 237/237 6/6 4/4 221/247 5/5 6/6 214/226 4/4 2/2 224/227 5/5 3/3 221/221 4/4 2/2 3 186/210 3/3 2/2 225/229 6/6 4/4 223/227 5/5 6/6 214/226 4/4 2/2 224/227 5/5 3/3 221/221 4/4 2/2 4 186/186 3/3 2/2 233/239 6/6 4/4 245/251 5/5 6/6 226/226 4/4 2/2 224/224 5/5 3/3 217/237 4/4 2/2 5 184/186 3/3 2/2 229/233 6/6 4/4 217/249 5/5 6/6 226/226 4/4 2/2 227/230 5/5 3/3 221/221 4/4 2/2 6 184/186 3/3 2/2 231/233 6/6 4/4 221/225 5/5 6/6 214/223 4/4 2/2 224/227 5/5 3/3 221/237 4/4 2/2 7 184/190 3/3 2/2 229/229 6/6 4/4 249/249 5/5 6/6 226/226 4/4 2/2 227/227 5/5 3/3 221/237 4/4 2/2 8 186/204 3/3 2/2 225/231 6/6 4/4 221/223 5/5 6/6 214/226 4/4 2/2 227/227 5/5 3/3 221/221 4/4 2/2 9 186/208 3/3 2/2 229/231 6/6 4/4 221/223 5/5 6/6 226/226 4/4 2/2 227/227 5/5 3/3 221/237 4/4 2/2 10 184/204 3/3 2/2 229/237 6/6 4/4 223/245 5/5 6/6 223/226 4/4 2/2 224/227 5/5 3/3 221/237 4/4 2/2 11 186/204 3/3 2/2 231/231 6/6 4/4 217/249 5/5 6/6 226/226 4/4 2/2 224/227 5/5 3/3 217/237 4/4 2/2 12 186/208 3/3 2/2 229/239 6/6 4/4 223/245 5/5 6/6 216/226 4/4 2/2 227/227 5/5 3/3 221/221 4/4 2/2 13 184/186 3/3 2/2 225/231 6/6 4/4 219/223 5/5 6/6 226/226 4/4 2/2 224/227 5/5 3/3 217/217 4/4 2/2 14 186/186 3/3 2/2 231/231 6/6 4/4 221/223 5/5 6/6 226/226 4/4 2/2 227/227 5/5 3/3 221/237 4/4 2/2 15 186/186 3/3 2/2 231/233 6/6 4/4 223/227 5/5 6/6 223/226 4/4 2/2 227/227 5/5 3/3 217/221 4/4 2/2 16 186/192 3/3 2/2 231/231 6/6 4/4 223/227 5/5 6/6 226/226 4/4 2/2 227/227 5/5 3/3 221/221 4/4 2/2 Each genotype from the INRA and ARS laboratories were subtracted from corresponding EPA genotypes.
298 ENVIRONMENTALENTOMOLOGY Vol. 37, no. 2
DVVloci in multiple populations over extensive geo-graphic areas in the United States and Europe showed that polymorphism in the Iowa sample of 61 individ-uals is representative of the other populations (Kim and Sappington 2005a). Together with the observed genetic homogeneity of populations across much of the United States (Kim and Sappington 2005a), this indicates that the two core Dba markers can be ex-pected to show similar polymorphism across space as well.
The criteria used to identify the core set of micro-satellites can be applied to any additional microsatel-lites that might be developed for this species, and new markers meeting the criteria can be added to the core set in the future. For example, a potentially large number of microsatellites could be developed inex-pensively through mining D. v. virgifera expressed sequence tag (EST) databases (Kim et al. 2008). Al-though EST-derived microsatellites loci are part of an expressed gene and thus may be subject to direct selection, background selection, or genetic hitchhik-ing (Li et al. 2002), polymorphisms in EST-derived microsatellites often behave as effectively neutral markers and can provide valid information about the genetic structure of natural populations (Woodhead et al. 2005, Kim et al. 2008).
To take the best advantage of the core set of markers for D. v. virgifera, the next step will be to create a publicly accessible central database to archive all ge-notypes at core-set loci generated from any study that uses them. Researchers would either directly upload their genotype data or submit it for uploading. The laboratory responsible for managing the database also should maintain the reference standards for free shar-ing with any laboratory intendshar-ing to use the core set. Until such a database is established, the reference DNA will be maintained by the corresponding author and shared with any interested laboratories.
Because of its adaptability to new environments and invasiveness, the evolution of insecticide and crop rotation resistance, potential for evolving resistance to rootworm-active Bt corn, considerable but not well-deÞned dispersal capacity, and economic importance in a growing number of countries, D. v. virgifera has drawn the attention of an international community of researchers interested in its ecological genetics (Sap-pington et al. 2006). Researchers from⬎20 institutions from Þve countries currently are participating in the
Diabrotica Genetics Consortium (Sappington et al. 2006), and microsatellite markers are now being used in at least eight different laboratories in the United States, Canada, France, the United Kingdom, and Aus-tralia. Clearly, corn rootworm genetics researchers will beneÞt from the standardization of microsatellite markers and sharing of reference DNA. This resource will facilitate synergistic cooperation, resulting in sig-niÞcant savings in research time and resources, as well as accelerating progress in understanding and manag-ing this difÞcult pest.
We encourage other groups of entomologists with shared interests in the ecological genetics of a partic-ular insect species to establish a core set of markers as
well. It is never too late to do so. However, the earlier in the process of marker development such an effort is initiated, the higher the future adoption rate of the recommended markers will be, and the fewer will be the lost opportunities for direct comparisons among datasets.
Acknowledgments
We thank J. Gibson and M. Ciosi for technical assistance at the USDAÐARS and INRA, respectively, and M. Bagley and M. Antolin for helpful comments and encouraging this en-deavor. N.J.M. and T.G. were partly funded by the Depart-ment Sante´ des Plantes et EnvironneDepart-ment of the French Institut National de la Recherche Agronomique. The Inter-national Diabrotica Genetics Conference was made possible by USDA-CSREES NRI Competitive Grant 2004-35607-15062 to T.W.S. and B.D.S, and by a grant to T.G. from the OfÞce of Science and Technology of the French Consulate in Chicago, IL.
References Cited
Al-Deeb, M. A., and G. E. Wilde. 2005. Effect of Bt corn
expressing the Cry3Bb1 toxin on western corn rootworm (Coleoptera: Chrysomelidae) biology. J. Kans. Entomol. Soc. 78: 142Ð152.
Archak, S., E. Meduri, P. S. Kumar, and J. Nagaraju. 2007.
InSatDb: a microsatellite database of fully sequenced insect genomes. Nucleic Acids Res. 35 (Suppl 1): D36 Ð D39.
Barcˇic´, J. I., R. Bazˇok, and M. Maceljski. 2003. Research on
the western corn rootworm (Diabrotica virgifera virgifera LeConte, Coleoptera: Chrysomelidae) in Croatia (1994 Ð 2003). Entomol. Croat. 7: 63Ð 83.
Baumung, R., H. Simianer, and I. Hoffmann. 2004. Genetic
diversity studies in farm animalsÑa survey. J. Anim. Breed. Genet. 121: 361Ð373.
Bradley, D. G. 1996. Genetic diversity in cattle: selected
DNA markers. (http://www.projects.roslin.ac.uk/cdiv/ markers.html).
Estoup, A., C. Taillez, J. M. Cornuet, and M. Solignac. 1995.
Size homoplasy and mutational processes of interrupted microsatellites in two bee species, Apis mellifera and
Bombus terrestris(Apidae). Mol. Biol. Evol. 12: 1074 Ð 1084.
Ewens, W. J. 1972. The sampling theory of selectively
neu-tral alleles. Theor. Popul. Biol. 3: 87Ð112.
[FAO] Food and Agriculture Organization of the United Nations. 1995. Global project for the maintenance of
domestic animal genetic diversity (MoDAD). (http:// dad.fao.org/).
Giordano, R., J. J. Jackson, and H. M. Robertson. 1997. The
role of Wolbachia bacteria in reproductive incompatibil-ities and hybrid zones of Diabrotica beetles and Gryllus crickets. Proc. Natl. Acad. Sci. U.S.A. 94: 11439 Ð11444.
Hedrick, P. W. 1999. Perspective: highly variable loci and
their interpretation in evolution and conservation. Evo-lution 53: 313Ð318.
Hemerik, L., C. Busstra, and P. Mols. 2004. Predicting the
temperature-dependent natural population expansion of the western corn rootworm, Diabrotica virgifera. Ento-mol. Exp. Appl. 111: 59 Ð 69.
Hoffmann, I., P. A. Marsan, J. Stuart, F. Barker, E. G. Coth-ran, O. Hanotte, J. A. Lenstra, D. Milan, S. Weigend, and H. Simianer. 2004. New MoDAD marker sets to be used
in diversity studies for the major farm animal species:
recommendations of a joint ISAG/FAO working group. (http://dad.fao.org/).
Kim, K. S., and T. W. Sappington. 2005a. Genetic
structur-ing of western corn rootworm (Coleoptera: Chrysomeli-dae) populations in the U.S. based on microsatellite loci analysis. Environ. Entomol. 34: 494 Ð503.
Kim, K. S., and T. W. Sappington. 2005b. Polymorphic
micro-satellite loci from the western corn rootworm (Insecta: Co-leoptera: Chrysomelidae) and cross-ampliÞcation with other Diabrotica spp. Mol. Ecol. Notes 5: 115Ð117.
Kim, K. S., B. W. French, D. V. Sumerford, and T. W. Sappington. 2007a. Genetic diversity in laboratory
col-onies of western corn rootworm (Coleoptera: Chry-somelidae), including a nondiapause colony. Environ. Entomol. 36: 637Ð 645.
Kim, K. S., S. T. Ratcliffe, B. W. French, L. Liu, and T. W. Sappington. 2008. Utility of EST-derived SSRs as
popu-lation genetics markers in a beetle. J. Hered. (Doi: 10.1093/j hered/esm104.)
Krysan, J. L., R. F. Smith, T. F. Branson, and P. L. Guss. 1980.
A new subspecies of Diabrotica virgifera (Coleoptera: Chrysomelidae): description, distribution, and sexual compatibility. Ann. Entomol. Soc. Am. 73: 123Ð130.
Levine, E., J. L. Spencer, S. A. Isard, D. W. Onstad, and M. E. Gray. 2002. Adaptation of the western corn rootworm to
crop rotation: evolution of a new strain in response to a management practice. Am. Entomol. 48: 94 Ð107.
Li, Y. C., A. B. Korol, T. Fahima, A. Beiles, and E. Nevo. 2002.
Microsatellites: genomic distribution, putative functions and mutational mechanisms: a review. Mol. Ecol. 11: 2453Ð2465.
Marshall, T. C., J. Slate, L. Kruuk, and J. M. Pemberton. 1998.
Statistical conÞdence for likelihood-based paternity in-ference in natural populations. Mol. Ecol. 7: 639 Ð 655.
Meinke, L. J., B. D. Siegfried, R. J. Wright, and L. D. Chan-dler. 1998. Adult susceptibility of Nebraska western
corn rootworm populations to selected insecticides. J. Econ. Entomol. 91: 594 Ð 600.
Metcalf, R. L. 1983. Implications and prognosis of resistance
to insecticides, pp. 703Ð733. In G. P. Georghiou, and T. Saito (eds.), Pest resistance to pesticides. Plenum, New York.
Miller, N., A. Estoup, S. Toepfer, D. Bourguet, L. Lapchin, S. Derridj, K. S. Kim, P. Reynaud, L. Furlan, and T. Guil-lemaud. 2005. Multiple transatlantic introductions of
the western corn rootworm. Science 310: 992.
Miller, N. J., K. S. Kim, S. T. Ratcliffe, A. Estoup, D. Bourguet, and T. Guillemaud. 2006. Absence of genetic
diver-gence between western corn rootworms (Coleoptera: Chrysomelidae) resistant and susceptible to control by crop rotation. J. Econ. Entomol. 99: 685Ð 690.
Miller, N. J., M. Ciosi, T. W. Sappington, S. T. Ratcliffe, J. L. Spencer, and T. Guillemaud. 2007. Genome scan of
Diabrotica virgifera virgiferafor genetic variation associ-ated with crop rotation tolerance. J. Appl. Entomol. 131: 378 Ð385.
Nei, M. 1987. Molecular evolutionary genetics. Columbia
University Press, New York.
Oosterhout, C. V., W. F. Hutchinson, D.P.M. Wills, and P. F. Shipley. 2004. MICRO-CHECKER: software for
identi-fying and correcting genotyping errors in microsatellite data. Mol. Ecol. Notes 4: 535Ð538.
Raymond, M., and F. Rousset. 1995. GENEPOP (version
1.2): population genetics software for exact tests and ecumenicism. J. Hered. 86: 248 Ð249.
Roslin Institute. 2002. Projects based at Roslin Institute.
(http://www.projects.roslin.ac.uk.
Sappington, T. W., B. D. Siegfried, and T. Guillemaud. 2006.
Coordinated Diabrotica genetics research: accelerating progress on an urgent insect pest problem. Am. Entomol. 52: 90 Ð97.
Schneider, S., J. M. Kueffer, D. Roessli, and L. Excoffier. 2000. ARLEQUIN manual, version 2.0. A software for
population genetic analysis. Genetics and Biometry Lab-oratory, University of Geneva, Geneva, Switzerland.
Selkoe, K. A., and R. J. Toonen. 2006. Microsatellites for
ecologists: a practical guide to using and evaluating mi-crosatellite markers. Ecol. Lett. 9: 615Ð 629.
Slatkin, M. 1994. An exact test for neutrality based on the
Ewens sampling distribution. Genet. Res. 64: 71Ð74.
Slatkin, M. 1996. A correction to the exact test based on the
Ewens sampling distribution. Genet. Res. 68: 259 Ð260.
Waits, E. R., and U. Stolz. 2008. Polymorphic microsatellite
loci from northern and Mexican corn rootworms (Insecta: Coleoptera: Chrysomelidae) and cross-ampliÞ-cation with other Diabrotica spp. Mol. Ecol. Resources. (Doi: 10.1111/j.1471-8286.2007.02056.X.)
Watterson, G. 1978. The homozygosity test of neutrality.
Genetics 88: 405Ð 417.
Wilder, J. A., T. Diaz, R.J.W. O’Neill, J. Kenney, and H. Hollocher. 2002. Characterization and isolation of novel
microsatellites from the Drosophila dunni subgroup. Genet. Res. 80: 177Ð185.
Woodhead, M., J. Russell, J. Squirrell, P. M. Hollingsworth, K. Mackenzie, M. Gibby, and W. Powell. 2005.
Compar-ative analysis of population genetic structure in Athyrium
distentifolium (Pteridophyta) using AFLPs and SSRs from anonymous and transcribed gene regions. Mol. Ecol. 14: 1681Ð1695.
Wright, R. J., M. E. Scharf, L. J. Meinke, X. Zhou, B. D. Siegfried, and L. D. Chandler. 2000. Larval
susceptibil-ity of an insecticide-resistant western corn rootworm (Coleoptera: Chrysomelidae) population to soil insecti-cides: laboratory bioassays, assays of detoxiÞcation en-zymes, and Þeld performance. J. Econ. Entomol. 93: 7Ð13.
Zane, L., L. Bargelloni, and T. Patarnello. 2002. Strategies
for microsatellite isolation: a review. Mol. Ecol. 11: 1Ð16.
Zhang, D. X., and G. M. Hewitt. 2003. Nuclear DNA
anal-yses in genetic studies of populations: practice, problems and prospects. Mol. Ecol. 12: 563Ð584.
Received 11 July 2007; accepted 17 January 2008.
300 ENVIRONMENTALENTOMOLOGY Vol. 37, no. 2