HAL Id: insu-01891490
https://hal-insu.archives-ouvertes.fr/insu-01891490
Submitted on 9 Oct 2018
HAL is a multi-disciplinary open access
archive for the deposit and dissemination of
sci-entific research documents, whether they are
pub-lished or not. The documents may come from
teaching and research institutions in France or
L’archive ouverte pluridisciplinaire HAL, est
destinée au dépôt et à la diffusion de documents
scientifiques de niveau recherche, publiés ou non,
émanant des établissements d’enseignement et de
recherche français ou étrangers, des laboratoires
model and field examples
Philippe Hervé Leloup, Yannick Ricard, Jean Battaglia, Robin Lacassin
To cite this version:
Philippe Hervé Leloup, Yannick Ricard, Jean Battaglia, Robin Lacassin. Shear heating in continental
strike-slip shear zones: model and field examples. Geophysical Journal International, Oxford
Univer-sity Press (OUP), 1998, 136 (1), pp.19-40. �10.1046/j.1365-246X.1999.00683.x�. �insu-01891490�
Shear heating in continental strike-slip shear zones:
model and field examples
Philippe Herve´ Leloup,1 Yannick Ricard,2 Jean Battaglia1 and Robin Lacassin1
1 L aboratoire de tectonique et me´canique de la lithosphe`re, CNRS-UMR 7578, Institut de physique du globe de Paris, 4 place Jussieu, 75252 Paris cedex 05, France2 L aboratoire de Sciences de la T erre, URA 726, Ecole Normale Supe´rieure de Lyon, 46 alle´e d’Italie, 69364 L yon cedex 07, France
Accepted 1998 July 6. Received 1998 June 21; in original form 1998 February 24
S U M M A R Y
A two-layer (crust and upper mantle), finite difference steady-state thermomechanical model of a long-lived (several million years) lithospheric strike-slip fault is presented, and its predictions compared with field observations from various major fault zones. In order to estimate the maximum amount of shear heating, all mechanical energy is assumed to be dissipated in heat, in ductile as well as in brittle layers. Deformation follows a friction law in the brittle layer(s), and a power-flow law in the ductile one(s). Variations of several independent parameters and their influence on the thermo-mechanical state of the fault zone and on shear heating are systematically explored. Shear heating is found to be more important in fault zones affecting an initially cold lithosphere, and increases with slip rate, friction coefficient and stiffness of materials. In extreme cases (slip rate of 10 cm yr−1, stiff lithosphere), shear heating could lead to temperature increases close to 590°C at the Moho, and 475 °C at 20 km depth. For more common cases, shear heating leads to smaller temperature increases, but can still explain high-grade metamorphic conditions encountered in strike-slip shear zones. However, modelled temperature conditions often fall short of those observed. This could be due to heat transport by mechanisms more efficient than conduction. Common syntectonic emplacement of granitic melts in ductile strike-slip shear zones can be explained by lower crust partial melting induced by shear heating in the upper mantle. Besides slip rate, the possibility of such melting depends mostly on the upper mantle rheology and on the fertility of the lower crust: for hard upper mantle and highly fertile lower crust, partial melting could occur at rates of 1 cm yr−1, while in most cases it would result from the breakdown of micas for slip rates over 3 cm yr−1. As a result of shear heating, partial melting of the upper mantle could occur in the presence of small amounts of fluids. Rise of magmas and/or hot fluids in the shear zone will further enhance the temperature increase in shallower parts of the fault zone. In nature, shear heating would inevitably cause strain localization in the deeper parts of strike-slip faults, as is often observed in the field for crustal shear zones.
Key words: crustal deformation, fault models, finite difference methods, heat flow, lithospheric deformation, tectonics.
Nicolas et al. 1977) and by some geophysicists (e.g. Scholz 1980; 1 I N T R O D U C T I O N
Barr & Dahlen 1989; Molnar & England 1990), theoretical calculations suggest that it is unlikely to be of prime importance Prograde metamorphism is due to temperature increase
(Brun & Cobbold 1980; Fleitout & Froidevaux 1980). Indeed, resulting from four main possible causes: deep burial of rocks,
when a rock produces heat by friction, it necessarily becomes rise of regional or local heat flow, thickening of
radioactive-warmer and softer, a phenomenon that buffers the heat rich crust, and shear heating. Most metamorphic rocks crop
production. out in collision belts where all these processes may have
In this debate, metamorphism associated with major strike-acted together, making the importance of each one difficult to
slip faults is of particular interest, as burial of rocks, heat-flow decipher. In particular, the efficiency of shear heating (or strain
regional increase, and crustal thickening are limited for such heating) is a subject of debate. While shear heating has long
been considered a major heat source by field geologists (e.g. faults. Field observations along continental strike-slip shear
zones have provided direct evidence of high temperatures vertical strike-slip fault and resulting temperatures in a section perpendicular to the fault. We choose to calculate steady-state and/or partial melting at moderate depth (e.g. Nicolas et al.
1977; Scholz et al. 1979; Leloup & Kienast 1993; Tommasi solutions for two reasons. First, computation of time-dependent solutions would require the precise knowledge of the whole et al. 1994; Leloup et al. 1995). These observations raise the
question of whether strike-slip shear zones only channel hot kinematic history of each fault, which is never the case. Second, in the crust and along the fault, steady state is rapidly reached fluids and/or plutons produced by an external heat source, or
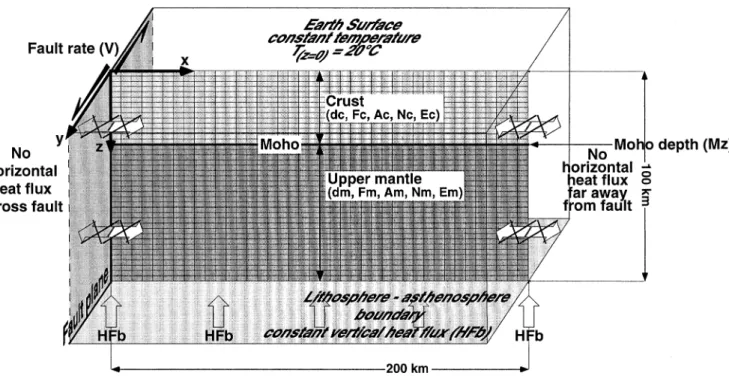
if they can produce enough heat by friction to raise temper- (after some millions of years, see Section 2.3.3). The fault is vertical, infinitely long and strikes parallel to the y-axis (Fig. 1). atures substantially and generate in situ magmas. Previous
quantitative estimates of shear heating along strike-slip faults Motion is purely horizontal. Because shear heating is sym-metrical with respect to the fault and because all variables led to the conclusion that shear heating could not usually
increase temperature by more than 200°C, nor provoke partial (conductivity, rock rheology, radioactive heat production, etc.) are constant at a given depth, we solve the problem in melting unless in layered structures with contrasted rheology
(Fleitout & Froidevaux 1980). As the lithosphere is funda- the xz-plane on one side of the fault only (Fig. 1). The left, the upper and the lower limits of the grid correspond to the fault, mentally composed of two such layers (crust and upper mantle),
Ricard, Froidevaux & Hermance (1983) developed a finite the earth surface and the lithosphere/asthenosphere boundary, respectively. Mohorovicic discontinuity (Moho) is represented difference model with a quartzitic crust and an olivine-rich
upper mantle to evaluate shear heating along a translitho- by a horizontal boundary at depth M
z, which separates rocks of contrasting rheologies (Fig. 1). Our two main assumptions spheric strike-slip fault. The aim of the present paper is to
explore the influence of various parameters on the temperature are that (1) the fault rate is constant and a thermal steady state is reached, and (2) all the mechanical energy is dissipated produced by shear in an updated version of this model. These
parameters are the lithospheric thermal conductivity, the fault by heat. Most calculations were performed on a grid containing 40×40 (1600) elements, each 5 km wide and 2.5 km high slip rate, the rock rheologies, the basal heat flow, the
radio-active heat production and the Moho depth. The main charac- (Fig. 1).
We tested two distinct numerical models. The first one teristic of our model is to consider shear heating in the whole
lithosphere, for both brittle and ductile deformations. Our final should give a more precise solution, as it does not postulate any other assumption than (1) and (2) above, solving eqs (4), goal is to estimate what plausible maximum temperatures can
be reached and to compare these results with metamorphic (5), (7) and (11) mentioned below. However, in this case, the depth of the brittle/ductile transition (z b/d) was arbitrarily conditions observed along major strike-slip shear zones.
fixed before calculation. The second model is a simplified one, where we consider deformation, and hence shear heating, 2 N U M E R I C A L M O D E L
only on vertical planes parallel to the main fault, thus solving eqs (6), (8) and (11) given below. In this second case, the depth 2.1 Calculation procedure
of the brittle/ductile transition is calculated during the iterative process that leads to the final solution. Each iteration is divided Following Ricard et al. (1983) we use 2-D steady-state numerical
models that calculate the heat production by shear along a into three successive steps.
Figure 1. Numerical model characteristics. Abbreviations are detailed in Table 1. See text for details.
Figure 2. Vertical variations of temperature and shear stress along the fault for reference parameters ( bold numbers in Table 1). (a) Temperature profiles before and during shearing, and
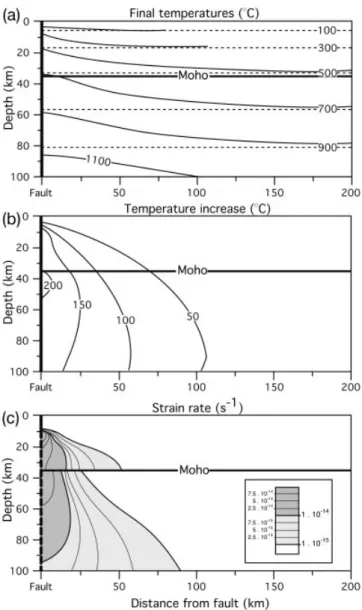
correspond-ing temperature increase. ( b) Shear-stress profile durcorrespond-ing shearcorrespond-ing in Figure 3. Temperatures, strain rates and frictional heat production the case of shear heating (continuous line) and no shear heating for reference parameters (bold numbers in Table 1) in a vertical half-(long-dashed line). The peak in shear stress is located either in the space perpendicular to the fault. (a) Isotherms during shearing (continuous last grid element above, or in the first below, the brittle/ductile lines) compared to initial ones (dashed lines). ( b) Temperature increase
transition. due to shear heating. Note that temperatures mostly increase along
the fault near the brittle/ductile transition and in the upper mantle. (c) Shear strain in ductile layers.
(1) Given ‘initial’ temperatures, a strength profile is calcu-lated: at a given depth, the deformation mechanism (brittle or
a normal geotherm computed without shear heating (Fig. 2a). ductile) is assumed to be the one for which the shear stress on
Basic formulae used for calculation are detailed in the following the fault is the lowest.
paragraphs. (2) When the depth of the brittle/ductile transition has been
The differences between the full and simplified solutions determined, shear heating is calculated as a function of depth,
are discussed in Appendix A. As the predicted temperature applying a friction law for the brittle part of the fault and a
increases near the fault differ by less than 10 per cent and final power-flow law for its ductile part.
temperatures by less than 5 per cent, we present in this paper (3) Knowing both this frictional heat production and the
simplified solutions, where the depth of the brittle/ductile radiogenic heat production, the heat diffusion equation is
transition is calculated, not imposed. solved to calculate ‘new’ temperatures.
We iterate these three steps until temperatures do not
2.2 Boundary conditions and parameters evolve significantly between successive calculations, implying
that a steady-state solution has been found. Vertical profiles of As the fault is strike slip, there is no vertical motion. Horizontal motion of velocity V /2 along the y-axis is imposed on the right temperature, temperature increase and shear stress are drawn
(Fig. 2), together with ‘maps’ of temperatures and temperature side of the computation box and in the brittle layer, while the fault itself stays fixed. The resultant initial velocity field increases in vertical cross-sections perpendicular to the fault
(Fig. 3). Temperature increases are calculated with respect to consists of two rigid blocks separated by the fault in the brittle
layer (relative velocity on the fault is V ), and a continuous where F is the friction coefficient, and t
bandsn are the shear velocity field in the ductile layer (total relative velocity between and normal stresses, respectively.sn is assumed to be close to boundaries is V ). At large depth, the horizontal velocity becomes lithostatic stress.tb thus increases with depth as a function of a function of x only (∂v/∂z=0 is imposed at z=100 km). After the weight of the overlying rocks.
calculation, ductile deformation is mostly localized in a shear At a depth z, zone, with a half-width of less than 25 km (see below). Such
localization is achieved more quickly if an initial Gaussian-shaped
tb(z)=Fg
P
z 0r(u) du , (2)
temperature perturbation, of a few tenths of a degree, is imposed
in the initial temperature distribution. Such boundary conditions where g is the gravity acceleration ( g#9.8 m s−2) and r(z) the imply that far-field forces of plate-tectonic type (generated
depth-dependent density. outside the model box) are driving the fault kinematics.
On the other hand, in the viscous layer, the deformation is A constant temperature of 20°C is maintained at the top
a function of both x and z, and the shear stressest
xyandtyz boundary of the grid (earth’s surface, Figs 1, 2a and 3b). By
are non-zero: symmetry, horizontal heat flow across the fault is null (Fig. 1).
We assume that shear-heating effects are negligible more than ∂t xy ∂x +
∂tyz
∂z =0 . (3)
200 km away from the fault, implying that heat flow across a vertical boundary at x=200 km is negligible (Fig. 1). Heat
Following experimental results, and thus assuming a non-flow at the base of the lithosphere (z=100 km) is constant and
linear law of deformation of the form e˙=AtN exp(−E/RT ) equal to HFb (Fig. 1).
between deviatoric stresses and strain rate (e.g. Weertman Besides HFb, 14 other parameters are fixed for each run
1978), one writes (Table 1). Three of these parameters define general
charac-teristics of the model: the fault slip rate (V ), the thermal ∂V
∂x=A(t2xy+t2yz)(N−1)/2txyexp(−E/RT ) (4) conductivity (K), and the Moho depth (M
z). Five parameters define the rheology of each layer. The density (r), and the
and friction coefficient (F) allow us to calculate the friction law
when the material is brittle. The pre-exponent constant (A), ∂V
∂z=A(t2xy+t2yz)(N−1)/2tyzexp(−E/RT ) . (5) the power-flow-law exponent (N), and the activation energy
(E) define a power-flow law when rocks deform ductilely (see
In the two previous equations, V is the velocity along the y-axis, below). The last parameter is the radioactive heat production
per unit time and volume (Q
r), which is depth-dependent. T the temperature, E the activation energy of ductile defor-mation, N the power-law exponent, A the pre-exponent con-stant, and R the universal gas constant (R=8.32 J mol−1 K−1). 2.3 Main governing equation
In the Appendix, we show how to solve these equations coupled with the equation of heat conservation.
2.3.1 Strength profile
It seems obvious, however, that the mechanical behaviour Along the fault, in the brittle zone, it is assumed that the is dominated by shear on vertical planes parallel to the main Coulomb criterion for failure is reached:
fault (txy≠0) rather than by shear on the horizontal plane (tyz#0). In this case, by integration of (4) one derives the
tb#Fsn , (1)
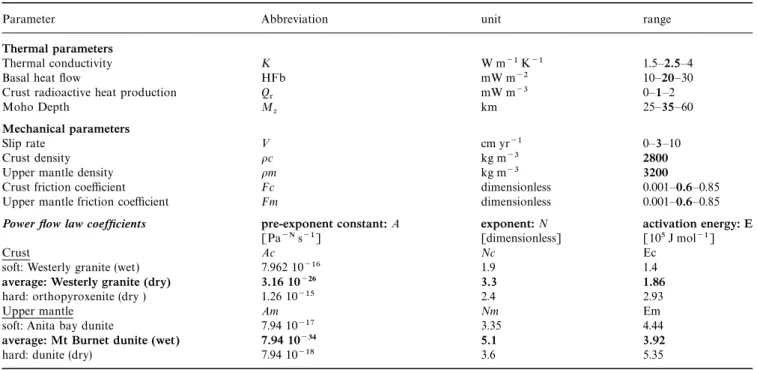
Table 1. Thermal and mechanical parameters.
Parameter Abbreviation unit range
Thermal parameters
Thermal conductivity K W m−1 K−1 1.5–2.5–4
Basal heat flow HFb mW m−2 10–20–30
Crust radioactive heat production Q
r mW m−3 0–1–2 Moho Depth M z km 25–35–60 Mechanical parameters Slip rate V cm yr−1 0–3–10 Crust density rc kg m−3 2800
Upper mantle density rm kg m−3 3200
Crust friction coefficient Fc dimensionless 0.001–0.6–0.85
Upper mantle friction coefficient Fm dimensionless 0.001–0.6–0.85
Power flow law coefficients pre-exponent constant: A exponent: N activation energy: E
[Pa−N s−1] [dimensionless] [105 J mol−1]
Crust Ac Nc Ec
soft: Westerly granite (wet) 7.962 10−16 1.9 1.4
average: Westerly granite (dry) 3.16 10−26 3.3 1.86
hard: orthopyroxenite (dry ) 1.26 10−15 2.4 2.93
Upper mantle Am Nm Em
soft: Anita bay dunite 7.94 10−17 3.35 4.44
average: Mt Burnet dunite (wet) 7.94 10−34 5.1 3.92
hard: dunite (dry) 7.94 10−18 3.6 5.35
simplified equation
2.3.3 Heat diVusion
If the thermal conductivity is everywhere given by K, the td(z)=txy=
A
VN
2P
2 0 expA
− E RT (u, z)B
duB
1/N . (6)steady-state heat conduction is
The errors introduced by this approximation are discussed in V2T +Qf+Qr
K =0 . (11)
the Appendix.
By plottingtd(z) and tb(z) as a function of depth, one obtains We approximate (11) by a finite difference method, calculating a lithospheric strength profile (Fig. 2b). At a given depth, the the ‘new’ temperature at any point of the grid as a function of ‘old’ temperatures at the four neighbouring points and of the relevant deformation mechanism is the one for which the shear
local heat production. The solution is considered to be stable stress is minimum (e.g. Goetze & Evans 1979; Brace &
when an iteration does not change the temperature of any Kohlstedt 1980).
nodes of the grid by more than 10−3 °C.
Heat production by shear is maximum along the fault where shear stress is maximum: at the brittle/ductile transition 2.3.2 Heat production
(10–20 km deep) and in the uppermost mantle (Fig. 2b). A One of the two basic assumptions of the model is that all simple heat diffusion scaling of the form d=2√kt (t being the mechanical energy is dissipated in heat (Joule 1850). The heat timescale necessary for heat to diffuse to a distance d from the produced by shear per unit time and volume (Q in [W m−3]) heat source, andk being the lithosphere thermal diffusivity of is simply given by #1 10−6 m2 s−1) indicates that, near the fault, heat produced by shear diffuses through the crust in less than 4 Myr. The steady regime is in fact reached even more quickly, as the shear Qf=txy∂V
∂x+tyz ∂V
∂z. (7) stress, and hence heat production, is greater at the beginning of deformation when temperatures are lower. Far from the Here again, as discussed in the Appendix, we assume that most fault zone and in the lower part of the lithosphere, where no of the heat is produced by shear heating along vertical planes. heat is produced, the temperature changes slowly by diffusion. Eq. (7) simplifies to In these regions, however, temperature changes are so small that metamorphism does not take place and field observations cannot constrain our modelling. In agreement with 1-D models Q
f=txy ∂V
∂x. (8) (Fleitout & Froidevaux 1980), steady-state temperatures close to the fault, in the crust and in the upper mantle, will be If td(z)>tb(z) we assume that rocks deform brittlely. Heat reached after only a few million years of strike-slip faulting at production is localized along the fault plane (first column of a constant rate.
the grid) and only half of this heat diffuses in each side. Therefore (8) becomes
2.4 Parameter values
As many parameters (at least 15) are involved in our calcu-Qf(x=0,z)=tb(z)V
2l, (9) lations, we decided to choose for each one a possible range of variation and a reference value (Table 1). This reference where l is the width along the x-axis of the considered unit cell. corresponds to the a priori most plausible values inferred from If td(z)<tb(z) rocks deform ductilely and heat is produced our knowledge of the lithosphere and of large continental wherever the deformation takes place. Consequently, (8) leads strike-slip faults. In this way, we can explore the influence of to each parameter individually: except for the one under investi-gation, all parameters are fixed to their reference values. Q
f(x,z)=AtN+1d(z) exp(−E/RT(x,z)) . (10) Thermal conductivity, basal heat flow, radiogenic heating, and Moho depth influence the temperature structure of the litho-Although no localization of deformation is imposed within sphere both before and during shearing: these will be referred the ductile shear zone, steady-state solutions show a strong to as thermal parameters as opposed to the mechanical ones localization of deformation and heat production. In the ductile (slip rate, friction coefficient and power law parameters) that shear zone, strain rates are maximum below the brittle fault are only important when motion takes place along the fault. and decrease by one order of magnitude in a zone of
half-width #20 km (Fig. 3c). Such strain localization in the ductile
3 RE S U LT S layer is explained by shear heating: a slight temperature
increase, for example due to the proximity of localized brittle
3.1 Reference model: a plausible lithospheric fault model deformation, leads to higher strain rates inducing more shear
heating that contributes to raising the temperature even further. In the reference model all parameters are set to their reference Consequently, maximum ductile shear heating takes place in value (Table 1). The crust is 35 km thick, with a homogeneous the centre of the shear zone and becomes negligible less than radioactivity of 1 mW m−3, a friction coefficient of 0.6 and the 80 km away from the fault. power-flow law of dry Westerly granite (Hansen & Carter Heat is also produced by radioactive decay in an amount 1983). Mantle rocks do not show any radioactivity and have Q
r(z) defined by a radioactive heat production profile chosen the rheology of wet Mt Burnet dunite (Post 1977). Thermal conductivity is set to 2.5 W m−1 K−1, and basal heat flow to for each run.
20 mW m−2. These parameters lead to a normal geotherm temperatures (930°C at the Moho) (Fig. 4). Extreme values of where the Moho is at 534°C (Fig. 2a), and a surface heat flow conductivity lead to thermal structures before shearing that of 53 mW m−2 (Fig. 2c). After motion on the fault at a rate are not realistic. Indeed, a value of K=4 W m−1 K−1 would of 3 cm yr−1 and consequent shear heating, isotherms are imply that low greenschist metamorphism would be barely perturbed and temperature substantially increases close to the attained in the lower crust, while for K=1.5 W m−1 K−1 fault (Fig. 3a). For example, the temperature at the Moho the whole lower crust would be at temperatures compatible reaches 735°C in the fault zone, while it remains at 534 °C far with partial melting. Average lithospheric conductivity thus from it (Figs 2a and 3a). Surface heat flow on the fault trace probably lies between 2 and 3 W m−1 K−1.
reaches 109 mW m−2 (Fig. 6d). Temperature mostly increases at two depths: in the crust at the brittle/ductile transition
(+176 °C, #10 km depth), and in the mantle just below the 3.2.2 Radiogenic heating and basal heat flow Moho discontinuity (+208 °C) (Fig. 3b). These zones
corre-Radioactive heat production decreases with depth in the crust spond to places where shear stress is maximum (Fig. 2b).
and is negligible in the mantle, although various radioactive Ductile deformation is localized below the main brittle fault.
heat production profiles appear consistent with the observed In the crust, the maximum strain rate is 9×10⁻¹⁴ s−1, in the
surface heat flow (e.g. Chapman & Furlong 1991). Radioactive shear-zone centre, just below the brittle/ductile transition
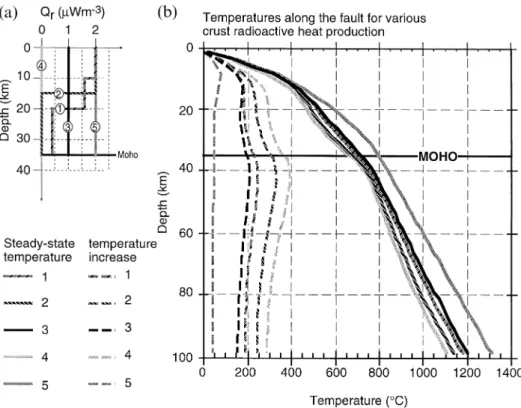
(Fig. 3c). Strain rates decrease by one order of magnitude less heat production in amphibolite facies rocks representative of than 25 km from the left boundary of the grid. The higher the middle crust and in granulites of the lower crust is between strain rates (>10−14 s−1), typical of geological deformation rates, 1 and 1.6 mW m−3, and between 0.4 and 0.45 mW m−3, define a vertical shear zone affecting the whole lithosphere. respectively (e.g. Pinet et al. 1991). A model with heat pro-duction values of 2 mW m−3 in the upper 10 km, 1.6 mW m−3 from 10 to 20 km and 0.4 mW m−3 for the lower crust is 3.2 Variations of thermal parameters
thus probably realistic (model 1, Fig. 5). In an attempt to simplify this crust profile we tested two alternative models: a 3.2.1 L ithospheric average thermal conductivity
single radioactive layer 15 km thick in which Q
r=2 mW m−3 Average conductivity for the whole crust probably ranges (model 2, Fig. 5) (England & Thompson 1984); and a homo-between 1.5 and 3 W m−1 K−1 (England & Thompson 1984). geneous crustal heat production of 1 mW m−3 (model 3, Fig. 5). Conductivity of the lithospheric mantle is usually assumed to The choice of one of these models is not critical for the final be equal to 3 W m−1 K−1 (Pinet et al. 1991; Gaudemer et al. temperatures reached along the fault, but has repercussions 1988). We decided to take 2.5 W m−1 K−1 as the reference for the importance of shear heating (Fig. 5b). We chose model value for lithospheric heat conductivity and to test variations 3 as our reference heat production profile because it is simple of this parameter between 1 and 4 W m−1 K−1 (Table 1). and leads to temperatures that do not differ more than
Such variations significantly change the model by affecting 10 per cent from model 1 (Fig. 5).
the initial thermal structure of the lithosphere. For high thermal If the crustal radioactive heat production is zero, the shear-conductivities, initial temperatures are very low (for example
heating effect is very important and the temperature increases 340°C at the Moho for K=4 W m−1 K−1), and the
shear-by nearly 400°C at the Moho (model 4, Fig. 5b). A uniform heating effect is important (+320 °C), leading to moderate
radioactive heat production set to 2 mW m−3 would produce final temperatures (660°C at the Moho) (Fig. 4). On the other
nearly no shear-heating effect (model 5, Fig. 5b). These results hand, a low thermal conductivity induces high initial
temper-mean that a cooler lithosphere before shearing induces a larger atures (880°C at the Moho for K=1.5 W m−1 K−1), and then
temperature increase by shear heating, but finally reaches a small shear heating effect (+50 °C) and very high final
temperatures very close from those attained from hotter initial conditions.
Sclater et al. (1980) estimated the basal heat flow below continents to be between 17 and 31 mW m−2. A detailed study of the Canadian and Scandinavian shields led Pinet and co-workers to estimate a basal heat flow as low as #10 mW m−2 under cratons (Pinet & Jaupart 1987; Pinet et al. 1991). This basal heat flow is higher in thinned areas and probably in young orogenic areas. We choose HFb= 20 mW m−2 as our reference value with variations between 10 and 30 mW m−2 (Table 1). A basal heat flow of 20 mW m−2, together with a uniform crustal radioactive heat production of 1 mW m−3, gives a surface heat flow of 53 mW m−2, typical for continents.
A high basal heat flow obviously leads to high temperatures in the crust (Fig. 6a). But, as is the case for radioactivity, shear heating decreases sharply with increasing initial temperature, buffering final temperatures. Crustal temperatures along the
Figure 4. Influence of thermal conductivity on Moho initial
temper-fault after shearing do not vary by more than 100°C whatever
ature (Ti), temperature increase (dT) and final temperature (T) at
the basal heat flow (Fig. 6b) and for any radioactive heat
shear zone centre. All other parameters are set to their reference values
(see Table 1). production below 1.5 mW m−3 (Fig. 5b).
Figure 5. Influence of crustal radioactivity on thermal state. All other parameters are set to their reference values (see Table 1). (a) Proposed models for vertical distribution of radioactivity in crust. See text for details. (b) Temperature and temperature-increase profiles along the fault for proposed vertical distributions of radioactivity.
cold one. This buffering effect was expected from previous 3.2.3 Moho depth
calculations (Yuen et al. 1978; Fleitout & Froidevaux 1980; Brun & Cobbold 1980; Thatcher & England 1998).
The Moho depth (M
z) influences the thermal structure as it fixes the thickness of the radioactive crust and the depth of the rheological limit (Fig. 7a). Surprisingly, when M
z varies 3.3 Variations of mechanical parameters between 20 and 45 km, the final temperature does not vary
much (Fig. 7b). When the crust is thin (i.e. M
z=20 km) these 3.3.1 Slip rate final temperatures are mostly due to shear heating, while in
the case of a thick crust (i.e. M
z=45 km) they are mostly due The slip rate on the fault (V ) determines the deformation rate, the shear stress profile, and consequently the heat production to radioactivity. The corresponding surface heat flows are
nearly constant over the fault: #110 mW m−2. by shearing. As we assume steady state, our model is appro-priate only for faults that maintain a nearly constant slip rate In a single-layer model (i.e. without the Moho discontinuity)
the thermal structure of the lithosphere changes radically because for several million years. As we also assume that the fault separates two blocks of similar thermal state, our model is heat production is restricted near the brittle/ductile transition.
A single-layer model, with the power-law flow of the crust, better adapted for continent/continent transform faults or intracontinental strike-slip faults. Important intracontinental and a heat production of 1 mW m−3 in the upper 35 km, leads
to much lower temperatures in the lower crust, and a surface strike-slip faults currently exhibit strike-slip rates of several centimetres per year for several million years (e.g. #3.5 cm yr−1 heat flow (105 mW m−2) comparable to that of the reference
model. For this single-layer model, the temperature increase for the Altyn Tagh fault, Tapponnier et al. 1986).
Assuming that 10 cm yr−1 is the maximum plausible rate at 35 km depth is only+80 °C (final temperature 615 °C), as
compared with +200 °C (final temperature 735 °C) for the that could be maintained during several million years, we tested rates between 0 and 10 cm yr−1. In this range, the final two-layer reference model. This illustrates the importance of a
stiff upper mantle to reach high temperatures in the lower temperatures significantly increase with the slip rate (Fig. 8a). This increase is not linear and is better fitted by a second-crust (Fleitout & Froidevaux 1980). On the other hand, a
single-layer model, with the power-law flow of the upper order polynomial: a buffering effect induces the final temper-atures to saturate at high slip rates (Fig. 8a). However, for mantle, shows substantial shear heating at the brittle/ductile
transition: at 15 km depth, the temperature increases by 485°C common rates, lower than 6 cm yr−1, final temperatures on the fault can be approximately fitted by a linear relationship, and reaches 628°C. Below this transition, the shear-heating
effect decreases sharply, and, below 40 km depth, final temper- the increase of temperature being of the order of 50°C cm−1 yr (Fig. 8a). Slip rate also influences the depth of the brittle/ atures become lower than those of the reference model. The
corresponding surface heat flow over the fault is 125 mW m−2. ductile transition: if the slip rate increases, the depth of the brittle/ductile transition decreases following approximately a Variations of the thermal parameters shows that shear
heating is much lower in an initially hot lithosphere than in a second-order polynomial (Fig. 8c). Similarly, the surface heat
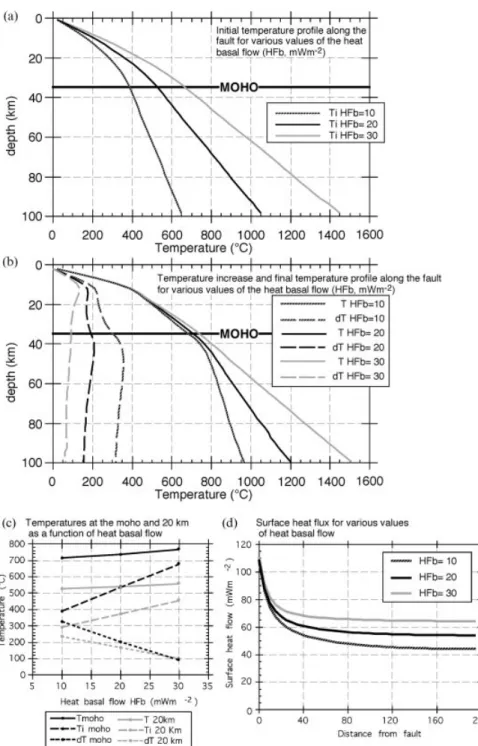
Figure 6. Influence of basal heat flow ( HFb) on the thermal structure of lithosphere before and during shearing. All other parameters are set to their reference values (see Table 1). (a) Vertical profile along the fault of initial temperature (Ti) for heat basal flow (HFb)=10, 20 and 30 mW m−2. ( b) Vertical profile along the fault of temperature increase (dT ) and final temperature (T) for heat basal flow (HFb)=10, 20 and 30 mW m−2. (c) Initial temperature, temperature increase, and final temperature on the fault, at the Moho and at 20 km depth, as a function of HFb. (d) Surface heat flow, along a line perpendicular to the fault, for heat basal flow (HFb)=10, 20 and 30 mW m−2.
flow above the fault increases with the slip rate, following the Byerlee’s value as an upper limit for frictional resistance in a fault zone, we tested values of F between 0.01 and 0.85 same type of relationship (Fig. 8d).
(0.6 being the reference value—see Table 1).
The friction coefficient fixes the slope of the brittle part of 3.3.2 Friction coeYcient
the strength profile and the associated heat production by shearing. However, as the upper mantle only exhibits brittle At sample scale, for most crustal rocks, the friction coefficient
(F) has a value between 0.85 and 0.6 depending on the level deformations for very small friction coefficients (F#0.1, Figs 9c and d), final temperatures in the mantle and the lower of normal stress (Byerlee 1978). In a large-scale fault zone,
however, the effective friction coefficient probably depends on crust are nearly constant whatever the friction coefficient is (700±25 °C at the Moho, Fig. 9b). The only exception is for the level of crushing, lubrication and fluid pressure. Taking
coefficient: for reference parameters it reaches 118 mW m−2 for F=0.85 (Fig. 9e). The brittle/ductile transition deepens with decreasing friction coefficient, particularly for values of F below 0.2 (Fig. 9d). Along the San Andreas fault and the Alpine fault in New Zealand, earthquake focal depths extend to 15 and 20 km, respectively (Chen & Molnar 1983). As a first approximation, such depths for the brittle/ductile transition would correspond to low friction coefficients between 0.05 and 0.3 (Figs 8c and 9d) and surface heat flows from 92 to 70 mW m−2 (compared with 53 mW m−2 before shearing, Fig. 9e). Alternatively, if there is no shear heating along the fault, these depths would correspond to higher friction coefficients (F>0.2), (Fig. 9d) and much higher peak shear stresses (Fig. 2b).
3.3.3 Power-law coeYcients
Besides slip rate, ductile shear heating is determined by the power-flow law used. Using a review of power laws of natural rocks (Carter & Tsenn 1987), we tested three of them for each layer (crust and mantle): the hardest, the softest and an intermediate one. Power-flow laws of dry orthopyroxenite (Raleigh et al. 1971), dry Westerly granite (Hansen & Carter 1983) and wet Westerly granite (Hansen & Carter 1983) are used for ‘hard’, ‘average’ and ‘soft’ crust, respectively, while those of dry dunite (Chopra & Paterson 1984), wet Mt Burnet Dunite (Post 1977) and wet Anita bay dunite (Chopra & Paterson 1981) are used for ‘hard’, ‘average’ and ‘soft’ mantle, respectively (Table 1). ‘Hard’ rheologies induce a much more efficient shear heating, particularly in the middle crust. At 20 km deep, a hard crust is 190°C hotter than a soft crust (Fig. 10). In the lower crust, hard mantle and soft mantle lead to temperatures at the Moho of 845°C and 693 °C, respectively (Fig. 10).
3.4 Maximum plausible shear heating along a translithospheric strike-slip fault.
Given the above results, it is possible to determine which para-meter values lead to maximum shear heating: a fast slipping fault (V=10 cm yr−1) with a high friction coefficient (F=0.6), affecting an initially cold lithosphere (HFb=10 mW m−2, K=2.5 W m−1 K−1, radioactive heat production profile 1)
Figure 7. Influence of crustal thickness (Mz) on thermal and
mech-composed of hard crust and mantle. A run with these
anical structure of lithosphere before and during shearing. All other
values leads to very high final temperatures of 933°C at the
parameters are set to their reference values (see Table 1). In all cases,
Moho (temperature increase of 587°C), and 743 °C at 20 km
vertical profiles along the fault are shown for M
z=20, 35 and 45 km. (temperature increase of 474°C). This probably corresponds (a) Shear-stress profile along the fault. (b) Initial temperature (Ti).
to the absolute maximum shear-heating effect that one could
(c) Temperature increase (dT ) and final temperature (T).
expect along translithospheric strike-slip faults. This level of shear heating is much higher than expected from previous studies and would eventually induce P–T conditions compatible extremely low friction coefficients (e.g. F=0.01), which result
with partial fusion of granitic rocks at 10 km depth. in a brittle behaviour of most of the lithosphere, small shear
heating and a final temperature at the Moho of only 600°C (Figs 9a and b). However, such deep brittle deformation, down
4 D I S C U S S I O N : C O U L D H I G H H E AT to 65 km (Figs 9c and d), is incompatible with the fact that
F L O W O B S E R V E D I N L I T H O S P H E R I C seismicity along continental strike-slip faults is restricted in
S H E A R Z O N E S R E S U LT F R O M S H E A R the crust (e.g. Chen & Molnar 1983).
H E AT I N G ? Changes of the friction coefficient have a much greater effect
in the upper crust, significantly changing the final temperatures, Observations of thermal state along major long-lasting strike-slip faults can be compared with calculations, thus the depth of the brittle/ductile transition, and the surface heat
flow (Figs 8 and 9). Surface heat flow increases with friction allowing discussion of the basic assumptions of our model.
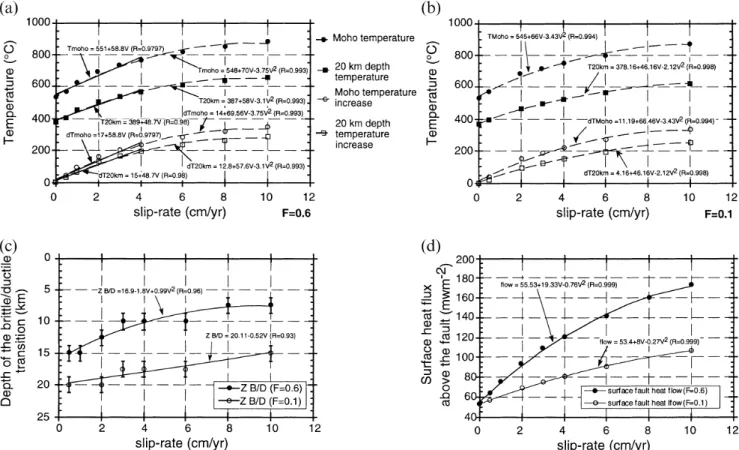
Figure 8. Influence of fault slip rate (V ) on the thermal and mechanical state of lithosphere. (a) and ( b) Temperature and temperature increase at 20 km depth and 35 km depth (Moho) as a function of slip rate. Dashed lines are fits by a second-order polynomial, straight solid lines are linear fits for slip rates up to 4 cm year−1. In (a) F=0.6 while in (b) F=0.1. All other parameters but slip rate are set to their reference values (see Table 1). (c) Depth of brittle/ductile transition as a function of slip rate for F=0.6 and F=0.1. Solid lines correspond to a second-order polynomial fit to the data. Error bars indicate uncertainty corresponding to the spacing of the calculation grid. (d) Surface heat flow above the fault as a function of slip rate for F=0.6 and F=0.1. Solid lines correspond to a second-order polynomial fit to the data.
Unfortunately, the thermal states of major active strike-slip takes place in a broad zone with several surface strike-slip fault strands, and with no heat-flow anomaly (Fig. 19 of faults are not well known, the best documented being that of
the San Andreas fault zone. Lachenbruch & Sass 1980). North of 35°N, where deformation is localized along one main fault strand, there is a large-scale, #80 km wide, heat-flow anomaly—the Coast Ranges anomaly 4.1 Thermal state of the active North America/Pacific
(Lachenbruch & Sass 1980) (Fig. 11a). In this area, heat flows transform boundary
are between 50 and 100 mW m−2 near the fault, and drop to 42–55 mW m−2 80 km farther east. Along strike, the Coast The absence of a localized heat-flow anomaly associated with
the present-day San Andreas fault trace (Lachenbruch & Sass Ranges heat-flow anomaly decreases towards the north and finally vanishes at the Mendocino triple junction (Fig. 12 of 1980) has been taken as evidence for low shear stress and/or
the absence of shear heating along major strike-slip faults. Lachenbruch & Sass 1980). The heat-flow anomaly is thus clearly associated with the fault zone.
However, the San Andreas fault zone has a complex history,
which should be taken into account. Since the onset of the Some authors have attempted to explain this anomaly by the effect of the northward migration of the Mendocino subduction of the Farallon–Pacific ridge below North America,
at approximately 30 Ma, the transform boundary between triple junction, without a contribution from shear heating (e.g. Dickinson 1981; Zandt & Furlong 1982). In this case, a North America and the Pacific has been a lengthening
right-lateral fault zone linking two triple junctions that migrate in good fit to the observed anomaly is only obtained for extreme conditions, such as the opening of a lithospheric gap and opposite directions (Atwater & Molnar 1973). Within this
broad zone, the main fault has jumped eastwards several times upwelling of the asthenosphere along the triple-junction path (e.g. Lachenbruch & Sass 1980). On the other hand, shear-(e.g. Dickinson 1981) and coincides with the San Andreas fault
only since 7.5–5 Ma (Dickinson & Snyder 1979). Thus, the heating models have been proposed for the San Andreas fault, and seem to explain the main heat-flow characteristics thermal state of the San Andreas zone probably results from
various processes: subduction, opening of an asthenospheric satisfactorily. Using a previous version of the model presented in this paper, Ricard et al. (1983) obtain a better fit of the window, and progressive eastward migration of the strike–slip
boundary. along-strike shape of the heat-flow anomaly than if shear heating is neglected, but with a modelled across-strike anomaly In the area south of #35°N, below which the Farallon–
Pacific ridge subducted, the present-day transform motion narrower than observed. Thatcher & England (1998) also
Figure 9. (Continued.)
heating on slip rate rests upon their choice of an over-simplified Newtonian rheology for earth materials, in contradiction with most experimental results.
The total displacement of Tertiary markers on the presently
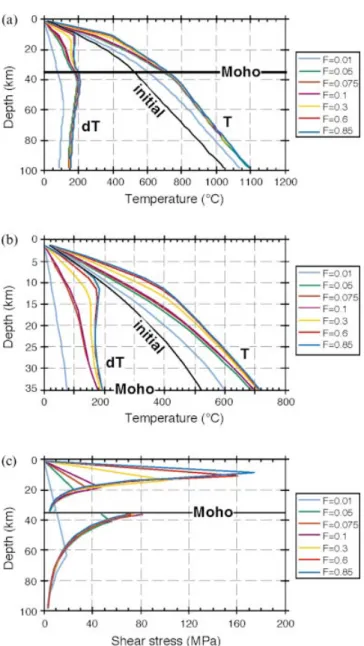
Figure 9. Influence of the friction coefficient on lithospheric
thermo-active fault strand is close to 300 km (Irwin 1990), mostly
mechanical structure during shearing. The friction coefficient is the
accumulated since 7.5 Ma (Dickinson & Snyder 1979). This
same in the crust and upper mantle. All other parameters are fixed to
implies an average rate of #4 cm yr−1, close to the rate of
their reference value (see Table 1). (a) Lithospheric vertical profile
#3.5 cm yr−1 deduced from offset Holocene markers (Sieh &
along the fault of final temperature (T) and temperature increase (dT)
for friction coefficients between 0.01 and 0.85. (b) Crustal vertical Jahns 1984). A run of our model assuming a crustal thickness
profile along the fault of final temperature (T) and temperature increase of 25 km (Gary & Mooney 1990), a radioactivity decreasing
(dT ) for friction coefficients between 0.01 and 0.85. (c) Lithospheric with depth, and a basal heat flow of 20 mW m−2 leads to a strength profile for friction coefficients between 0.01 and 0.85. (d) Depth surface heat flow before shearing of 48 mW m−2, compatible of brittle/ductile transition as a function of friction coefficient. Reported with what is observed out of the fault zone (35–55 mW m−2, depths correspond to the base of the deeper brittle element. Box heights
Fig. 11a). After shearing at a rate of 4 cm yr−1, using the
indicate uncertainty corresponding to the spacing of the calculation
reference rheologies and a low friction coefficient (F=0.2),
grid. Dark and light shading represents runs with and without shear
the surface heat flow above the fault rises to 87 mW m−2, thus
heating, respectively. Note that brittle deformation occurs in the upper
approaching the intensity of the Coast Ranges heat-flow
mantle only for very small friction coefficients. (e) Surface heat flow,
anomaly (Fig. 11a). Along the San Andreas fault the base of
above the fault, as a function of friction coefficient.
the seismogenic layer is 10–15 km deep (Sibson 1984). This imposes the condition that F be smaller than 0.3. A friction coefficient smaller than 0.15 would lead to a brittle upper estimated that ductile shear heating in the lower crust or in
the upper mantle might explain the heat-flow amplitude, and mantle, which is not indicated by seismicity. If F is the same in the crust and in the mantle, it is therefore constrained that shear heating on minor faults could broaden the anomaly.
In their model, shear-heating intensity depends weakly on slip to be between 0.15 and 0.3. Such a small effective friction coefficient is in accord with the observation of principal rate, implying that even minor faults may induce strong heat
production. Note, however, that this weak dependence of shear horizontal compressive stresses being almost perpendicular
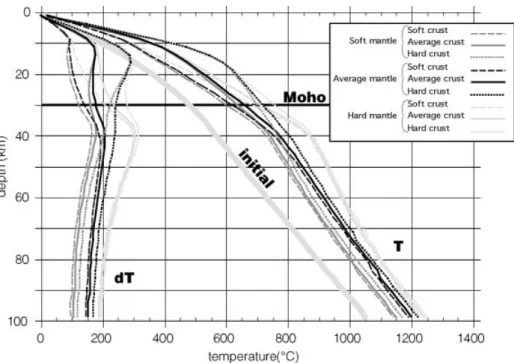
Figure 10. Influence of possible flow laws on lithospheric temperature structure along the fault during shearing. Hard, average and soft crust and mantle refer to various power-flow laws used: see text and Table 1 for details. Initial: geotherm before shearing; dT: temperature increase due to shear heating; T: final temperature.
to the fault zone (Zoback et al. 1987; Mount & Suppe 1987). are unfortunately not available east of the fault, where the coast range anomaly is better defined. However, the lack of For a friction coefficient of 0.2, maximum shear stresses in
the crust are #70 MPa (Fig. 11c). This corresponds to a hot springs east of the San Andreas fault seems to limit the importance of such phenomena, unless heat discharge occurs 4.7 MPa km−1 vertical shear-stress gradient to compare with
the #7.9 MPa km−1 measured near the San Andreas fault in in numerous springs at temperatures only slightly above the ambient. Obviously, heat-flow measurements do not provide wells up to 850 m deep (Mc Garr et al. 1982). In the absence
of shear heating, our calculations indicate a brittle upper enough constraints on the deep thermal structure of the fault zone to distinguish between these hypotheses. In any case, our mantle and a deep (≥20 km) crustal brittle/ductile transition,
even for very high friction coefficients (>0.6) that would model underestimates the thermal-anomaly width and thus probably the total heat production.
correspond to high crustal shear stresses (>325 MPa). However, notwithstanding that we take into account shear heating in the whole lithosphere, the modelled surface
heat-4.2 High-temperature metamorphism in exhumed flow anomaly vanishes less than 50 km from the fault (Fig. 11a).
strike-slip shear zones This is a much smaller distance than that observed (Lachenbruch
& Sass 1980). The broad measured anomaly has been inter- Large, exhumed strike-slip shear zones are listed in Table 2 with their main thermal characteristics. These shear zones preted as due to shear heating either on horizontal planes
(Lachenbruch & Sass 1980) or in a 80 km wide shear zone share two common features. First, down to the base of the crust (granulite facies), strike-slip deformation appears to be (England & Molnar 1991). Given the complex history of the
fault zone both hypotheses are plausible although clearly localized in mylonitic zones usually less than 25 km wide. Second, metamorphic peak temperatures are high in the fault ad hoc. The existence of a wide shear zone is in contradiction
with the fact that shear heating necessarily induces a progressive zones, and often lead to crustal partial melting.
We distinguish two main types of strike-slip faults: orogen-strain localization. It is possible that steady state is not yet
reached in California and that the upper mantle still deforms parallel and orogen-oblique. Orogen-parallel strike-slip faults that develop in the hanging walls of subduction zones (e.g. the over a wide zone. Alternatively, in our steady-state model,
temperature increase in the lower crust and upper mantle Sumatra fault, Fitch 1972), and in internal part of orogenic zones (e.g. the Insubric fault in the Alps, Lacassin 1989) result occurs in a wide zone. For example, at a depth of 20 km, the
temperature increases by 150°C 25 km away from the fault from slip partitioning between thrusting and strike-slip faulting. Together with shear heating, subduction and/or thickening (Fig. 11b). From such depths, hot fluids could migrate upwards,
thus increasing and widening the surface heat-flow anomaly. processes affect the thermal regime of such faults. This must be kept in mind during any comparison with geological data. In the upper crust, fluids could also migrate laterally along
pre-existing discontinuities (faults, bedding, etc.), broadening On the other hand, orogen-oblique strike-slip faults develop in most cases during indentation tectonics (e.g. Tapponnier the anomaly further. Supporting this idea, intense fluid
migration in the upper crust has been suggested west of the & Molnar 1976) and cut across contemporaneous thrusts and fold. The Altyn Tagh Fault of northern Tibet (e.g. Peltzer fault on the basis of high H
2O content, high d18O, and low
dD of granitoids (O’Neil & Hanks 1980). Such measurements et al. 1988) is a good example of a present-day cross-cutting
T able 2. Thermal regime in some strike-slip fault zones. Name location type length (L in km) timing (T ) Metamorphism synkinematic magmatism References width (w in km) strike-slip rate P– T estimates 87/86 Sr of granitoids offset (o in km) (r in cm /yr) shear sense (S ) Alpine fault – New Zealand South Plate boundary L # 600 km T: since # 36 Ma Low amphibolite some pegmatitic dykes? Sibson et al. Island $ orogen oblique inland r# 1 – 2.5 in the T: 490 – 540 °C (1979 ) – T ransform between in the Miocene w 1.5 km Miocene, # 3.5 with P: 5.4 – 6.6 kb? Grapes (1995 ) Pacific & Australia $ orogen-parallel o # 480 km compression Argon and Sr Scholz et al. since 10 – 5 Ma S: dextral since. Depletion (1979 ) Great Slave Lake – North W est T erritories Intracontinental L # 1300 km T # 2 – 1.9 Ga Granulite to greenshist synkinematic batholithe Ho ff man (1987 ) shear-zone Canada orogen-oblique w ≤ 25 km belt 1: 840 °C & 8.2 kb (c and Kf-cdiorite) Hanmer (1988 ) GSL sz – Boundary between the o # 300 – 700 km belt 2: 880 °C & 7.5 kb and migmatites. slave and Churchill S: dextral belt 3: 680 °C & 4 kb some late diabase dikes. provinces Ailao Shan –Red – SE Asia Intracontinental L ≥ 1000 km T: Oligo-Miocene, Amphibolite synkinematic leuco c layers Leloup et al. River – Boundary between orogen-oblique inland from # 40? to (P5kb-T700 °C ) and monzonitic bodies (1995 ) ASRR sz Indochina and South w # 20 km 16 Ma to greenshist (0.7071 to 0.7234 ) Scha ¨rer et al. China. o ≥ 700 ± 200 km r# 4± 1 (1994 ) S: sinistral Zhang (1995 ) Dom F eliciano belt – Southern Brazil –Uruguay Orogen-parallel L > 500 km T: Pan African prograde 2 generations: T ommasi et al . (Brazil ) – internal part of collision w ≤ 15 km metamorphism from 1 ) cdiorite-adamelites (1994 ) belt between Rio de la S: sinistral # 550 °Ct o # 675 °C (0.7163 ) plata & Kalahari # 425 °Ca t # 3 Kb 2 ) Sodi potassic to cratons peralcaline leuco c (0.7329 ) South American – South Brittany (F rance) Orogen-parallel L > 300 km T: Carboniferous triple point And-Sill-Ky Numerous and large 2 Jegouzo (1980 ) shear-zone – Separate central and w: 2 branches ?– 330 – 290? Ma (# T 450 °C, P micas leuco c resulting Strong & Hanmer SA sz Southern american hundreds m 4.5 kb) from anatexis (1981 ) domain wide separated to greenschist of the sediments. by a deformed 0.703 to 0.7102 (increase belt up to with time) 60 km wide. S: Dextral Coı ¨mbra–Badajoz – – Central Portugal & Orogen-parallel L > 400 km T: Upper granulite?–amphibolite – Numerous and large 2 Burg et al. (1981 ) Cordoba shear-Spain w # 20 km Carboniferous greenshist micas leucogranites zone S: sinistral Serra da F reita – Central Portugal Orogen-parallel L > 70 km T: Carboniferous amphibolite Large 2 micras Reavy et al. (1991 ) shear-zone w # 2 km (sillimanite) leucogranite 0.7136 S: sinistral
strike slip, with a rate of 1–2.5 cm yr−1 (e.g. Stock & Molnar 1987).
Close to the fault, the Mesozoic schistosity is transposed by a steeper one, parallel to the fault (e.g. Findlay 1987). This transposition corresponds to the formation of metamorphic isogrades parallel to the Alpine fault: metamorphism increases from phrenite-pumpellyite #14 km from the fault (#260°C and 4.2 kb) to garnet-oligoclase amphibolite facies within 6 km (e.g. Grapes 1995). Along the fault, in the K-feldspar zone, pressure–temperature conditions of metamorphism are in the range 5.4–6.6 Kb (20–24 km) and 490–540°C (Grapes 1995). K–Ar ages, which are Cretaceous (150–120 Ma) more than 25 km east of the fault (e.g. Harper & Landis 1967), show a progressive younging towards the fault, and become younger than 30 Ma less than 10 km from it (e.g. Adams & Gabites 1985; Sheppard et al. 1975). Fission-track ages follow the same trend, with no apatite age older than 35 Ma less than 40 km from the Alpine fault and no zircon age older than 10 Ma in the amphibolite zone (Kamp et al. 1989).
It is thus clear that, during the Cenozoic, the low-grade schists metamorphosed in the Mesozoic suffered a second prograde metamorphism coeval with strike-slip deformation along the Alpine fault. Shear heating is a very appealing mechanism to explain such a thermal event. Scholz et al. (1979) calculated that, if depth-averaged shear stress on the fault was in excess of 50 MPa, the temperature increase induced by shear heating could lead to argon degassing, explaining the observed age pattern. Our model confirms this calculation. The present-day crustal thickness far from the Alpine fault (#30 km; Woodward 1979) gives a lower bound for the crustal thickness in the Oligocene. At this time, the geotherm was thus probably close to our initial geotherm calculated for a crustal thick-ness of 35 km (Fig. 12). After strike-slip faulting at a rate of 2.5 cm yr−1, and for the reference parameters, our model
Figure 11. Shear-heating model applied to the San Andreas fault
indicates that temperatures close to 540°C are attained in the
between 35 and 40°N. Run executed with the following parameters:
shear zone at a depth of #23 km, in very good agreement
K=2.5 Wm−1 K−1, HFb=20 mW m−2, Qr(in mW m−3)=2 from 0
with the P–T estimates. This would imply at least #23 km of
to 7.5 km, 1.6 to 15 km, 0.4 to Moho, Mz=25 km, V=4 cm yr−1,
late Cenozoic uplift east of the Alpine fault at an average rate
Fc=0.1, Fm=0.1, average crust, average mantle. (a) Heat-flow
of #2.3 mm yr−1 in order to bring these high-temperature
measurements (regions 3, 4, 5 and 6 of Lachenbruch & Sass 1980)
plotted together with heat flow from model (continuous line) and an rocks to the surface. Such rates are compatible with the uplift
estimate of heat flow considering substantial heat advection in the rates of 2.6–7 mm yr−1 estimated for the last #340 000 years middle and upper crust (dashed line). The diagonal pattern shows the (Bull & Cooper 1986). Indeed, since #10 Ma, the relative heat-flow value outside the San Andreas fault zone. ( b) Temperature Australia/Pacific motion has been oblique to the Alpine fault increase in the lithosphere due to shear heating according to the model
(e.g. De Mets et al. 1990; Berryman et al. 1992; Wellman 1984),
(no heat advection). In the crust, a temperature increase of more than
thus inducing rapid uplift of the Southern Alps that fringe
100°C is restricted to within 50 km of the fault. (c) Corresponding
the fault to the SE. Such uplift has deformed the
meta-lithospheric shear-stress profile in the fault zone.
morphic isogrades formed previously during purely strike-slip deformation. Several authors thus explain the increase of metamorphism towards the fault by an increase of exhumation strike-slip fault. Far from the collision front, such faults affect
a mildly deformed lithosphere, and their characters may be rather than shear heating (e.g. Wellman 1979; Adams 1979). This hypothesis seems unconvincing because it needs an directly compared with the results of our model.
unlikely ‘40Ar partial retention zone’ to explain the age pattern (e.g. Adams & Gabites 1985; Kamp et al. 1989), and does not 4.2.1 Shear heating in orogen-oblique strike-slip shear zones
fit with the thermobarometric data nor the present-day topo-graphy. Nonetheless, only further field work could confirm T he Alpine fault of New Zealand: The New Zealand Alpine fault,
part of the Australia–Pacific plate boundary, is a #600 km shear heating as the primary metamorphic process.
Great Slave shear zone (NW territories, Canada): Deep strike-long straight fault marked by a #1.5 km wide stripe of
cataclasites, pseudotachylites and mylonites (Sibson et al. slip mylonites crop out in the #1300 km long Precambrian Great Slave Lake (GSL) shear zone of NW Canada (Table 2) 1979). The fault cuts and offsets by 480 km a
Jurassic-Cretaceous subduction complex (Wellman 1955). Most of this (e.g. Hoffman 1987; Hanmer 1988). At large scales, the fault zone cuts across previous structures and offsets the Thelon offset took place in the Oligo-Miocene (e.g. Cooper et al.
1987), when the Australia/Pacific motion was almost purely and Taltson volcanic arcs. Finite dextral offset is estimated to
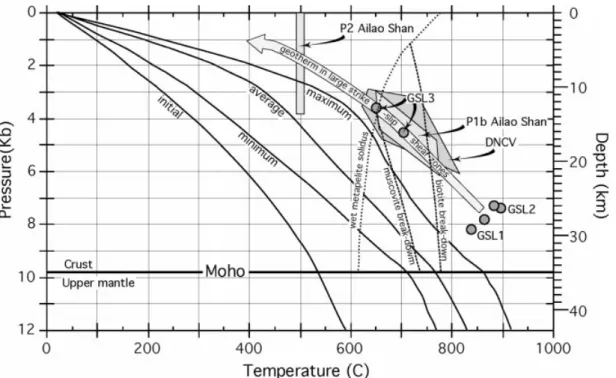
Figure 12. Shear-zone crustal geotherms calculated for a 4 cm yr−1 shear rate compared with thermobarometric data of ASSR and GSL shear zones and crustal melting curves. Steady-state model geotherms. Initial: reference model before shearing; Average: V=4 cm yr−1, otherwise reference parameters; maximum: maximum shear heating for V=4 cm yr−1 (F=0.6, hard crust, hard mantle); Minimum: minimum shear heating for V=4 cm yr−1 (F=0.1, soft crust, soft mantle). Simplified crustal melting curves. Wet solidus: H20-saturated metapelite solidus (Thompson 1982); Muscovite breakdown: muscovite dehydration melting (Mus+Alb+Q Ksp+Als+L) (Peto¨ 1976); Biotite break-down: biotite dehydration melting (Bio+Als+Pl+Q Gar+Ksp+L) (Le Breton & Thompson 1988). P–T estimates. ASRR shear zone: Peak (P1b and DNCV) and retrograde (P2) paragenesis (Leloup & Kienast 1993; Leloup, unpublished data); Great slave lake shear zone (GSL): GSL1, 2 and 3 correspond to P–T estimates in the granulite, upper amphibolite and amphibolite belts of the shear zone, respectively (Hanmer 1988).
be between 300 and 700 km. The shear zone, up to 25 km Ailao Shan–Red River shear zone (China and V ietnam): The Ailao Shan–Red River (ASRR) shear zone is possibly the best-wide, is made of five parallel mylonitic belts (1–5) formed
under granulite to greenschist metamorphic facies. Through documented example of a mid-crustal orogen-oblique shear zone. This zone allowed the lateral escape of the Indochina block in time, deformation progressively occurred in narrower belts
of lower metamorphic grade (Hanmer 1988). Belts 1 and 2, of response to the India/Eurasia collision (e.g. Tapponnier et al. 1986; Tapponnier et al. 1990; Leloup et al. 1995). The ASRR granulite and upper amphibolite facies, respectively, formed in
lower crustal conditions at high temperatures (#8.2 Kb and shear zone is nearly 1000 km long with ductile left-lateral strike-slip shear exposed in four elongated mylonitic cores less than #840°C for belt 1, and #7.5 Kb and #880 °C for belt 2)
(Fig. 12). Belt 3 formed at around 15 km depth (#4 Kb) at 20 km wide. Displacement is estimated at 700±200 km (Leloup et al. 1995). Thermo-barometric studies show that transcurrent temperatures of about 680°C (Fig. 12). Belts 4 and 5 are
1–1.5 km wide zones of rocks deformed under greenschist strain occurred under amphibolite facies conditions (3–8 kb and 550–825°C; Fig. 12). Leucocratic and monzonitic melts were facies in which P–T conditions are difficult to assess. During
strike-slip faulting, the shear zone has been progressively emplaced during strike-slip shear. Such rocks yield U/Pb ages between 26.3 and 22.4 Ma, implying Lower Miocene shear uplifted and cooled along a steep geothermal gradient.
Strike-slip deformation was coeval with extensive in situ melt pro- (Scha¨rer et al. 1990; Scha¨rer et al. 1994; Zhang 1995). Geochemical data indicate that magmatic rocks in the ASRR duction, as attested by syntectonic migmatization in belts 1
and 2, and syntectonic granitoid intrusions in belts 1–4. Some zone originated from partial melting in both the lower and middle crust (Zhang 1995). A strike-slip rate of 4±1 cm yr−1 late-syntectonic mafic dykes (diabase) are found in belt 2. U/Pb
ages of zircons from the intrusions bracket deformation age seems to have been maintained between #35 and 16 Ma (Briais et al. 1993; Leloup et al. 1994; Harrison et al. 1996). The crust between #1.98 and #1.925 Ga (Hanmer 1988).
Strike-slip deformation along the GSL occurred at high is #35 km thick (Yan Qizhong et al. 1985) and Tertiary thickening is moderate along most of the fault. This led Leloup temperatures in a narrow zone. This suggests that shear heating
was the main mechanism of producing heat along this fault. & Kienast (1993) to propose shear heating as the main cause of the high temperatures observed in the ASRR shear zone. To obtain a final geotherm compatible with the P–T estimates
in the GSL, it is necessary to use parameters leading to the The geotherm calculated for reference parameters (crust 35 km thick, HFb=20 mW m−2) and a strike-slip rate of absolute maximum shear-heating effect that one could expect
along a translithospheric strike-slip fault (V=10 cm yr−1, 4 cm yr−1 (labelled ‘average’ on Fig. 12) is much hotter than the initial one but still too cold to explain the ASRR peak F=0.6, hard crust and mantle, see Section 3.4). While very
unlikely, such a possibility cannot be ruled out, as the old age metamorphic conditions. The maximum shear-heating effect would be obtained using a high friction coefficient (i.e. F=0.6) of the GSL precludes any determination of the palaeo-slip rate.
and hard rheologies. The resulting geotherm (labelled ‘maxi- composed of a fertile ‘granite minimum’ component (40 wt per cent) and a refractory component, located at 30 km depth, mum’ on Fig. 12) is barely compatible even with the higher P
and lower T estimates in the ASRR shear zone. produces #5.5 vol per cent of melt when the temperature of muscovite breakdown is reached (#700°C). The melt fraction P–T conditions recorded in the ASRR and GSL shear zones
are similar and define a geotherm probably typical of large attains #8 vol per cent just below the temperature of biotite breakdown (#770°C) and suddenly rises to #16 vol per cent continental orogen-oblique shear zones (Fig. 12). In both
cases, our calculations fail to model this geotherm, or do it above it (Fig. 2 of Thompson & Conolly 1995). In the case of the ASRR shear zone (V=4 cm yr−1), conditions compatible for unrealistic parameters only (e.g. slip rate of 10 cm yr−1 for
the GSL). Surprisingly, our model thus underestimates the with partial melting are easily reached (Fig. 12). The modelled geotherms are compatible with water-saturated partial melting final temperatures. This was not expected, as several
charac-teristics of the model tend to maximize the shear-heating effect: below #30 km for soft rheologies and low friction coefficient (‘minimum’, Fig. 12), #25 km for reference parameters (‘average’) (1) 100 per cent of the mechanical energy is converted to heat;
(2) latent-heat-consuming metamorphic reactions are neglected; and #16 km for hard rheologies and high friction (‘maximum’). Muscovite breakdown would occur below #32 km (‘average’) (3) steady state is assumed, requiring several million years of
uninterrupted strike-slip faulting; (4) shear heating is taking or 21 km (‘maximum’), while biotite breakdown would occur only for maximum conditions below #32 km.
place in both ductile and brittle fields of the crust and mantle.
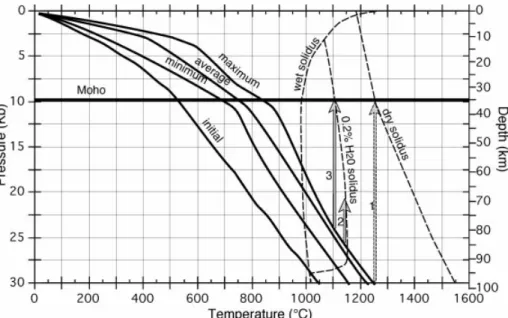
Our choice of using a simplified solution, neglecting shear Comparing the modelled geotherms with the peridotite solidus permits the discussion of the possibility of mantle heating on horizontal planes, leads to a slight underestimation
of the shear heating effect (see Appendix A). This underestimation partial melting (Fig. 13). For a dry upper mantle, temperatures before and during shearing are far too low to produce partial is, however, too small to explain the discrepancy between the
model results and the observed P–T conditions. In our model, melting of the lithospheric mantle. Even decompression by a dramatic vertical uplift (arrow 1 on Fig. 13) could not induce heat transfer occurs only by conduction, while in nature heat
advection processes may be important. Advection might trans- such melting. For an improbable water-saturated upper mantle, partial melting may be reached at much lower temperatures port heat from regions where it is produced, mostly at the brittle/
ductile transition and in the upper mantle, towards colder areas. (Fig. 13). It would occur at the base of the lithosphere before shearing (100 km depth) and below #76 km (23 kb) to #57 km Furthermore, in a long-lasting shear zone, such a mechanism
may increase the global heat production. Indeed, if heat diffuses (17 kb) during shearing, depending on the final geotherm considered (Fig. 13). As the upper mantle probably contains a slowly, temperatures rise rapidly near the heat source, buffering
heat production by shear heating. On the other hand, if heat small fluid fraction, an intermediate solidus should be used. In that case, partial melting could occur during shearing in the is removed from where it is produced, the buffering effect is
reduced as sheared rocks remain colder and thus stiffer. lower part of the lithosphere, below #86 km (26 kb) (Fig. 13). After shearing, decompression melting of the lithospheric mantle would be possible for rocks initially located in the 4.2.2 Heat advection in strike-slip shear zones
lower part of the lithosphere (arrow 2 on Fig. 13), but in most cases after a large adiabatic uplift (arrow 3 on Fig. 13). Large Various mechanisms may account for a more efficient heat
transport than the isotropic diffusion considered in our model. rapid uplift is unlikely to occur along the entire length of a strike-slip shear zone but may exist locally, for example below In shear zones, the mylonitic schistosities and foliations are
parallel to the zone. Sedimentary rocks show a strong aniso- large pull-apart basins. The contribution of mantle-derived melts could be at the origin of the mafic dykes observed in the tropy in thermal conductivity, which is low (<2 W m−1 K−1)
perpendicular to bedding and up to three times higher parallel GSL shear zone and could have enhanced lower crustal melting and alkaline magma production in the ASRR shear zone. In to it (Deming 1994). If such anisotropy existed in foliated
metamorphic rocks, heat would diffuse more rapidly along the most strike-slip zones, however, the mantle contribution to magmatism seems limited and most plutonic rocks show87/86Sr shear zone than across it, even in the case of purely conductive
heat transfer. Furthermore, hot fluids move easily along the ratios greater than 0.7 (Table 2).
Lithospheric-scale shear heating and heat advection by mylonitic fabric, making the shear zone a good heat pathway.
Melted rocks and rising magmas can be very efficient heat rising melts or fluids is thus a plausible mechanism to explain high-grade metamorphism and high heat flows in large carriers. In dikes feeding some Himalayan leucogranite
batho-liths the estimated magma ascent rates of melts produced by orogen-oblique strike-slip shear zones. We propose a model of a lithospheric shear zone (Fig. 14) where high temperatures in muscovite breakdown are of the order of 1 m s−1 (Scaillet et al.
1996). This mechanism could thus carry heat nine orders of the lower crust are triggered by shear heating in the upper mantle. Melt ascent in the shear zone accentuates the thermal magnitude more efficiently than conduction. Melt ascent is
very probably enhanced in a vertical shear zone. However, anomaly associated with the fault and may promote strain localization. Mantle melting at the base of the lithosphere, by is shear heating able to produce crustal partial melting?
In most cases, modelled final temperatures in the lower shear heating and eventually with local decompression, may further enhance crustal melting.
crust are hotter than the water-saturated solidus for meta-pelites (Fig. 12). Nevertheless, substantial melting in such conditions would require a large reservoir of free water and a
4.2.3 Shear heating in orogen-parallel strike-slip shear zones large porosity, both unexpected in the lower crust. In the
absence of free water, partial fusion may occur by dehydration Most strike-slip shear zones that have developed within orogenic belts show a spatial and temporal coincidence of transcurrent melting (or breakdown) of hydrous minerals (mainly micas and
amphiboles) (e.g. Thompson & Conolly 1995; Gardien et al. shear, high-temperature metamorphism and granitoid magma-tism (e.g. Hutton & Reavy 1992). For example, the Hercynian 1994). According to Thompson & Conolly (1995), a dry rock