HAL Id: hal-00327910
https://hal.archives-ouvertes.fr/hal-00327910
Submitted on 7 Sep 2004HAL is a multi-disciplinary open access archive for the deposit and dissemination of sci-entific research documents, whether they are pub-lished or not. The documents may come from teaching and research institutions in France or abroad, or from public or private research centers.
L’archive ouverte pluridisciplinaire HAL, est destinée au dépôt et à la diffusion de documents scientifiques de niveau recherche, publiés ou non, émanant des établissements d’enseignement et de recherche français ou étrangers, des laboratoires publics ou privés.
Early unusual ozone loss during the Arctic winter
2002/2003 compared to other winters
Florence Goutail, Jean-Pierre Pommereau, Franck Lefèvre, M. van
Roozendael, S. B. Andersen, B. A. Kåstad Hoiskar, V. Dorokhov, E. Kyrö, M.
P. Chipperfield, W. Feng
To cite this version:
Florence Goutail, Jean-Pierre Pommereau, Franck Lefèvre, M. van Roozendael, S. B. Andersen, et al.. Early unusual ozone loss during the Arctic winter 2002/2003 compared to other winters. Atmospheric Chemistry and Physics Discussions, European Geosciences Union, 2004, 4 (5), pp.5019-5044. �hal-00327910�
ACPD
4, 5019–5044, 2004Early unusual ozone loss during the Arctic
winter 2002/2003 compared to other winters F. Goutail et al. Title Page Abstract Introduction Conclusions References Tables Figures J I J I Back Close Full Screen / Esc
Print Version
Atmos. Chem. Phys. Discuss., 4, 5019–5044, 2004 www.atmos-chem-phys.org/acpd/4/5019/
SRef-ID: 1680-7375/acpd/2004-4-5019 © European Geosciences Union 2004
Atmospheric Chemistry and Physics Discussions
Early unusual ozone loss during the
Arctic winter 2002/2003 compared to
other winters
F. Goutail1, J.-P. Pommereau1, F. Lef `evre1, M. Van Roozendael2, S. B. Andersen3, B.-A. K ˚astad Høiskar4, V. Dorokhov5, E. Kyr ¨o6, M. P. Chipperfield7, and W. Feng7
1
Service d’Aeronomie, CNRS, Verri `eres le Buisson, France
2
Belgian Institute for Space Aeronomy (BIRA), Brussels, Belgium
3
Danish Meteorological Institute, Copenhagen, Denmark
4
Institute for Air Research, Kjeller, Norway
5
Central Aerological Observatory, Moscow, Russia
6
Finnish Meteorological Institute, Sodankyl ¨a, Finland
7
School of the Environment, University of Leeds, Leeds, UK
Received: 27 May 2004 – Accepted: 17 August 2004 – Published: 7 September 2004 Correspondence to: F. Goutail ([email protected])
ACPD
4, 5019–5044, 2004Early unusual ozone loss during the Arctic
winter 2002/2003 compared to other winters F. Goutail et al. Title Page Abstract Introduction Conclusions References Tables Figures J I J I Back Close Full Screen / Esc
Print Version Interactive Discussion
Abstract
Total column ozone reduction in the Arctic is evaluated each winter since 1993/1994 by the transport method (3-D CTM passive ozone minus measurements). The cu-mulative loss from 1 December to the end of the season ranges from 5–10% during warm winters like 1998/1999, 2000/2001 and 2001/2002 up to 30%–32% during cold 5
winters like 1994/1995 and 1995/1996. The 23% cumulative loss observed during the winter 2002/2003 is similar in amplitude to the 20–24% measured in 1996/1997 and 1999/2000 but the timing is different. It started unusually early in December after the occurrence of very low temperature at all stratospheric levels between 550 K and 435 K allowing PSC formation and thus chlorine activation. The early ozone loss of 10
2002/2003 is well captured by current 3-D CTM models.
1. Introduction
Chemical ozone losses in the Arctic regions have been studied since the early 1990s. Because of the large activity of planetary waves in the northern hemisphere, the eval-uation of the chemical loss is not straightforward. It requires precise removal of the 15
transport component. Several methods have been suggested, described and inter-compared by Harris et al. (2002). One of these is the transport model which consists in comparing measurements with a 3-D model in which ozone is considered as a passive tracer (Goutail et al., 1999).
After presenting the measurements and the models used in this study, the ozone loss 20
for the winter 2002/2003 will be evaluated and analyzed. The results will be compared to the loss calculated by the same method for all previous winters since 1993/1994. Finally, the ability of two 3-D chemical transport models (CTMs) to reproduce the early unusual ozone loss observed in 2002/2003 will be investigated.
ACPD
4, 5019–5044, 2004Early unusual ozone loss during the Arctic
winter 2002/2003 compared to other winters F. Goutail et al. Title Page Abstract Introduction Conclusions References Tables Figures J I J I Back Close Full Screen / Esc
Print Version
2. Measurements and models
The data used here are total ozone columns measured at the seven Arctic stations equipped with SAOZ UV-visible spectrometers (Pommereau and Goutail, 1988) part of the Network for the Detection of Stratospheric Changes (NDSC), plus those of a similar spectrometer but of different design operated at Harestua in Southern Norway 5
(Van Roozendael et al., 1995). The location of the stations, the date of installation and the institutes running the instruments are displayed in Table 1. Among those spec-trometers, one is a little north of the polar circle (Scoresbysund) and therefore starts observing only in mid-January, and two are at higher latitude (Thule and NyAlesund) beginning measuring only in mid-February.
10
Ozone slant columns are measured every morning and evening between 86◦ and 91◦solar zenith angle (SZA) in the visible Chappuis bands where the absorption cross sections are well known (1% uncertainty) and insensitive to temperature (<1%). To-tal ozone is retrieved from slant column densities using a constant Air Mass Factor (AMF) calculated for a typical Arctic ozone profile measured by the balloon-borne ver-15
sion of the SAOZ instrument. The AMF at 90◦ SZA is 16.5. AMF fluctuations related to changes in shape of ozone profile are smaller than 3% (Sarkissian et al., 1995). The consistency of the measurements of the various instruments demonstrated during inter-comparison campaigns is of ±3% (Vaughan et al., 1997; Roscoe et al., 1999). The presence of dense high type II polar stratospheric clouds (PSCs), which may lead 20
to an underestimation of total ozone because of the lifting of the scattering layer, is detected by looking at a colour index (Sarkissian et al., 1991) and the corresponding ozone data are removed.
The CTM models used here are REPROBUS and SLIMCAT run in passive and pho-tochemical modes. Though using similar approaches, they differ in several aspects 25
which need to be understood before discussing possible differences in the results. The two models are described in Appendix A and B. To calculate the ozone loss from SAOZ,
ACPD
4, 5019–5044, 2004Early unusual ozone loss during the Arctic
winter 2002/2003 compared to other winters F. Goutail et al. Title Page Abstract Introduction Conclusions References Tables Figures J I J I Back Close Full Screen / Esc
Print Version Interactive Discussion
both REPROBUS and SLIMCAT were initialized on 1 December 2002.
The study is limited to the polar stratospheric vortex. The selection of data is based on potential vorticity (PV) fields calculated by the Danish Meteorological Institute from ECMWF analyses. The boundary of the vortex is given by the maximum PV gradient following the procedure suggested by Nash et al. (1996). This procedure defines three 5
limits of the vortex, the “equatorward boundary”, the “vortex edge”, and the “poleward boundary”. Here, the “poleward boundary” on the 475 K isentropic surface (approx. 17 km – maximum of ozone concentration) is chosen. The broad geographical distri-bution of the stations means that one or more are typically located in the vortex on a given day during the winter period.
10
3. Ozone loss above individual SAOZ stations in 2002/2003
Figure 1 shows the evolution of the ozone column and the position of the vortex at one of the Arctic stations, Sodankyla in Northern Finland, between December 2002 and April 2003. The upper panel displays observed (shaded area) and passive ozone simulated by REPROBUS (solid black line). The lower panel shows PV at 475 K above 15
the station and the average PV at the edge of the vortex. Modeled and measured column ozone are comparable. The model captures well the short-term fluctuations related to the reversible vertical motions of the tropopause following the propagation of planetary waves. Transitions between the inside and the outside of the vortex are also clearly seen, specially during the second half of January, when the station is located 20
outside the vortex and high ozone columns up to 500 DU are measured. However, a significant difference progressively builds up indicative of a chemical reduction. Just before the end of the simulation, by mid-March, when the vortex passes for the last time above Sodankyla, the difference between the measurements and the REPROBUS passive ozone reaches 90 Dobson Units (DU), or about 23%.
25
Similar observations are reported at the other stations (not shown) though the total ozone and hence the absolute loss expressed in DU can vary from one station to the
ACPD
4, 5019–5044, 2004Early unusual ozone loss during the Arctic
winter 2002/2003 compared to other winters F. Goutail et al. Title Page Abstract Introduction Conclusions References Tables Figures J I J I Back Close Full Screen / Esc
Print Version
other because of the change of tropopause height. The loss at the various stations should thus be compared in relative and not absolute units.
The relative percent reduction in the vortex at the seven stations combined altogether is shown in the lower panel of Fig. 2. Also shown in the upper panel of Fig. 2 is the minimum ECMWF temperature north of 30◦N at three levels (435, 475 and 550 K). At 5
550 K the temperatures were well below TNAT from mid-November. At the beginning of December they were below TNAT at the upper levels (475 and 550 K) and by mid-December at the three levels where they remained cold until mid-January. After that date, three minor stratospheric warming occurred, the first around 15 January lasting 20 days, the second around 10 February lasting 15 days and the last around 5 March 10
for 10 days. During the short warming periods, the temperature increases above the TNAT. The final warming is observed around 20 March.
Consistent with the meteorology, the loss started very early (Fig. 2, bottom), during the first ten days of December, at an average rate of 0.35% per day. At the end of December, a 10% total column ozone reduction is already observed above the SAOZ 15
stations, four of them being located at (or southward) the polar circle. During the first ten days of January 2003, the temperature was still below that of TNAT PSC formation but the ozone reduction remained stable. A second period of reduction occurred be-tween 10 January and 31 January 2003 at a rate of 0.4% per day. Then it stabilized again during twenty days. A third period of reduction at a rate of 0.5% per day is ob-20
served between 20 February and 1 March 2003. After that, no additional loss is seen in the SAOZ measurements leading to a cumulative loss of 23% at the end of the winter or ∼90 DU. Also shown (Fig. 2, bottom) is a 10-day mean with error bars representing the standard deviation. On average, the standard deviation is 4%.
In summary, a total cumulative ozone loss of 23±4% was observed by the SAOZ 25
ACPD
4, 5019–5044, 2004Early unusual ozone loss during the Arctic
winter 2002/2003 compared to other winters F. Goutail et al. Title Page Abstract Introduction Conclusions References Tables Figures J I J I Back Close Full Screen / Esc
Print Version Interactive Discussion
4. Early chlorine activation
A very early ozone loss in 2002/2003 has been also reported by Tilmes et al. (2003) from an analysis of the HALOE data using the TRAC (ozone-tracer correlation) method, associated with very low HCl mixing ratio measured on the 520 K surface by the MkIV balloon instrument flown over northern Sweden on 16 December 2002. These low HCl 5
mixing ratios indicate that strong chlorine activation had already occurred by that date in the vortex.
This is in agreement with PSC observed by balloon-borne instruments, during the first days of December 2002, between 3 and 7 December (Larsen et al., 2004).
The occurrence of early chlorine activation is also supported by the measurements 10
of the ODIN Sub-Millimeter Radiometer (SMR) satellite instrument. Significant amount of ClO, around 0.3–0.6 ppbv, were measured on 9–10 December 2002, between 450 K and 525 K (Urban et al., 2004).
The early activation is also confirmed by the presence of high OClO levels observed in December by the UV-Visible spectrometer at Harestua in Southern Norway (Fig. 3) 15
when the vortex was present above the station (bottom panel). It is also confirmed by the ERS-2/GOME (Global Ozone Monitoring Experiment on board ERS-2 satellite) observations displaying an unusual high activation in December compared to the pre-vious winters (see: http://www.iup.physik.uni-bremen.de/gomenrt2003/)(Wagner et al. 2001, 2002; WMO assessment 200, Chapter 3).
20
The early ozone loss observed by the SAOZ in December 2002 is thus consistent with the cold ECMWF stratospheric temperatures, the HCl reduction observed by the MkIV balloon instrument, the high ClO of SMR/ODIN and the high OClO over Harestua as well as that reported by ERS-2/GOME.
ACPD
4, 5019–5044, 2004Early unusual ozone loss during the Arctic
winter 2002/2003 compared to other winters F. Goutail et al. Title Page Abstract Introduction Conclusions References Tables Figures J I J I Back Close Full Screen / Esc
Print Version
5. Comparison to other winters
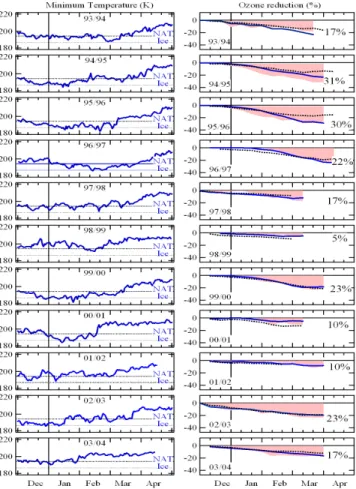
The results of the winter 2002/2003 are compared in Fig. 4 to that of all other winters since 1993/1994: derived minimum temperature at 475 K on the left and SAOZ cumu-lative O3 loss and of the two models on the right, modeled ozone loss being derived by difference between two consecutive runs (passive and photochemical modes). The 5
23% cumulative loss during the winter 2002/2003 is larger than the 5–10% observed during warm winters like 1998/1999, 2000/2001 and 2001/2002 (Goutail et al., 2000, 2003), but smaller than the 30%–32% reported during the coldest winters in 1994/1995 and 1995/1996 (Goutail et al., 1999, 1998). It is similar in amplitude to the 20–24% measured in 1996/1997 and 1999/2000 (Goutail et al., 1998; Harris et al., 2002), but 10
the timing is different. While during most of the winters, the loss begins in January or eventually in mid-December like in 1995/1996, in 2002/2003, it started very early in December in coincidence with very low stratospheric temperatures.
Noteworthy also in Fig. 4 is that the observed loss in January 1994/1995 and January 1995/1996 is not reproduced by the REPROBUS and SLIMCAT simulations available 15
for those winters. Goutail et al. (1999) compared SAOZ and 3-D CTM ozone loss for the winter 1994/1995. They found that the timing and the altitude at which the ozone reduction took place was well captured by the 3-D CTMs, for that winter, but that the amplitude was underestimated in low sun conditions during the early winter. Since this statement, improvements have evidently been made in the two 3-D CTMs.
20
The observed cumulative loss for the eleven consecutive winters since 1993/1994, the main period of ozone reduction during the season and the date at which 10% loss was reached are displayed in Table 2. In most cases, the ozone reduction is starting during the second half of December and 10% loss is reached only on or after 20 January. The winter 2002/2003 with its 10% loss at the end of December is an 25
ACPD
4, 5019–5044, 2004Early unusual ozone loss during the Arctic
winter 2002/2003 compared to other winters F. Goutail et al. Title Page Abstract Introduction Conclusions References Tables Figures J I J I Back Close Full Screen / Esc
Print Version Interactive Discussion
6. Model simulations of 2002/2003
The ozone loss above the SAOZ stations during the winter 2002/2003 has been sim-ulated by REPROBUS and SLIMCAT. For better consistency with observations, only simulations corresponding to existing measurements (SZA <91◦ at noon) are consid-ered.
5
6.1. REPROBUS
The REPROBUS simulations are shown in Fig. 5 in a similar format as in Fig. 2. Also shown is a 10-day average with error bars representing standard deviation. On aver-age, the dispersion is 2%, half that of the measurements). REPROBUS captures a loss at a rate of 0.3% per day in December, then a plateau of about 20 days and again 10
a loss at a rate of 0.2% per day from 20 January until 20 March. Its cumulative loss at the end of the winter is 20% (or 80 DU).
The timing and the amplitude of the loss are comparable to the observations. The current REPROBUS version correctly captures the December ozone destruction.
The details of simulated fields (PSC surface area, HCl, ClOx, O3 loss and PV) at 15
550 K and 475 K on 5 and 25 December and 15 January, are displayed in Fig. 6. PSCs are already present on 5 December (Fig. 6, top), more developed at 550 K, resulting in an HCl depletion in the vortex, as well as in the appearance of reactive chlorine (ClOx=[ClO]+2[ClOOCl]). However, there is no indication of ozone loss as the vortex is confined in darkness north of 60◦N.
20
On 25 December (Fig. 6, middle), few PSCs could be still seen, but HCl was com-pletely depleted and chlorine largely activated in the whole vortex. However, the vortex is now elongated towards illuminated latitudes, and significant ozone losses appear at its periphery, more abundant at 475 K than at 550 K.
On 15 January (Fig. 6, bottom), no more PSCs could be seen, but the vortex is still 25
activated and its displacement towards East European mid-latitudes as south as 50◦N, allows the ozone depletion to reinforce at its inner edge, resulting in an annular shape.
ACPD
4, 5019–5044, 2004Early unusual ozone loss during the Arctic
winter 2002/2003 compared to other winters F. Goutail et al. Title Page Abstract Introduction Conclusions References Tables Figures J I J I Back Close Full Screen / Esc
Print Version
At the end of January, (not shown), the depletion is well mixed and the vortex is homogeneously depleted, in agreement with the conclusions of Tilmes et al. (2004). 6.2. SLIMCAT
The results of SLIMCAT simulations are shown in Fig. 7. The early depletion is also captured at a rate of 0.3% per day in December and January followed by a plateau of 5
about 10 days in February and then by a loss again at a rate of 0.3% per day from 10 February until 10 March. At the end of the winter, the cumulative loss is 20% (or 80 DU). The timing and the amplitude of the depletion are similar to that of REPROBUS. The SLIMCAT results for 2002/2003 are described in more detail in Feng et al. (2004).
In summary, the 2002/2003 REPROBUS and SLIMCAT simulations are in close 10
agreement with each other, as well as with the SAOZ observations within the error bars. In their current versions, both models appear to capture the reported low-sun early winter ozone depletion.
7. Conclusions
An unusually early ozone loss was observed in 2002/2003, at least one month earlier 15
than during any of the previous eleven winters. This unusual behaviour is consistent with the low reported temperatures in the stratosphere as well to the signature of early chlorine activation seen by ground-based, balloon and satellite observations. The early ozone depletion is well captured by the current versions of both the REPROBUS and SLIMCAT models, showing that chemical depletion did indeed take place in December 20
ACPD
4, 5019–5044, 2004Early unusual ozone loss during the Arctic
winter 2002/2003 compared to other winters F. Goutail et al. Title Page Abstract Introduction Conclusions References Tables Figures J I J I Back Close Full Screen / Esc
Print Version Interactive Discussion
Appendix A: REPROBUS
The 3-D-CTM REPROBUS (Reactive Processes Ruling the Ozone Budget in the Stratosphere) is described in Lef `evre et al. (1994, 1998). In general the model is used for seasonal simulations run at 2◦ latitude by 2◦ longitude resolution (approximately 220 km×90 km at the polar circle). The transport and chemical reactions rated are 5
driven by the ECMWF 6-hourly analysis of temperature and winds, analyzed vertical velocities to compute vertical motion. The REPROBUS chemical package is described in Lef `evre et al. (1994) and has been regularly updated since from newly measured reaction rates or absorption cross-sections (DeMore et al., 1997; Brown et al., 1999a, b; Sander et al., 2000; Knight et al., 2002; Roehl et al., 2002). PSCs are assumed to 10
be in thermodynamic equilibrium. The composition of liquid aerosols is calculated ana-lytically. NAT is formed at the equilibrium NAT saturation temperature and the presence of ice is tested using the saturation vapour pressure of water over ice. Ice is assumed to incorporate NAT as a co-condensate, removing nitric acid from the vapour phase. The description of polar stratospheric cloud microphysics in the model has also been 15
improved in recent years. In the most recent version of REPROBUS, a highly selective nucleation process allows the formation of a small number of large NAT (Nitric Acid Trihydrate) particles, as observed from airborne measurements in winter 1999–2000 (Fahey et al., 2001). These particles may form at temperatures above the ice frost point, and may coexist with liquid ternary aerosols. Above the NAT formation threshold 20
temperature, these solid particles are able to re-evaporate.
The ozone fields are initialized every year at the beginning of December from MLS or POAM measurements, depending upon their availability. The three-dimensional ozone analysis made at ECMWF was used to initialize the 2002/2003 simulation. Wa-ter vapour is initialized from a MLS-HALOE zonal mean late fall climatology. The sul-25
fate aerosol content is derived for each winter from SAGE-II measurements. All other species are initialized from the November zonal mean of a 5-year run of REPROBUS coupled to the ARPEGE general circulation model (see WMO 1998 assessment,
Chap-ACPD
4, 5019–5044, 2004Early unusual ozone loss during the Arctic
winter 2002/2003 compared to other winters F. Goutail et al. Title Page Abstract Introduction Conclusions References Tables Figures J I J I Back Close Full Screen / Esc
Print Version
ter 12).
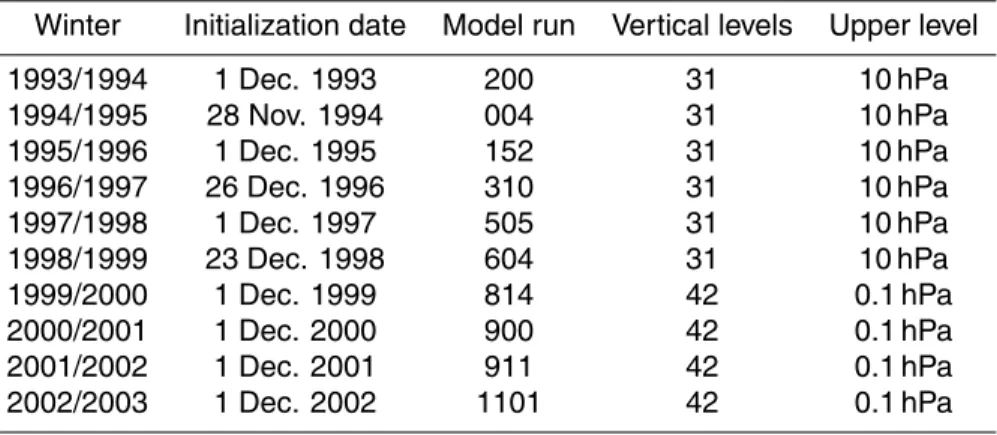
REPROBUS simulations used in the present work are those carried out every year with the latest version available at that time. Until the end of 1998, the REPROBUS calculations were performed on the 31 vertical levels of the ECMWF analysis, extend-ing up to 10 hPa at that time. In January 1999, followextend-ing the extension of the vertical 5
domain of the ECMWF analyses to 60 levels up to 0.1 hPa, the number of vertical lev-els of REPROBUS was increased to 42, with a ∼1 km vertical resolution in the lower stratosphere and an uppermost level at 0.1 hPa (about 65 km). The earliest integra-tions of the model, prior to 1999, for which the 60-level ECMWF operational analysis are not available, could not be reprocessed with the last version of the model. The 10
REPROBUS initialization date, model run number and number of vertical levels are summarized in Table 3.
Appendix B: SLIMCAT
The 3-D SLIMCAT CTM, is described in detail by Chipperfield (1999) and has been used for a number of studies related to ozone depletion in the northern and southern 15
vortices (e.g. Chipperfield et al., 1996, 1998; Guirlet et al., 2000; Hansen et al., 1997; Sinnhuber et al., 2000). In general the model is run for multiannual simulations at low horizontal resolution (7.5◦×7.5◦) and these are used to initialize higher resolution seasonal simulations.
For past studies seasonal integrations of SLIMCAT were run at a resolution of 2.5◦ 20
latitude ×3.75◦ longitude (approximately 275 km×170 km at the polar circle) using UK Met Office (UKMO) horizontal winds and temperatures. These runs used 24θ (isen-tropic) levels from 330 K to 3000 K (approximately 10 to 55 km) and the vertical ad-vection was derived from calculated heating rates using the MIDRAD stratospheric radiation scheme (Shine, 1987). The seasonal runs were initialized from the output 25
ACPD
4, 5019–5044, 2004Early unusual ozone loss during the Arctic
winter 2002/2003 compared to other winters F. Goutail et al. Title Page Abstract Introduction Conclusions References Tables Figures J I J I Back Close Full Screen / Esc
Print Version Interactive Discussion
in order to match the initialization date of REPROBUS. For these runs a tropospheric contribution was added to the SLIMCAT O3 column in order to compare with SAOZ observations. This can cause significant uncertainties in periods of large variation of the tropopause height.
Recently SLIMCAT has been modified to use a hybrid σ − θ coordinate and extended 5
down to the surface. Here this most recent version of the model has been used to provide the seasonal simulations for the winters 1999/2000, 2002/2003 and 2003/2004 (the other winters use results from the older model described above). These runs were forced by ECMWF analyses and had a horizontal resolution of 2.8◦×2.8◦with 24 levels from the surface to ∼55 km. They were initialized from an ECMWF-forced multiannual 10
run which started in 1989 (run 317). These seasonal model runs are described and used in Feng et al. (2004).
The SLIMCAT gas-phase and heterogeneous chemistry modules, including liquid aerosols, NAT and ice particles, are described in Chipperfield (1999). PSCs are as-sumed to be in thermodynamic equilibrium, with no modification of the model temper-15
ature to account for supersaturation. The composition of liquid aerosols (containing HNO3, H2SO4, H2O and HCl) is calculated analytically. NAT is formed at the equi-librium NAT saturation temperature and the presence of ice is tested using the sat-uration vapour pressure of water over ice. Ice is assumed to incorporate NAT as a co-condensate, removing nitric acid from the vapor phase. The older (UKMO-forced) 20
runs used an ice-based denitrification scheme, which had essentially no effect in the Arctic simulations used here. The recent (ECMWF-forced) runs incorporated a simple NAT-based denitrification scheme (see Davies et al. 2001; Feng et al., 2004).
Acknowledgements. The authors thank the SAOZ stations operators, ECMWF for the
mete-orological data and E. Nash for vortex limits. This work was supported by the Centre Na-25
tional d’Etudes Spatiales (CNES), Services d’Observations de l’IPSL, the Programme Na-tional de Chimie de l’Atmosphere (PNCA) in France and the EC Environmental projects (SCUVS, SCUVS-III, SRS, TOPOZ III, THESEO/O3Loss, THESEO 2000/EUROSOLVE, ENV-2001-QUILT). The SAOZ stations are part of the NDSC (Network for Detection of Stratospheric
ACPD
4, 5019–5044, 2004Early unusual ozone loss during the Arctic
winter 2002/2003 compared to other winters F. Goutail et al. Title Page Abstract Introduction Conclusions References Tables Figures J I J I Back Close Full Screen / Esc
Print Version
Changes).
References
Brown, S., Talukdar, R., and Ravishankara, A.: Reconsideration of the rate constant for the reaction of hydroxyl radicals with nitric acid, J. Phys. Chem., 103, 3031–3037, 1999a. Brown, S., Talukdar, R., and Ravishankara, A.: Rate constants for the reaction 5
OH+NO2+M→HNO3+M under atmospheric conditions, Chem. Phys. Lett., 299, 277–284, 1999b.
Chipperfield, M. P., Lee, A. M., and Pyle, J. A.: Model calculations of ozone depletion in the Arctic polar vortex for 1991/92 to 1994/95, Geophys. Res. Lett., 5, 559–562, 1996.
Chipperfield, M. P. and Pyle, J. A.: Model sensitivity studies of Arctic ozone depletion, J. Geo-10
phys. Res., 103, 28 389–28 403, 1998.
Chipperfield, M. P.: Multiannual simulations with a Three-Dimensional Chemical Transport Model, J. Geophys. Res., 104, 1781–1805, 1999.
Davies, S., Chipperfield, M. P., Carslaw, K. S., Sinnhuber, B.-M., Anderson, J. G., Stimpfle, R., Wilmouth, D., Fahey, D. W., Popp, P. J., Richard, E. C., von der Gathen, P., Jost, H., 15
and Webster, C. R.: Modeling the Effect of Denitrification on Arctic Ozone Depletion During Winter 1999/2000, J. Geophys. Res., 107, 8322, doi:10.1029/2001JD000445, 2002; printed 108 (D5), 2003.
DeMore, W. B., Sander, S. P., Golden, D. M., Hampson, R. F., Kurylo, M. J., Howard, C. J., Ravishankara, A. R., Kolb, C. E., and Molina, M. J.: Chemical Kinetics and Photochemical 20
Data for Use in Stratospheric Modelling, Evaluation no. 12, JPL Publication 97-4, 1997. Fahey, D. W., Gao, R. S., Carslaw, K. S., Kettleborough, J., Popp, P. J., Northway, M. J., Holecek,
J. C., Ciciora, S. C., McLaughlin, R. J., Thompson, T. L., Winkler, R. H., Baumgardner, D. G., Gandrud, B., Wennberg, P. O., Dhaniyala, S., McKinney, K., Peter, T., Salawitch, R. J., Bui, T. P., Elkins, J. W., Webster, C. R., Atlas, E. L., Jost, H., Wilson, H., Herman, R. L., 25
Kleinb ¨ohl, A., and von K ¨onig, M.: The detection of large nitric-acid particles in the winter Arctic stratosphere, and their role in denitrification, Science, 291, 1026–1031, 2001.
Feng, W., Chipperfield, M. P., Davies, S., Sen, B., Toon, G., Blavier, J. F., Webster, C. R., Volk, C. M., Ulanovsky, A., Ravegnani, F., von der Gathen, P., Jost, H., Richard, E. C., and Claude,
ACPD
4, 5019–5044, 2004Early unusual ozone loss during the Arctic
winter 2002/2003 compared to other winters F. Goutail et al. Title Page Abstract Introduction Conclusions References Tables Figures J I J I Back Close Full Screen / Esc
Print Version Interactive Discussion
H.: Three-dimensional model study of the Arctic ozone loss in 2002/03 and comparison with 1999/2000 and 2003/04, Atmos. Chem. Phys. Discuss., accepted, 2004.
Goutail, F., Pommereau, J.-P., Kyro, E., Rummukainen, M., Ericksen, P., Andersen, S., Kaastad-Hoiskar, B.-A., Braathen, G. O., Dorokhov, V., Khattatov, V., van Roozendael, M., and de Maziere, M.: Total ozone reduction in the Arctic vortex during the winters of 1995/96 and 5
1996/97, Proc. 4th European Symposium on Polar Ozone, EC Air Pollution Research Re-port No. 66, edited by Harris, N. R. P., Kilbane-Dawe, I., and Amanatidis, G. T., European Commission, 277–280, 1998.
Goutail, F., Pommereau, J.-P., Phillips, C., Deniel, C., Sarkissian, A., Lef `evre, F., Kyro, E., Rum-mukainen, M., Ericksen, P., Andersen, S., Kaastad-Hoiskar, B.-A., Braathen, G., Dorokhov, 10
V., and Khattatov, V.: Depletion of Column Ozone in the Arctic during the Winters 1993–94 and 1994–95, J. Atmos. Chem., 32, 1–34, 1999.
Goutail, F., Pommereau, J.-P., and Lef `evre, F.: Winter ozone loss in the Arctic and at mid-latitudes in 1998 and 1999 from the saoz ground-based network and balloon measurements, in Proc. 5th Europ. Symp., EU Air Pollution Res. Rep. 73, Saint Jean de Luz (France), 1999, 15
edited by Harris, N. R. P., Guirlet, M., and Amanatidis, G. T., 433–436, 2000.
Goutail, F., Pommereau, J.-P., and Lef `evre, F.: Total ozone reduction in the Arctic during the winters 2001 and 2002 from the saoz network and comparison to previous winters, in Proc. 6th Europ. Symp., EU Air Pollution Res. Rep. 79, G¨oteborg (Sweden) 2002, edited by Harris, N. R. P., Amanatidis, G. T., and Levine, J. G., 181–184, 2003.
20
Guirlet, M., Chipperfield, M. P., Pyle, J. A., Goutail, F., Pommereau, J.-P., and Kyr ¨o, E.: Modelled Arctic ozone depletion in winter 1997/98 and comparison with previous winters, J. Geophys. Res., 105, 22 185–22 200, 2000.
Hansen, G., Svenøe, T., Chipperfield, M. P., Dahlback, A., and Hoppe, U.-P.: Evidence of substantial ozone depletion in winter 1995/96 over Northern Norway, Geophys. Res. Lett., 25
24, 799–802, 1997.
Harris, N. P. R., Rex, M., Goutail, F., Knudsen, B. M., Manney, G. L., M ¨uller, R., and von der Gathen, P.: Comparison of Empirically Derived Ozone Losses in the Arctic Vortex, J. Geophys. Res., 107 (D20), doi:10.1029/2001JD000482, 2002.
Knight, G., Ravishankara, A. R., and Burkholder, J. B.: UV absorption cross sections of 30
HO2NO2 between 343 and 273 K, Phys. Chem. Phys., 4, 1732–1437, 2002.
Larsen, N., Knudsen, B. M., Svendsen, S. H., Deshler, T., Rosen, J. M., Kivi, R., Weisser, C., Schreiner, J., Mauerberger, K., Cairo, F., Ovarlez, J., Oelhaf, H., and Spang, R.: Formation of
ACPD
4, 5019–5044, 2004Early unusual ozone loss during the Arctic
winter 2002/2003 compared to other winters F. Goutail et al. Title Page Abstract Introduction Conclusions References Tables Figures J I J I Back Close Full Screen / Esc
Print Version
solid particles in synoptic-scale Arctic PSCs in early winter 2002/2003, Atmos. Chem. Phys. Discuss., 4, 2485–2512, 2004.
Lef `evre, F., Brasseur, G. P., Folkins, I., Smith, A. K., and Simon, P.: Chemistry of the 1991–92 stratospheric winter: three dimensional model simulations, J. Geophys. Res., 99, 8183– 8195, 1994.
5
Lef `evre, F., Figarol, F., Carslaw, K. S., and Peter, T.: The 1997 Arctic ozone depletion quantified from three dimensional model simulations, Geophys. Res. Lett., 25, 2425–2428, 1998. Nash, E. R., Newman, P. A., Rosenfield, J. E., and Schoeberl, M. R.: An objective determination
of the polar vortex using Ertel’s potential vorticity, J. Geophys. Res., 101, 9471–9478, 1996. Pommereau, J. P. and Goutail, F.: O3 and NO2 Ground-Based Measurements by Visible Spec-10
trometry during Arctic Winter and Spring 1988, Geophys. Res. Lett., 891–894, 1988. Roehl, C. M., Nizkorodov, S. A., Zang, H., Blake, G. A., and Wennberg, P. O.: Photodissociation
of Peroxynitric Acid in the Near-IR, J. Phys. Chem., 106, 3766–3772, 2002.
Roscoe, H. K, Johnston, P. V., Van Roozendael, M., Richter, A., Preston, K., Lambert, J. C., Hermans, C., de Kuyper, W., Dzenius, S., Winterath, T., Burrows, J., Sarkissian, A., Goutail, 15
F., Pommereau, J. P., d’Almeida, E., Hottier, J., Coureul, C., Ramond, D., Pundt, I., Bartlet, L. M., Kerr, J. E., Elokhov, A., Giovanelli, G., Ravegnani, F., Premudan, M., Kostadinov, M., Erle, F., Wagner, T., Pfeilsticker, K., Kenntner, M., Marquand, L. C., Gil, M., Puentedura, O., Arlander, W., Kaastad-Hoiskar, B. A., Tellefsen, C. W., Heese, C. W., Jones, R. L., Aliwell, S. R., and Freshwater, R. A.: Slant column measurements of O3 and NO2 during the NDSC 20
intercomparison of zenith-sky UV-visible spectrometers in June 1996, J. Atmos. Chem., 32, 281–314, 1999.
Sander, S. P., Friedl, R. R., Golden, D. M., Kurylo, M. J., Hampson, R. F., Huie, R. E., Moortgat, G. K., Ravishankara, A. R., Kolb, C. E., and Molina, M. J.: Chemical Kinetics and Photo-chemical Data for Use in Stratospheric Modeling, Evaluation number 13, JPL Publication 25
00-3, 2000.
Sarkissian, A., Pommereau, J. P., and Goutail, F.: Identification of polar stratospheric clouds from the ground by visible spectrometry, Geophys. Res. Lett., 18, 779–782, 1991.
Sarkissian, A., Roscoe, H. K., Fish, D., Van Roozendael, M., Gil, M., Chen, H. B., Wang, P., Pommereau, J. P., and Lenoble, J.: Ozone and NO2 AMF for zenith sky spectrometer: 30
ACPD
4, 5019–5044, 2004Early unusual ozone loss during the Arctic
winter 2002/2003 compared to other winters F. Goutail et al. Title Page Abstract Introduction Conclusions References Tables Figures J I J I Back Close Full Screen / Esc
Print Version Interactive Discussion
Soc., 113, 603–633, 1987.
Sinnhuber, B. M., Chipperfield, M. P., Davies, S., Burrows, J. P., Eichman, K. U., Weber, M., Von Der Gathen, P., Guirlet, M., Cahill, G. A., Lee, A. M., and Pyle, J. A.: Large loss of total ozone during the Arctic winter of 1999/2000, Geophys. Res. Lett., 27, 3473–3476, 2000. Tilmes, S., M ¨uller, R., Grooß, J.-U., H ¨opfner, M., Toon, G. C., and Russell, J.: Very early 5
chlorine activation and ozone loss in the Arctic winter 2002–2003, Geophys. Res. Lett., 30, 2200, doi:10.1029/2003GL018792, 2003.
Tilmes, S., M ¨uller, R., Grooß, J.-U., and Russell, J.: Ozone Loss and Chlorine Activation in the Arctic Winters 1991–2003 Derived with the TRAC method, Atmos. Chem. Phys. Discuss., 4, 2167–2238, 2004.
10
Urban, J., Lauti ´e, N., Le Flochmo ¨en, E., Murtagh, D., Ricaud, P., De La No ¨e, J., Dupuy, E., Drouin, A., El Amraoui, L., Eriksson, P., Frisk, U., Jim ´enez, C., Kyr ¨ol ¨a, E., Llewellyn, E. J., M ´egie, G., Nordh, L., and Olberg, M.: The northern hemisphere stratospheric vortex during the 2002/03 winter: Subsidence, chlorine activation and ozone loss ob-served by the Odin Sub-Millimetre Radiometer, Geophys. Res. Lett., 31, 7, L07103, 15
doi:10.1029/2003GL019089, 2004.
Van Roozendael, M., Hermans, C., Kabbadj, Y., Lambert, J.-C., Vandaele, A.-C., Simon, P. C., Carleer, M., Guilmot, J.-M., and Colin, R.: Ground-based measurements of stratospheric OClO, NO2 and O3 at Harestua, Norway (60◦N, 10◦E) during SESAME, Proceedings 12th ESA Symposium on Rocket and Balloon Programmes & Related Research, Lillehammer, 20
Norway, ESA SP-370, 305–310, 1995.
Vaughan, G., Roscoe, H. K., Bartlett, L. M., O’Connor, F. M., Sarkissian, A., Van Roozendael, M., Lambert, J. C., Simon, P. C., Karlsen, K., Kaastad Hoiskar, B. A., Fish, D. J., Jones, R. L., Freshwater, R., Pommereau, J. P., Goutail, F., Andersen, S. B., Drew, D. G., Hughes, P. A., Moore, D., Mellqvist, J., Hegels, E., Klupfel, T., Erle, F., Pfeilsticker, K., and Platt, U.: An 25
intercomparison of groundbased UV visible sensors of Ozone and NO2, J. Geophys. Res., 102, 1411–1422, 1997.
WMO (World Meteorological Organization): Scientific Assessment of Ozone Depletion: 1998, Global Ozone Research and Monitoring Project – Report n◦44, Geneva, 1999.
WMO (World Meteorological Organization): Scientific Assessment of Ozone Depletion: 2002, 30
ACPD
4, 5019–5044, 2004Early unusual ozone loss during the Arctic
winter 2002/2003 compared to other winters F. Goutail et al. Title Page Abstract Introduction Conclusions References Tables Figures J I J I Back Close Full Screen / Esc
Print Version Table 1. Arctic ground-based SAOZ NDSC stations.
Location Lat. Long. Since Institute Ny-Alesund, Svalbard 79 N 12 E 1991 NILU Thule, West Greenland 77 N 69 W 1991 DMI Scoresbysund, Greenland 70 N 22 W 1991 CNRS/DMI Zhigansk, East Siberia 67 N 123 E 1991 CNRS/CAO Salekhard, West Siberia 67 N 67 E 1998 CNRS/CAO Sodankyla, Finland 67 N 27 E 1990 CNRS/FMI Harestua, Norway 60 N 11 E 1994 IASB
ACPD
4, 5019–5044, 2004Early unusual ozone loss during the Arctic
winter 2002/2003 compared to other winters F. Goutail et al. Title Page Abstract Introduction Conclusions References Tables Figures J I J I Back Close Full Screen / Esc
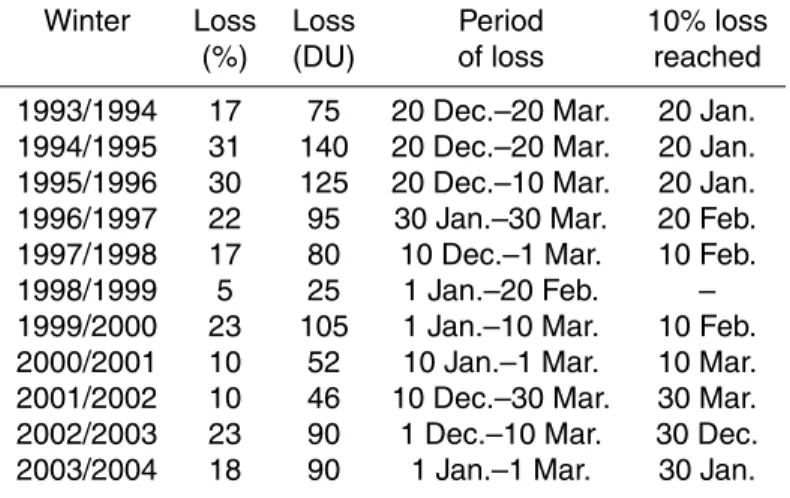
Print Version Interactive Discussion Table 2. SAOZ Ozone loss.
Winter Loss Loss Period 10% loss (%) (DU) of loss reached 1993/1994 17 75 20 Dec.–20 Mar. 20 Jan. 1994/1995 31 140 20 Dec.–20 Mar. 20 Jan. 1995/1996 30 125 20 Dec.–10 Mar. 20 Jan. 1996/1997 22 95 30 Jan.–30 Mar. 20 Feb. 1997/1998 17 80 10 Dec.–1 Mar. 10 Feb. 1998/1999 5 25 1 Jan.–20 Feb. – 1999/2000 23 105 1 Jan.–10 Mar. 10 Feb. 2000/2001 10 52 10 Jan.–1 Mar. 10 Mar. 2001/2002 10 46 10 Dec.–30 Mar. 30 Mar. 2002/2003 23 90 1 Dec.–10 Mar. 30 Dec. 2003/2004 18 90 1 Jan.–1 Mar. 30 Jan.
ACPD
4, 5019–5044, 2004Early unusual ozone loss during the Arctic
winter 2002/2003 compared to other winters F. Goutail et al. Title Page Abstract Introduction Conclusions References Tables Figures J I J I Back Close Full Screen / Esc
Print Version Table 3. REPROBUS model run.
Winter Initialization date Model run Vertical levels Upper level 1993/1994 1 Dec. 1993 200 31 10 hPa 1994/1995 28 Nov. 1994 004 31 10 hPa 1995/1996 1 Dec. 1995 152 31 10 hPa 1996/1997 26 Dec. 1996 310 31 10 hPa 1997/1998 1 Dec. 1997 505 31 10 hPa 1998/1999 23 Dec. 1998 604 31 10 hPa 1999/2000 1 Dec. 1999 814 42 0.1 hPa 2000/2001 1 Dec. 2000 900 42 0.1 hPa 2001/2002 1 Dec. 2001 911 42 0.1 hPa 2002/2003 1 Dec. 2002 1101 42 0.1 hPa
ACPD
4, 5019–5044, 2004Early unusual ozone loss during the Arctic
winter 2002/2003 compared to other winters F. Goutail et al. Title Page Abstract Introduction Conclusions References Tables Figures J I J I Back Close Full Screen / Esc
Print Version Interactive Discussion
© EGU 2004
Fig. 1. Top: time series of total ozone measured (pink shaded area) and simulated by the
transport model REPROBUS (thick line) from 1 December 2002 until 30 April 2003 above Sodankyla, Finland. Bottom: potential vorticity at 475 K (green shaded area) and limit of the vortex (green thick line).
ACPD
4, 5019–5044, 2004Early unusual ozone loss during the Arctic
winter 2002/2003 compared to other winters F. Goutail et al. Title Page Abstract Introduction Conclusions References Tables Figures J I J I Back Close Full Screen / Esc
Print Version Interactive Discussion
© EGU 2004
Fig. 2. Top: ECMWF minimum temperature in the Arctic at 3 levels, 550 K, 475 K and 435 K.
Bottom: measured total ozone reduction inside the vortex at the SAOZ Arctic stations (sym-bols), 10-day average (solid line) and standard deviation (error bars) from 1 December 2002 until 30 March 2003.
ACPD
4, 5019–5044, 2004Early unusual ozone loss during the Arctic
winter 2002/2003 compared to other winters F. Goutail et al. Title Page Abstract Introduction Conclusions References Tables Figures J I J I Back Close Full Screen / Esc
Print Version Interactive Discussion
© EGU 2004
Fig. 3. Top: time series of OClO Differential Slant Columns (91◦–80◦ SZA) at Harestua, south-ern Norway, from 1 December 2002 until 30 April 2003. Bottom: potential vorticity at 475 K and limit of the vortex.
ACPD
4, 5019–5044, 2004Early unusual ozone loss during the Arctic
winter 2002/2003 compared to other winters F. Goutail et al. Title Page Abstract Introduction Conclusions References Tables Figures J I J I Back Close Full Screen / Esc
Print Version Fig. 4. Right: total ozone reduction in the vortex derived each year since 1993/1994 from the
measurements of the SAOZ stations (shaded pink) and simulated by REPROBUS (blue solid
ACPD
4, 5019–5044, 2004Early unusual ozone loss during the Arctic
winter 2002/2003 compared to other winters F. Goutail et al. Title Page Abstract Introduction Conclusions References Tables Figures J I J I Back Close Full Screen / Esc
Print Version Interactive Discussion
© EGU 2004
Fig. 5. REPROBUS ozone loss inside the vortex at the SAOZ Arctic stations (symbols), 10-day
average (solid line) and standard deviation (error bars) from 1 December 2002 until 30 March 2003.
ACPD
4, 5019–5044, 2004Early unusual ozone loss during the Arctic
winter 2002/2003 compared to other winters F. Goutail et al. Title Page Abstract Introduction Conclusions References Tables Figures J I J I Back Close Full Screen / Esc
Print Version Interactive Discussion
PSC Surface area HCl ClOx O3 Loss Vortex
550 K 47 5 K 550 K 47 5 K 55 0 K 47 5 K
Fig. 6. PSC, HCl, ClOx, O3 loss and vortex surface area from REPROBUS at two isentropic levels 550 K and 475 K (colour scale – ClOx: pink 2000 pptv – O3loss: orange 5–10%, yellow 10–15%); top: on 5 December 2002, middle: on 25 December 2002, bottom: on 15 January 2003.
ACPD
4, 5019–5044, 2004Early unusual ozone loss during the Arctic
winter 2002/2003 compared to other winters F. Goutail et al. Title Page Abstract Introduction Conclusions References Tables Figures J I J I Back Close Full Screen / Esc
Print Version Interactive Discussion
© EGU 2004
Fig. 7. Same as Fig. 5 but for SLIMCAT.