READ THESE TERMS AND CONDITIONS CAREFULLY BEFORE USING THIS WEBSITE.
https://nrc-publications.canada.ca/eng/copyright
Vous avez des questions? Nous pouvons vous aider. Pour communiquer directement avec un auteur, consultez la
première page de la revue dans laquelle son article a été publié afin de trouver ses coordonnées. Si vous n’arrivez pas à les repérer, communiquez avec nous à PublicationsArchive-ArchivesPublications@nrc-cnrc.gc.ca.
Questions? Contact the NRC Publications Archive team at
PublicationsArchive-ArchivesPublications@nrc-cnrc.gc.ca. If you wish to email the authors directly, please see the first page of the publication for their contact information.
NRC Publications Archive
Archives des publications du CNRC
This publication could be one of several versions: author’s original, accepted manuscript or the publisher’s version. / La version de cette publication peut être l’une des suivantes : la version prépublication de l’auteur, la version acceptée du manuscrit ou la version de l’éditeur.
Access and use of this website and the material on it are subject to the Terms and Conditions set forth at
Lighting system effects on judged lighting quality and facial
appearance
Veitch, J. A.; Miller, N.; McKay, H.; Jones, C.
https://publications-cnrc.canada.ca/fra/droits
L’accès à ce site Web et l’utilisation de son contenu sont assujettis aux conditions présentées dans le site LISEZ CES CONDITIONS ATTENTIVEMENT AVANT D’UTILISER CE SITE WEB.
NRC Publications Record / Notice d'Archives des publications de CNRC:
https://nrc-publications.canada.ca/eng/view/object/?id=26b0e13a-1dae-474e-b802-f41e9cc9dd37 https://publications-cnrc.canada.ca/fra/voir/objet/?id=26b0e13a-1dae-474e-b802-f41e9cc9dd37
Lighting System Effects on Judged Lighting Quality
and Facial Appearance
Author: Veitch, J.A.; Miller, N.; McKay, H.; Jones, C. Date: May 4, 2006
Report: NRCC-39865
Version of:
Paper presented at the 1996 Annual Conference of the I lluminating Engineering Society of North America, Cleveland, OH, August 5-7, 1996.
Abstract: This paper reports the results of the third joint workshop of the I ESNA Quality of the Visual
Environment committee and the I ALD Metrics of Quality committee, held at the National Research Council of Canada in December 1995. Seventeen committee members and invited guests served as research participants in a brief experiment to test the hypothesis that luminance distribution predicts judgments of the acceptability of a luminous environment for VDT work. Four lighting systems (suspended direct/ indirect; furniture-mounted indirect with supplemental task lighting; recessed deep-cell parabolic troffers; and, recessed flat-lens troffers ) were used to create four different, yet realistic, luminous environments in a open-plan office having six workstations. All participants rated the quality of the lighting systems using a 10-item questionnaire and also rated the appearance of male and female models under each lighting system. Lighting quality ratings increased with increasing partition luminance and decreasing reflected luminaire images in the VDT screen. Lighting systems with an indirect component were rated more highly than those with direct lighting only; the specific luminaires used also influenced the ratings of lighting quality. Ratings of facial appearance were related to the degree of directionality of illumination, with more directional lighting leading to higher ratings. The results of this and other workshop provide
guidance for future research and to other QVE/ MOQ committee work.
Lighting System Effects on Judged Lighting Quality and Facial
Appearance
As part of its joint effort to reach understanding and consensus about what constitutes a good quality luminous environment, and how to measure it, the I ESNA Quality of the Visual
Environment / I ALD Metrics of Quality committee has held a series of workshops in which lighting practitioners and researchers come together to examine selected issues. These workshops are pilot projects that assist committee members to test specific hypotheses and to discuss their opinions about lighting quality. This paper presents the results of the third such workshop, held in Ottawa, Ontario, at the National Research Council of Canada (NRC), in December, 1995.
The 1995 workshop followed up the previous year's examination of the effects of varying
luminance ratios and illuminance levels on judgments of the acceptability of office environments. I n the 1994 Seattle workshop, the committee learned that higher wall and ceiling luminances lead to better judgments of comfort and acceptability, up to wall/ ceiling luminance ratios of 1:3 or 1:3. When wall/ ceiling luminance ratios are extreme (1:5 or 5:1), higher work plane illuminances can improve judgments of quality. These results were presented at the I ESNA conference in New York
(Miller, McKay, & Boyce, 1995).
The 1995 Ottawa workshop tested the effects of lighting systems installed in a realistic VDT office setting on two dependent variables that are important to office environments: judgments about the lighting and its effects on work; and, judgments of the facial appearance of male and female models. The lighting quality judgments replicated the judgments made at the Seattle workshop, but in a different experimental design. The facial modeling judgments were included because the committee believes that the appearance of other people is an important consideration in planning a lighting installation. I n contrast to the Seattle workshop, which used carefully contrived settings to study luminance ratios and illuminance levels, the Ottawa workshop used lighting systems designed and installed in a manner typical of existing North American offices. Furthermore, the Seattle workshop judgments were based on the appearance of the space, whereas the Ottawa lighting quality judgments were based on the appropriateness of the lighting for paper and VDT-based office work.
Specifically, this mini-experiment tested the following hypotheses, based on previous workshops and the lighting-behavior literature (reviewed, for example, in Veitch & Newsham, 1995):
● Lighting systems that provide indirect illumination are judged to be higher quality than
direct-only systems for VDT office work.
● Lighting systems with both direct and indirect components are judged more favorably than
indirect-only systems for VDT office work.
● Parabolic louvered systems are judged to be higher quality than lensed direct systems for
VDT office work.
● Differences in modeling between lighting systems affect judgments of the facial appearance
of people under those systems.
Predictive relationships between judgments of lighting quality and luminous conditions were also examined, using the volumetric brightness - acceptability relationship from the 1994 Seattle workshop as a starting point.
Method
Participants
The participants were 17 lighting practitioners and researchers from the United States, Canada, and United Kingdom. They ranged in age from late 20s to early 60s. There were 12 men and 5 women. Vision was not tested; those who required glasses or contact lenses wore them. The participants were instructed to try to respond as naive end-users, rather than as experts.
Setting
The workshop took place in the I ndoor Environment Research Facility (I ERF) at NRC. The I ERF is a 12.2 x 7.3 m (40 x 24 ft) office designed for acoustics, lighting, ventilation, and indoor air
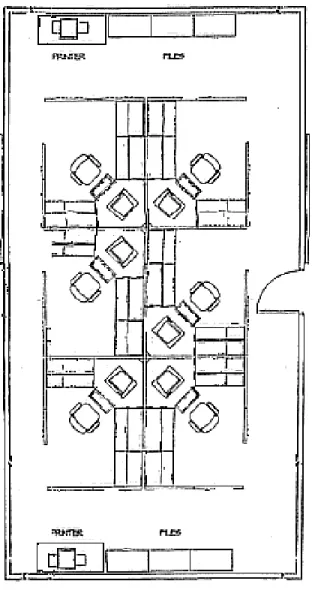
quality research. The room is windowless at present, although there is an exterior wall. The space is furnished as a typical mid-level clerical or administrative office similar to those currently being installed in Canadian government buildings (see Figure 1). There are six identical open-plan workstations of approximately 6 sq. m (65 fsq. ft) with space for shared file cabinets and printers
at the end of the room. The workstations are standard modular systems furniture (175 cm [ 66 in] panel height) with computers, storage space, keyboard shelf, and adjustable-height chair. A dedicated data acquisition system monitored temperature, noise, and ventilation, to ensure that conditions were within the normal range for office environments.
Figure 1. Floor plan of I ERF.
Lighting Conditions
Four lighting systems were compared. They were selected based on previous committee work (Miller et al., 1995), because they create a variety of realistic luminous conditions in open-plan offices, and because they were available for use at the time of the workshop. The designs themselves were created by a panel of lighting designers to specifications provided by NRC staff for their ongoing work (cf., Veitch & Newsham, 1995, 1996). All the layouts are in use in existing offices in North America. By using lighting designs that are realistic, we hoped to understand better how lighting quality is judged by present-day standards.
The four lighting systems were: suspended direct/ indirect; furniture-mounted indirect with supplemental compact fluorescent task lighting; recessed 1 x 4 troffers with semi-specular parabolic deep-cell louvers; and, recessed 1 x 4 troffers with K-12 prismatic lenses. Electronic ballasts and F32T8 3500K (80 Series) lamps were used. All of the lamps had been burned-in for
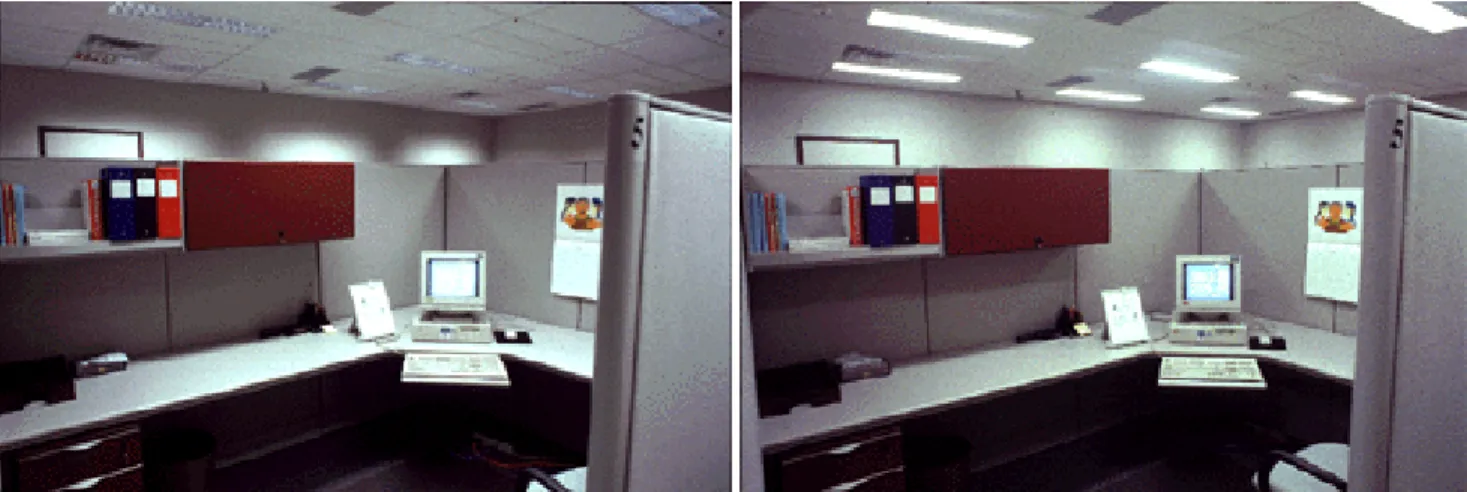
100 hours and were warmed for 1 hour prior to any measurements. The CFLs in the task lamps also had a CCT of 3500 K, but were not burned-in. Photographs of the four systems are shown in
Figure 2.
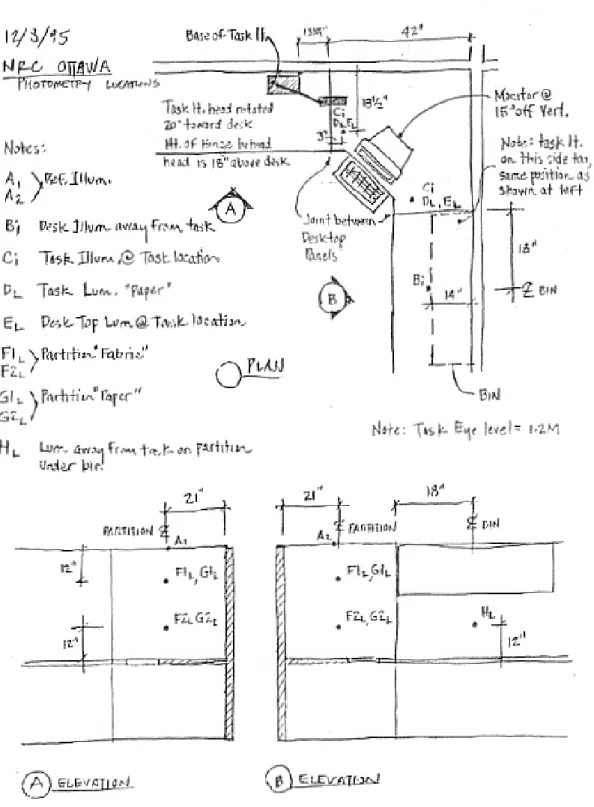
The lighting systems were characterized with photometry at one end and one middle workstation. The location of the measurements within the workstations is illustrated in Figure 3. Digital images of the scenes were also taken for future analyses. Table 1 provides the general photometric data for all four lighting conditions.
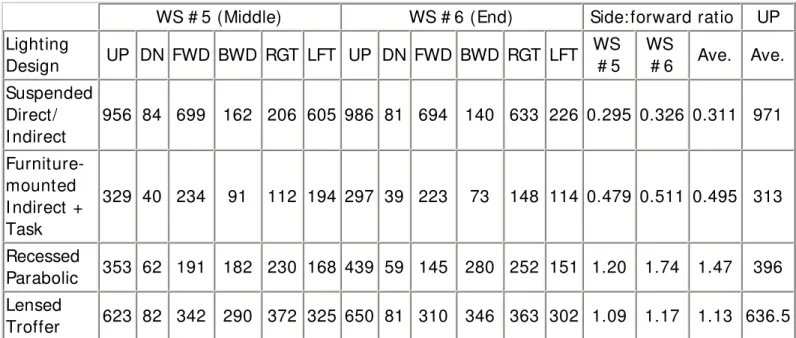
Cubic illuminance measurements were taken in support of the facial modeling hypothesis using six Graseby illuminance sensors mounted on a tripod and oriented to form the six sides of a cube. This "head" was positioned inside the entrance of two workstations (one end, one middle) in the location of the model for the facial appearance judgments. Table 2 displays these illuminance values.
Table 2 Cubic I lluminance Measurements
WS # 5 (Middle) WS # 6 (End) Side:forward ratio UP Lighting Design UP DN FWD BWD RGT LFT UP DN FWD BWD RGT LFT WS # 5 WS # 6 Ave. Ave. Suspended Direct/ I ndirect 956 84 699 162 206 605 986 81 694 140 633 226 0.295 0.326 0.311 971 Furniture-mounted I ndirect + Task 329 40 234 91 112 194 297 39 223 73 148 114 0.479 0.511 0.495 313 Recessed Parabolic 353 62 191 182 230 168 439 59 145 280 252 151 1.20 1.74 1.47 396 Lensed Troffer 623 82 342 290 372 325 650 81 310 346 363 302 1.09 1.17 1.13 636.5
Dependent Measures
Lighting quality ratings
A set of ten Likert and dichotomous-choice questions about lighting quality was created based on previous research (see Appendix A). The questions concerned the appropriateness of the lighting for office work, the presence or absence of glare, and the overall acceptability of the lighting. Four questions were taken from the 1980s field study commissioned by the Lighting Research I nstitute, the Electric Power Research I nstitute, the New York State Energy Research and Development Authority, and the U.S. Department of Energy (Collins, Fisher, Gillette, & Marans, 1989). Five questions were modified from field surveys conducted by Battelle Pacific Northwest Laboratory (J. Heerwagen, personal communication). The tenth question was the global judgment of acceptability used by the committee in the 1994 Seattle workshop, and was included to provide a comparison of these data directly to data previously collected. All ten questions were presented on a PC using custom software developed at NRC. The data were stored on the PC for later retrieval and analysis.
Facial appearance ratings
Three questions were used to assess the effects of the lighting on facial appearance. These questions were asked by the model directly, and the responses were written down for later data entry. Appendix B contains the script used by the models. Likert scale ratings were used for judgments of how flattering the light was to the model and how acceptable the face lighting was. The third, yes/ no (dichotomous choice) question concerned whether or not the lighting would be
acceptable for an office.
Procedure
This experiment used a repeated-measures design, in which all participants judged all lighting conditions. Time constraints required all participants to view the lighting conditions in the same order. On the first day three lighting conditions were presented: suspended direct/ indirect; furniture-mounted indirect with task lighting; and, recessed troffers with deep-cell parabolic louvers. On the second day, recessed lensed troffers were evaluated (one participant viewed this condition on the day after). Except for the lighting system, the office layout, furnishings, and conditions were identical for all lighting conditions.
The 17 participants were divided into three groups of either 5 or 6 participants. Each group entered the I ERF one at a time for its evaluation period of a given lighting condition. Each member of the group was randomly assigned to one of the six workstations for each lighting system evaluation. The other groups were occupied with other committee business when not engaged in evaluating a lighting system. The evaluation period for each lighting system lasted approximately 15 minutes.
During the first ten minutes, the participants worked on a series of computer-based tasks developed at NRC. This sequence of events was automated, making an intensive work session prior to the lighting quality ratings. There were four minutes of typing from a high-contrast black-on-white page; three minutes of proofreading lists of numbers presented on-screen; and, two minutes of a reaction time task similar to a video game, in which the participant's task is to detect and erase targets as they move across the computer screen. The data provided during this time were not analyzed; the purpose of the tasks was to provide realistic working conditions to form the basis of the lighting quality judgments. At the end of this time, the participants completed the 10 lighting quality ratings.
When the participants had completed the computer ratings, one male and one female model entered the I ERF (the models differed for each group, as models also served as participants). Each visited every workstation individually. The model stood inside the entrance to the
workstation and asked the occupant to look at his or her face, then to answer the three facial modeling rating questions. When the occupant had rated both male and female models, the evaluation of that lighting system was complete, and the occupant left the I ERF.
When all the members of that group had left, the next group was assembled. When all three groups had completed their evaluations of a given lighting system, the changeout team of NRC staff removed the luminaires and installed the next lighting system. The photometry team (workshop participants) followed the changeout team and recorded the measurements by hand for later data entry.
Following the quantitative evaluations of each lighting system, there was a general discussion period in which individuals could express more detailed opinions about the installations. These conversations were taped and later transcribed. Selections from the comments appear in the Results section below.
Lighting Quality Ratings
Comparisons betw een lighting systems
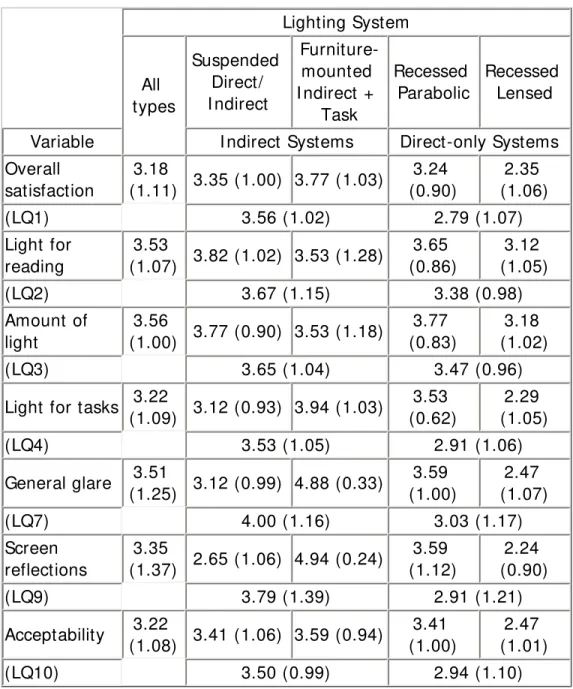
The means and standard deviations for the Likert-scaled lighting quality ratings for each lighting condition are displayed in Table 3. These ratings were analyzed using multivariate analysis of variance (MANOVA), which is appropriate for sets of related dependent measures. One interprets tests on individual items only if the multivariate test reaches statistical significance (Hummel & Sligo, 1971). Three independent, planned comparisons were tested:
● Lighting systems with indirect illumination compared to direct-only (recessed) systems.
● Suspended direct/ indirect lighting compared to furniture-mounted indirect lighting.
● Parabolic louvered systems compared to lensed direct systems. Table 3 Means and Standard Deviations for Lighting Quality Ratings
Lighting System All types Suspended Direct/ I ndirect Furniture-mounted I ndirect + Task Recessed Parabolic Recessed Lensed
Variable I ndirect Systems Direct-only Systems Overall satisfaction 3.18 (1.11) 3.35 (1.00) 3.77 (1.03) 3.24 (0.90) 2.35 (1.06) (LQ1) 3.56 (1.02) 2.79 (1.07) Light for reading 3.53 (1.07) 3.82 (1.02) 3.53 (1.28) 3.65 (0.86) 3.12 (1.05) (LQ2) 3.67 (1.15) 3.38 (0.98) Amount of light 3.56 (1.00) 3.77 (0.90) 3.53 (1.18) 3.77 (0.83) 3.18 (1.02) (LQ3) 3.65 (1.04) 3.47 (0.96) Light for tasks 3.22
(1.09) 3.12 (0.93) 3.94 (1.03) 3.53 (0.62) 2.29 (1.05) (LQ4) 3.53 (1.05) 2.91 (1.06) General glare 3.51 (1.25) 3.12 (0.99) 4.88 (0.33) 3.59 (1.00) 2.47 (1.07) (LQ7) 4.00 (1.16) 3.03 (1.17) Screen reflections 3.35 (1.37) 2.65 (1.06) 4.94 (0.24) 3.59 (1.12) 2.24 (0.90) (LQ9) 3.79 (1.39) 2.91 (1.21) Acceptability 3.22 (1.08) 3.41 (1.06) 3.59 (0.94) 3.41 (1.00) 2.47 (1.01) (LQ10) 3.50 (0.99) 2.94 (1.10)
condition (first line of each section) and for the comparison of systems with and without an indirect component (second line of each section). For all variables, possible scores range from 1 to 5, with 5 indicating better lighting quality.
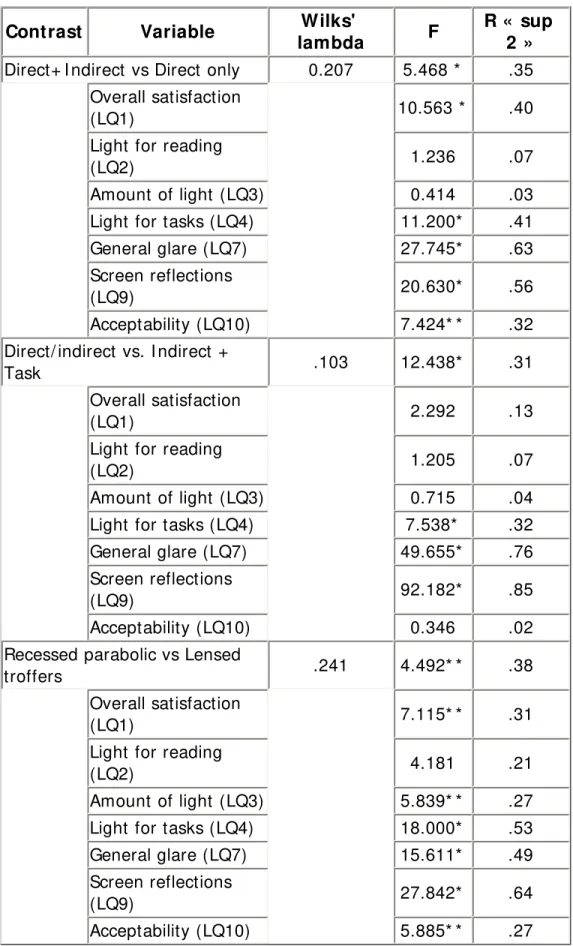
Table 4 MANOVA Results for Lighting Quality Ratings
Contrast Variable Wilks'
lambda F
R « sup 2 »
Direct+ I ndirect vs Direct only 0.207 5.468 * .35 Overall satisfaction
(LQ1) 10.563 * .40 Light for reading
(LQ2) 1.236 .07
Amount of light (LQ3) 0.414 .03 Light for tasks (LQ4) 11.200* .41 General glare (LQ7) 27.745* .63 Screen reflections
(LQ9) 20.630* .56 Acceptability (LQ10) 7.424* * .32 Direct/ indirect vs. I ndirect +
Task .103 12.438* .31 Overall satisfaction
(LQ1) 2.292 .13
Light for reading
(LQ2) 1.205 .07
Amount of light (LQ3) 0.715 .04 Light for tasks (LQ4) 7.538* .32 General glare (LQ7) 49.655* .76 Screen reflections
(LQ9) 92.182* .85 Acceptability (LQ10) 0.346 .02 Recessed parabolic vs Lensed
troffers .241 4.492* * .38 Overall satisfaction
(LQ1) 7.115* * .31 Light for reading
(LQ2) 4.181 .21
Amount of light (LQ3) 5.839* * .27 Light for tasks (LQ4) 18.000* .53 General glare (LQ7) 15.611* .49 Screen reflections
(LQ9) 27.842* .64 Acceptability (LQ10) 5.885* * .27
Note. All multivariate contrasts have df= 7,10. All univariate contrasts have df= 1,16. * indicates
p< .01. * * p< .05. R « sup 2 » for multivariate effects is the average variance explained for all univariate effects.
Table 4 summarizes the MANOVA results. There were significant multivariate effects for all three planned comparisons, which are large in behavioral science terms (cf. Cohen, 1988), each
accounting for more than 20% of the variance in their respective variables. The lighting systems with an indirect component were rated more favorably than the direct-only systems in terms of overall satisfaction, absence of glare, and acceptability. The furniture-mounted indirect system was rated more favorably than the suspended direct/ indirect system in terms of its effect on participants' ability to do the tasks and for the absence of glare (see below for a discussion of this point). The recessed parabolic troffers were rated more favorably than the recessed lensed
troffers on almost all variables. Reported glare was worst for the recessed lensed troffers.
Glare ratings
There were two yes/ no questions related to the presence of glare and reflected images, and one question concerning the sources of glare, which were examined individually because they were unsuitable for the MANOVA analyses. The pattern of responses differed by lighting system (Table 5). Almost all participants reported both glare and reflected images for all but the furniture-mounted indirect system with task lighting. Few participants indicated a specific source for the glare, possibly because in most cases the only possible source was the overhead lighting.
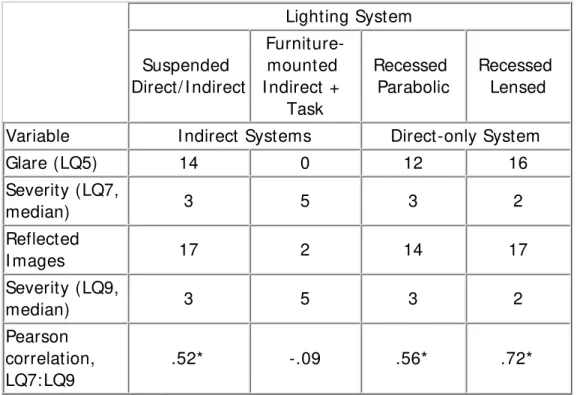
Table 5 Frequency of Reported Glare and Reflected I mages
Lighting System Suspended Direct/ I ndirect Furniture-mounted I ndirect + Task Recessed Parabolic Recessed Lensed
Variable I ndirect Systems Direct-only System Glare (LQ5) 14 0 12 16 Severity (LQ7, median) 3 5 3 2 Reflected I mages 17 2 14 17 Severity (LQ9, median) 3 5 3 2 Pearson correlation, LQ7:LQ9 .52* -.09 .56* .72*
Note. The severity ratings are the median values for the Likert-scaled ratings in questions LQ7
and LQ9, reverse-coded so that higher values indicate better lighting (less glare). All ratings were on scale of 1-5. * p< .05.
lighting system, Pearson correlation coefficients were calculated, and are shown in Table 5. The two ratings were highly related for the suspended direct/ indirect system, recessed parabolic troffers, and recessed lensed troffers, but were not identical (the correlations were less than 1). Not all of the overall glare annoyance was associated with reflected images in the VDT screen, although this relationship was very strong for the lensed recessed troffers (r= .72). For the furniture-mounted indirect system there was no relationship between the two glare severity ratings; however, there was also almost no glare reported.
Composite measure of lighting quality
The seven Likert-scaled ratings all relate to the broad concept (construct) of lighting quality; that is, all can be construed as elements of the judgment of a lighting system as "good" or "bad". When individual questions represent parts of a larger construct, it may be desirable to combine them into a composite score that represents the whole construct. Such composite scores usually are more normally distributed and more reliable than the individual scores (Ghiselli, Campbell, & Zedeck, 1981).
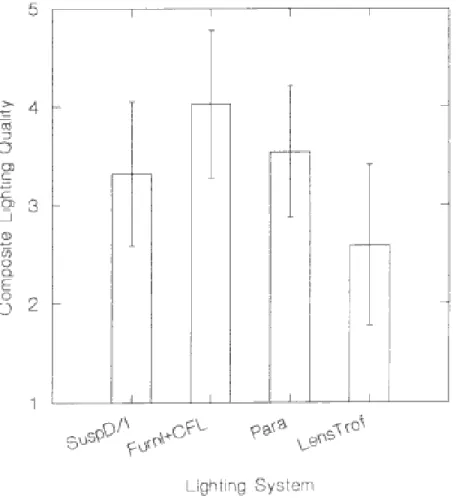
A composite Lighting Quality rating was created by taking the average scores on questions LQ1, LQ2, LQ3, LQ4, LQ7, LQ9, and LQ10. This variable combines the questions used in the Collins, Fisher, Gillette and Marans (1989) lighting quality survey, with glare and reflected image severity ratings, and an overall question about the acceptability of the lighting. The internal consistency reliability of this new variable is very good (Cronbach's alpha = .90). I ts overall mean is 3.37, and standard deviation 0.89. The means (standard deviations in parentheses) for the lighting systems are: suspended direct/ indirect, 3.32 (0.74); furniture-mounted indirect + task, 4.03 (0.76);
recessed parabolic, 3.54 (0.67); recessed lensed troffers, 2.59 (0.82). These follow the pattern one would expect from the MANOVA results for the individual items. Figure 4 shows a bar chart of the composite lighting quality scores by lighting system. Agreement between participants in their ratings of the lighting systems is statistically significant (Friedman statistic = 20.10, df = .39, p < .05), and moderate in size (Kendall's W = .39).
Figure 4. Bar chart of composite lighting quality ratings (means and standard deviations) by
lighting system type.
Predicting Lighting Quality from luminous conditions
The starting point for this analysis was the result of the 1994 Seattle workshop. Miller, McKay, and Boyce (1995) created a composite predictor variable that described the overall brightness of surfaces in the field of view, which they called volumetric brightness. They calculated it as the average of the wall and ceiling luminances. This value correlated highly with an overall rating of the acceptability of the lighting. Higher volumetric brightness was associated with higher
acceptability ratings.
I n the 1995 Ottawa setting, furniture partitions rather than room walls formed the boundary of the field of view in front of the seated participant. Partition luminance, rather than wall
luminance, was used with ceiling luminance to calculate the volumetric brightness for each of the four lighting systems (see Table 1). As previously, the average of all ceiling and partition
luminance values was used to create this new variable. The volumetric brightness thus calculated was entered into a regression equation with the composite variable, Lighting Quality, resulting in the following equation:
LQ = 3.83 - .002 * VOLBRI
This regression weight is statistically significant (F (1,66)= 20.37; p< .01) and explains 23.6% of the variance (R sq. (adjusted)= .224).
The relationship is entirely different from that observed in the 1994 Seattle workshop, both in direction and magnitude. One reason for this is the inclusion of the recessed lensed troffers, and thereby including the luminaire luminance in the calculation of average ceiling luminance. We attempted to explore this possibility by repeating the analysis without the recessed lensed
troffers, but did not find an interpretable result. The reduced sample size with only three lighting conditions reduced the power of the statistical tests, so that an adequate test of this hypothesis remains for future research.
Another possibility is that differences in the task and partition height changed the field of view. I n Seattle, the emphasis was on the appearance of the space, and participants were cued to
examine both the wall and ceiling luminances because they were aware that luminance ratio was one of the independent variables. I n Ottawa, the partition height was considerably greater (168 vs. 122 cm [ 66 versus 48 inches] ), and participants' attention was focused down to the VDT screen and the paper task. Thus, the field of view was dominated by the VDT screen and the partition luminance.
This second possibility was tested using a regression model in which the luminance of the reflected image in the VDT screen (dark screen, labeled RI VDT) and the average partition fabric luminance (PARTLUM) were entered as predictors of overall lighting quality. Of all the possible measures of VDT lighting, the reflected image luminance seemed most reasonable given the variability in reported severity of screen reflections for the different lighting conditions. This analysis produced the following standardized regression line:
LQ = -0.924* RI VDT + 0.459* PARTLUM
The larger absolute value of the standardized regression weight for the reflected image luminance indicates that its contribution to these lighting quality judgments is greater than the partition luminance contribution, although both standardized regression coefficients are statistically significant contributors. Overall the line explains 31.4% of the variance in the lighting quality ratings (R sq. (adjusted)= .293). Lighting quality ratings decrease with increases in reflected images in the VDT screen, and increase with increasing partition luminance.
Facial Appearance Ratings
The results of the yes/ no question about the acceptability of the lighting system for face lighting in an office revealed that a small number of participants felt that the furniture-mounted indirect system would be unacceptable because it was too dark. The recessed lensed troffers were criticized as too glaring. However, overall the participants reported that the lighting systems would be acceptable.
Comparisons betw een lighting systems
The analysis of the facial appearance scale ratings mirrored that for the lighting quality ratings. The descriptive statistics are displayed in Table 6 and the MANOVA results in Table 7. There were significant multivariate effects for the contrast of indirect versus direct-only systems and the contrast of suspended direct/ indirect versus furniture-mounted indirect systems. Systems with
some indirect component were judged to be more flattering to both male and female models, and to be more acceptable forms of face lighting, than the direct-only systems. The suspended direct/ indirect system was more flattering and more acceptable for both male and female models than the furniture-mounted indirect system. There were no significant differences between the two forms of recessed troffers in terms of the facial appearance of the models.
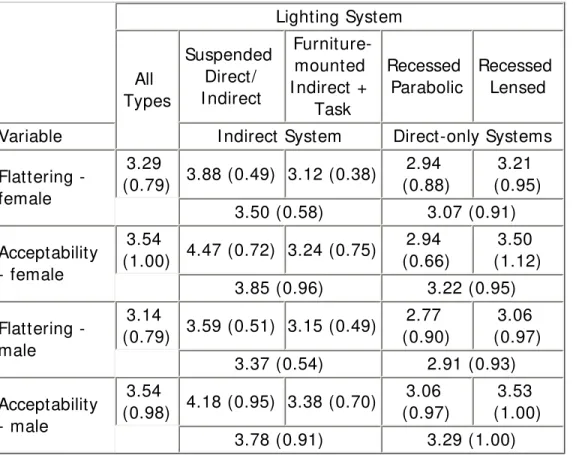
Table 6 Means and Standard Deviations for Facial Appearance Ratings
Lighting System All Types Suspended Direct/ I ndirect Furniture-mounted I ndirect + Task Recessed Parabolic Recessed Lensed
Variable I ndirect System Direct-only Systems Flattering - female 3.29 (0.79) 3.88 (0.49) 3.12 (0.38) 2.94 (0.88) 3.21 (0.95) 3.50 (0.58) 3.07 (0.91) Acceptability - female 3.54 (1.00) 4.47 (0.72) 3.24 (0.75) 2.94 (0.66) 3.50 (1.12) 3.85 (0.96) 3.22 (0.95) Flattering - male 3.14 (0.79) 3.59 (0.51) 3.15 (0.49) 2.77 (0.90) 3.06 (0.97) 3.37 (0.54) 2.91 (0.93) Acceptability - male 3.54 (0.98) 4.18 (0.95) 3.38 (0.70) 3.06 (0.97) 3.53 (1.00) 3.78 (0.91) 3.29 (1.00)
Note. Table contains means (standard deviations in parentheses) for the ratings of each lighting
condition (first line of each section) and for the comparison of systems with and without an indirect component (second line of each section). For all variables, possible scores range from 1 to 5, with 5 indicating better appearance or acceptability.
Table 7 MANOVA Results for Facial Appearance Ratings
Contrast Variable Wilks'
lambda F
R « sup 2 »
Direct+ I ndirect vs Direct only 0.501 3.232* * .37 Flattering - female 6.513* .29 Acceptability - female 12.065* .43 Flattering - male 8.658* .35 Acceptability - male 10.573* .40 Direct/ indirect vs. I ndirect +
Task 0.205 12.597* .48 Flattering - female 18.584* .54 Acceptability - female 58.8* .79
Flattering - male 4.433* * .22 Acceptability - male 9.257* .37 Recessed parabolic vs Lensed
troffers 0.764 1.005 .08 Flattering - female 0.624 .04 Acceptability - female 2.837 .15 Flattering - male 0.746 .04 Acceptability - male 1.759 .10
Note. All multivariate contrasts have df= 4,13. All univariate contrasts have df= 1,16. * indicates
p< .01. * * p< .05. R « sub 2 » for multivariate effects is the average variance explained for all univariate effects.
Composite measure of facial appearance
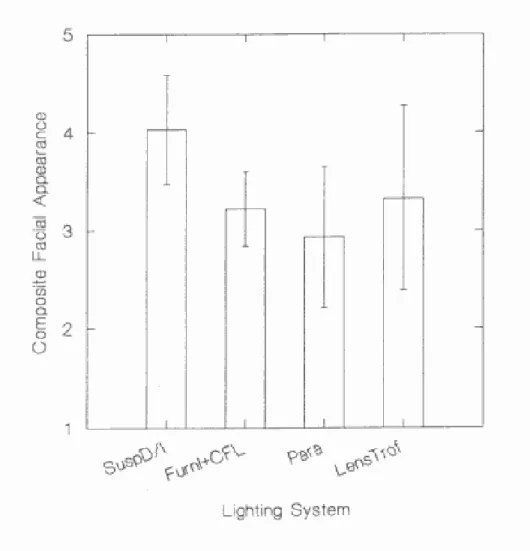
A composite measure of Facial Appearance was calculated as the average of the acceptability and flattery ratings for both male and female models. This variable had an overall mean of 3.38
(SD= 0.78), and excellent internal consistency reliability (Cronbach's alpha = .90). The means (standard deviations in parentheses) for the lighting systems are: suspended direct/ indirect, 4.03 (0.56); furniture-mounted indirect + task, 3.22 (0.38); recessed parabolic, 2.93 (0.72); recessed lensed troffers, 3.32 (0.94). Figure 5 shows the means and standard deviations for this variable by lighting system type.
Figure 5. Bar chart of composite facial appearance ratings (means and standard deviations) by
lighting system type.
Predicting facial appearance from luminous conditions
Two variables were selected as likely contributors to the ratings of Facial Appearance (abbreviated FACE) and were determined for the four lighting systems: average horizontal
illuminance at head height (abbreviated UPLUX), and the average ratio of the vertical illuminance at the front and the largest of the two sides, either right or left (abbreviated SI DEFOR). The latter ratio was chosen as an index of the degree of shadow, based on previous research (Rowlands & Loe, 1975) and discussion (D. Loe, personal communication, April 2, 1996). Horizontal illuminance was selected because the four lighting systems differed widely in this value and it appeared likely that the illumination level would influence appearance judgments. Table 2 displays these values for the four lighting systems.
The regression analysis produced an interpretable result:
FACE = 0.367* UPLUX - 0.242* SI DEFOR
The horizontal illuminance has a larger effect on facial appearance judgments than the side: forward ratio (as indicated by its larger standardized regression weight), but both are statistically significant predictors. Overall, the line explains 27.2% of the variance in the facial appearance
ratings (R sq. (adjusted)= .250). Facial appearance judgments increase with increasing horizontal illuminance, and decrease with increasing side:forward illuminance ratios. Within the range of conditions examined here, people prefer bright faces without extreme shadowing.
General Discussions of Lighting Systems
The open discussions following each lighting system evaluation were taped and later transcribed. For the discussions, the participants were asked to give their informed, expert opinions. As might be expected, the discussions were lively.
The suspended direct/ indirect system was rated poorly in the discussions, but the problem was identified as specific to the fixture itself, which one person stated was "a bad example of a suspended direct/ indirect fixture" because the louver had a wide spacing that revealed the bare lamps. The lamps served as sources of both direct glare and reflected luminaire images, which were said to be "unacceptable".
The space seemed very bright with the suspended direct/ indirect system, which some participants liked and others did not. This divergence of opinion was not apparent in the quantitative data, but much of the discussion concerned this issue. I n particular, the comparative darkness of the
corridor areas of the room came in for criticism because it appeared that corridor lighting had been sacrificed to light the workstations within an energy criterion. However, another participant felt that there was too little light on the paper task.
The indirect furniture-mounted system with task lighting elicited wildly divergent comments: "I thought it was really comfortable and I have no glare on the screen. I t felt great." "You live in that space. I 'll shoot myself." One participant described his feeling in both indirect systems as "distressed". The source of the divergence appeared to be differences in opinion about the generally low level of illumination. For some participants, it was gloomy and dull; for others, the absence of glare was comfortable. One person noted that many people in offices work with only the light of VDT screens and task lights; another remarked that the feeling of being "in a puddle" of light was uncomfortable. The comments are consistent with the importance of glare and partition luminance to the lighting quality judgments, but do not explain why this system had the highest overall ratings for satisfaction, acceptability, and composite lighting quality.
When the recessed parabolic system was installed, one individual said, "it was more comfortable for me" Another participant said, "I would have been willing to spend longer in that environment than the previous one... .it was better than those other two which were awful". Even this system, with an RP-1-designed louver to minimize screen reflections, was very sensitive to geometry. Participants reported that glare was not a problem in general, unless they began to slouch in their chairs. The lack of luminance uniformity with the parabolic system also aroused comment, but little consensus about whether this was good or bad.
For facial appearance, the comments about the recessed parabolic system were more favorable, but highly dependent on the geometry. "More contrast" and "more interesting" were comments made for both models, but if the model shifted during the viewing, then the appearance became "awful". One of the models reported that all of the seated participants looked unattractive, with sharp shadows and bright noses, so that from the perspective of a standing viewer, the parabolic system would have been unacceptable in terms of facial modeling.
A recurrent theme throughout all the discussions was the importance of surface luminances and the interaction of the lighting system and reflectance values of walls, partitions, and furniture. The interior design of the NRC facility was criticized by several participants as being too dark, although the paint and furniture finishes (p= .49) are typical of current Canadian government offices. This led to a discussion, at the end of the workshop, of the conflict between good design, the client's design criteria, maintenance, and codes and standards. For most developer-built or multi-use buildings, good, innovative design may be more costly, or good design may be incompatible with the requirements to be flexible enough to accommodate changes of use or occupancy. The tension between energy codes and such design requirements is expected to intensify, and this will affect many design decisions. For example, if code requirements of 10.76 W/ sq. m (1 W/ sq. ft) are enacted, good lighting design with adequate illuminance will require high reflectances: "I f somebody is going to come in and paint the walls blue it isn't going to work... it only works under very special conditions".
Moreover, it was concluded, the decisions about the surface reflectances often do not lie with the lighting consultant. The requirement for improved communication between all the design
professions also emerged from the concluding discussion. The reports and recommendations of committees require more effort for wider dissemination and education beyond the lighting
community, so that lighting design and other aspects of the building process are better integrated.
Discussion
This mini-experiment, like those before it, provides useful pointers for both research and application. One limitation of the 1994 Seattle workshop was the very brief period in which a large number of people attempted to share a small space in order to judge the acceptability of a lighting design. This workshop provided a more realistic basis (in that it was more similar to the way in which VDT offices are used) for judging lighting quality, but was not able to incorporate as broad a range of lighting conditions in the weekend format.
The results show that differences in lighting systems do result in large differences in judgments of lighting quality, even when judged after a brief and intense VDT work period. I n multiple
regression analyses, the average partition fabric luminance and the luminance of reflected images in the VDT screen explained a substantial proportion of the variance (over 30% ) in the overall lighting quality scores. Higher partition luminance and lower reflected image luminance predicted better lighting quality. The importance of these two aspects of the luminous environment was also apparent from the open discussion following the formal evaluations.
However, considerable variance in individual lighting quality ratings was also associated with the type of lighting system. Having some indirect lighting resulted in higher ratings on several scales, including overall satisfaction and acceptability. This finding replicates other work (e.g., Katzev, 1992).
Glare control was also related to the lighting system, although there is reason to believe that these ratings were influenced by the specific characteristics of the luminaires used in this study. The particular louver in the suspended direct/ indirect system used for this experiment had a wide enough spacing that bare lamps were visible to seated observers, a frequent remark during the open discussion. This resulted in the lower rating of screen reflections in this condition, and the lower overall rating of that system in comparison to the furniture-mounted indirect system. Similarly, the parabolic louvered system used in this experiment was rated more highly than the
recessed lensed troffers. The effect sizes for the ratings of glare were particularly large, indicating the strong relationship of the luminaire treatment (lens or louver) to glare control.
The analysis of lighting quality in relation to overall volumetric brightness, as calculated for the 1994 Seattle workshop, forced a reconsideration of the hypothesis. Average wall and ceiling luminance for the Seattle study did not include luminaire luminance, for there was no direct, lensed troffer system. Here, when luminaire luminance was included, higher volumetric brightness led to lower ratings of lighting quality. Bright surfaces in themselves do not make for acceptable lighting. There may be a threshold minimum for volumetric brightness that achieves acceptability, but it is also likely that there is a point at which luminance ratios (glare) become significant.
Determination of the optimal range for volumetric brightness is a task for more systematic research. This effort must occur in concert with work that clarifies the definition of this concept. Consideration of the differences between the settings in Seattle and Ottawa led to the use of partition luminance as an index of luminances in the field of view in the Ottawa setup; however, in both cases the photometric data represented only a small number of points. A better measure would be obtained by determining the operative field of view for a given setting, and then using digital image analysis to obtain the average luminance, which would constitute volumetric brightness from the occupant's point of view. Further work would develop a means to estimate this value using commonly-available spot photometers.
Facial modeling and judgments of lighting quality did not show precisely the same pattern of results. The suspended direct/ indirect system was rated as worse than the furniture-mounted indirect system on measures of overall satisfaction, acceptability, and glare control; however, the facial appearance of models was better under the suspended than the furniture-mounted system. Likewise, the recessed parabolic system was rated better on the lighting quality ratings than the recessed lensed troffers, but there was no difference between these two systems in their effects on facial appearance. The models stood outside of the direct scallop. I t is likely that the
suspended direct/ indirect and parabolic systems would have received lower facial appearance ratings had the models stood under the direct scallop that these luminaires create.
This divergence of outcome between different measures that are part of overall judgments of good or bad lighting requires more detailed study. I t may be an artifact of the specific luminaires used here. However, it also highlights the importance of decisions about the relative importance of different outcomes in deciding when adequate lighting quality has been achieved. That is, the lighting community must come to consensus about what goals are desired: for example, overall satisfaction, pleasant appearance, adequate light for non-verbal communication (an outcome not tested here, but discussed by the committee at the workshop), or task performance? Different lighting strategies may be required to support different outcomes, even within a single setting such as an office.
The open discussion of this issue revealed a source of frustration for designers, in that often they are limited in the range of surface brightnesses that they can achieve because of the choices made by other members of the design team. The interaction between lighting and other interior design choices requires further study and discussion with the other professions involved. Lighting quality depends in part on the wall colors and finishes that are not chosen by the lighting
designer or practitioner; therefore, to achieve a good standard of lighting quality will require a cooperative effort.
Both the 1994 and 1995 workshops have the limitation of having had lighting experts make judgments, rather than having nonspecialist participants. The results of both studies will be compared to those of studies with naive participants, such as the ongoing NRC Lighting Quality experiments (see Veitch & Newsham, 1995). Experts and laypeople frequently have divergent opinions and levels of understanding (e.g., Bostrom, Fischoff, & Morgan, 1992), but the workshop participants have attempted to act as laypeople would do. The purpose of this effort is to provide direction to lighting researchers by isolating the variables most likely to provide fruitful avenues for understanding lighting quality. For example, the results of this workshop will provide direction to the NRC project by focusing attention initially on partition luminance, reflected images, and lighting systems as the determinants of lighting quality.
The workshop experience also informs the deliberations of the joint QVE/ MOQ committee as it works to establish guidelines and language for lighting quality, and provides input to the
development of a research agenda for lighting quality research. This research agenda, currently in preparation, will be used to stimulate potential funders to sponsor independent research on the issues that have been identified as most important by the mini-experiments and discussions at the QVE/ MOQ workshops.
Acknow ledgements
Equipment used in the workshop was donated by CANLYTE I nc., General Electric Co., Ledalite Architectural Products I nc., Litecontrol Corp., Luxo Lamp Ltd., and Osram-Sylvania I nc. The authors, on behalf of the committee, would like to thank the National Research Council of Canada for hosting the workshop, and in particular the following people: Sherif Barakat, Dahlia Barakat, Sylvie Hill, Ralston Jaekel, Guy Newsham, Michael Ouellette, Dale Tiller, Jana Svec, and Joanne Wathier. We also gratefully acknowledge the invaluable assistance of Veda Clark, Markus Earley, Noel Florence, Phil Gabriel, David Loe, Terry McGowan, I van Pasini, Mark Rea, and Martyn Timmings with aspects of running the workshop, and thank all the attendees for two days of wonderful conversation, consultation, and conviviality.
References
Bostrom, A., Fischoff, B., & Morgan, M. G. (1992). Characterizing mental models of hazardous processes: A methodology and an application to radon. Journal of
Social I ssues , 48 , 85-100.
Cohen, J. (1988). Statistical power analysis for the
behavioral sciences (2nd ed.). Hillsdale, NJ: Erlbaum.
Collins, B. L., Fisher, W. S., Gillette, G. L., & Marans, R. W. (1989). Evaluating office
lighting environments:
Second level analysis (NI STI R 89-4069). Gaithersburg, MD: U.S. Department of Commerce, National I nstitute of Standards and Technology.
Ghiselli, E. E., Campbell, J. P., & Zedeck, S. (1981). Measurement theory for the
behavioral sciences . San Francisco, CA: W. H. Freeman & Co.
Hummel, T. J., & Sligo, J. R. (1971). Empirical comparison of univariate and multivariate analysis of variance procedures. Psychological
Bulletin, 76, 49-57.
Katzev, R. (1992). The impact of energy-efficient office lighting strategies on employee satisfaction and productivity. Environment and
Behavior, 24 , 759-778.
Miller, N., McKay, H., & Boyce, P. R. (1995, July). An approach to a measurement of
lighting quality . Paper presented at the I lluminating Engineering Society Annual Conference, New York, NY.
Rowlands, E., & Loe, D. (1975). Preferred illumination distribution in interiors. I n Proceedings of the 18th
Session of the Commission I nternationale de
l'Éclairage, London (CI E Publication No. 36, pp. 333-342). Paris: Bureau Centrale de la CI E.
Veitch, J. A., & Newsham, G. R. (1995). Quantifying lighting quality based on experimental investigations of end user performance and preference. I n
Proceedings of Right Light Three, The Third European Conference on Energy-Efficient Lighting, Newcastle-upon-Tyne, England, June 18-21,
1995 (Vol. 1, pp. 119-127). Newcastle-upon-Tyne, UK: Northern Electric PLC. Veitch, J. A., & Newsham, G. R. (1996). Experts' quantitative and qualitative assessments of lighting quality. Paper accepted for presentation at the 1996 Annual Conference of the I lluminating Engineering Society of North America (this volume).
Appendix A
Lighting Quality Ratings
1. Overall, how satisfied are you with the lighting at this work space?
❍ very satisfied
❍ fairly satisfied
❍ not very satisfied
❍ not at all satisfied
2. Rate the lighting available to you for reading at this workstation.
❍ excellent
❍ pretty good
❍ neutral
❍ not very good
❍ poor
3. Rate this workstation on the amount of light for the tasks you have just completed.
❍ excellent
❍ pretty good
❍ neutral
❍ not very good
❍ poor
4. Lighting at this desk hindered me from doing the tasks well.
❍ strongly disagree
❍ disagree
❍ neither agree nor disagree
❍ agree
❍ strongly agree
5. Do you notice any uncomfortable glare? yes no 6. Where is the glare?
ceiling lights ahead task lights
other:
7. How much does the glare bother you?
❍ extremely
❍ considerably
❍ moderately
❍ a little
❍ not at all
8. Do you notice any reflections in the computer screen? yes no 9. How much do the reflections in the computer screen bother you?
❍ extremely
❍ considerably
❍ moderately
❍ not at all
10. How do you rate the acceptability of this scene?
❍ completely acceptable ❍ ❍ barely acceptable ❍ ❍ completely unacceptable
Appendix B
Facial Appearance Ratings
The model stood within the doorway of the workstation and used the following script. Responses to the questions were made verbally and recorded by the model.
"Look at my face and the way it is lit. For a typical office lighting application, please answer the following questions:
● I s the lighting of my face flattering? Please answer on a scale of 1-5, where 1 means
"completely unflattering" and 5 means "completely flattering".
● I s this face lighting acceptable? 1 = completely unacceptable; 5 = completely acceptable.
● Would this lighting be acceptable in an office? Yes or No."
Figure 2
Figure 2. Photographs of I ERF with different lighting layouts.
Table 1 Workstation Photometry
Horizontal I lluminance (lux)
CHRX CHRY
I , End wall I , Side wall E, non-task area (168 cm), fixed sensors * Ave. (cd/ sq. m) (cd/ sq. m) (B) Lighting Design WS# 6 WS# 1 (220 cm) (160 cm) (220 cm) (160 cm) WS # 1 WS # 2 Suspended Direct/ I ndirect 437 423 430 0.404 0.403 32 39 47 53 510 520 Furniture-mounted I ndirect + Task 436 431 434 0.402 0.402 34 35 27 30 180 200 Recessed Parabolic 447 437 442 0.404 0.404 18 20 35 84 450 440 Recessed Lensed Troffer 621 589 605 0.405 0.403 110 90 40 54 490 480 E, desk left (lux) E, desk right (lux) I , task paper, left (cd/ sq. m) I , task paper, right (cd/ sq. m) I , desk surface, left (cd/ sq. m) (CL) (CR) (DL) (DR) (EL) Lighting Design WS # 1 WS # 2 WS # 1 WS # 2 WS # 1 WS # 2 WS # 1 WS # 2 WS # 1 WS # 2
Suspended Direct/ I ndirect 680 670 520 540 150 170 110 135 100 97 Furniture-mounted I ndirect + Task 770 840 225 220 180 200 50 50 115 130 Recessed Parabolic 580 450 480 440 125 100 100 110 80 70 Recessed Lensed Troffer 570 470 505 440 140 100 110 100 85 70 I , desk surface, right (cd/ sq. m) I , partition fabric, upper left (cd/ sq. m) I , partition fabric, upper right (cd/ sq. m) I , partition fabric, lower left (cd/ sq. m) I , partition fabric, lower right (cd/ sq. m) (ER) (F1L) (F1R) (F2L) (F2R) Lighting Design WS # 1 WS # 2 WS # 1 WS # 2 WS # 1 WS # 2 WS # 1 WS # 2 WS # 1 WS # 2 Suspended Direct/ I ndirect I ndirect + Task 80 76 51 51 49 48 49 51 51 51 Furniture-mounted 35 33 30 33 30 30 35 44 25 23 Recessed Parabolic 70 68 40 28 40 35 35 30 35 33 Recessed Lensed Troffer 75 67 52 45 50 44 40 35 41 36 I , partition paper, upper left (cd/ sq. m) I , partition paper, upper right (cd/ sq. m) I , partition paper, lower left (cd/ sq. m) I , partition paper, lower right (cd/ sq. m) I , partition fabric, under bin (cd/ sq. m) (G1L) (G1R) (G2L) (G2R) (H) Lighting design WS # 1 WS # 2 WS # 1 WS # 2 WS # 1 WS # 2 WS # 1 WS # 2 WS # 1 WS # 2 Suspended Direct/ I ndirect 110 120 100 110 100 120 120 130 30 22
Furniture-mounted I ndirect + Task 65 72 70 64 95 94 60 30 10 8 Recessed Parabolic 85 65 95 75 80 67 90 79 20 15 Recessed Lensed Troffer 115 100 120 110 100 93 95 92 22 26 I , max. ceiling, seated (cd/ sq. m) I , min. ceiling, seated (cd/ sq. m) I , CRT, white screen (cd/ sq. m) I , CRT black screen (cd/ sq. m) I , reflected images, white screen (cd/ sq. m) Lighting Design WS # 1 WS # 2 WS # 1 WS # 2 WS # 1 WS # 2 WS # 1 WS # 2 WS # 1 WS # 2 Suspended Direct/ I ndirect 410 450 100 100 130 120 25 24 240 180 Furniture-mounted I ndirect + Task 370 380 130 160 105 100 10 7 N/ A 110 Recessed Parabolic 40 36 35 28 110 140 12 14 130 180 Recessed Lensed Troffer 51 52 26 41 125 100 20 9 190 180 I , reflected images, black screen (cd/ sq. m) ave. ceiling I (cd/ sq. m) ave. partition fabric I (cd/ sq. m) max:min ceiling I ratio ceiling: partition Lighting Design WS # 1 WS # 2 WS # 1 WS # 2 WS # 1 WS # 2 WS # 1 WS # 2 WS # 1 WS # 2 Suspended Direct/ I ndirect 130 110 255 275 50 50 4.10 4.50 5.10 5.47 Furniture-mounted I ndirect + Task 25 20 250 270 30 33 2.85 2.38 8.33 8.31 Recessed Parabolic 57 80 38 32 38 38 1.14 1.29 1.00 1.02
Recessed Lensed Troffer 110 120 39 47 46 40 1.96 1.27 0.84 1.16 Reflected luminaire image, white screen (cd/ sq. m) Reflected luminaire image, black screen (cd/ sq. m) Desk paper: partition I ratio Volumetric Brightness (cd/ sq. m) Lighting Design WS # 1 WS # 2 WS # 1 WS # 2 WS # 1 WS # 2 Suspended Direct/ I ndirect 110 60 105 86 3.00 3.33 157.563 Furniture-mounted I ndirect + Task N/ A 10 15 13 5.54 5.19 145.625 Recessed Parabolic 20 40 45 66 3.33 3.45 34.625 Recessed Lensed Troffer 65 80 90 111 3.04 2.50 604.813
Note. The horizontal illuminance was taken from fixed Graseby sensors mounted at
partition height in unobtrusively in workstations 1 and 6. The other measurements were taken using hand-held Hagner Universal Photometers, model S2 (values rounded to nearest integer).