HAL Id: hal-02615286
https://hal.archives-ouvertes.fr/hal-02615286
Submitted on 30 Mar 2021
HAL is a multi-disciplinary open access
archive for the deposit and dissemination of
sci-entific research documents, whether they are
pub-lished or not. The documents may come from
teaching and research institutions in France or
abroad, or from public or private research centers.
L’archive ouverte pluridisciplinaire HAL, est
destinée au dépôt et à la diffusion de documents
scientifiques de niveau recherche, publiés ou non,
émanant des établissements d’enseignement et de
recherche français ou étrangers, des laboratoires
publics ou privés.
Multifrequency analysis of radar sea clutter directionnal
asymmetries
Zaynab Guerraou, Sébastien Angelliaume, Charles-Antoine Guérin
To cite this version:
Zaynab Guerraou, Sébastien Angelliaume, Charles-Antoine Guérin. Multifrequency analysis of radar
sea clutter directionnal asymmetries. 2017 IEEE International Geoscience and Remote Sensing
Sympo-sium (IGARSS), Jul 2017, Fort Worth, United States. pp.4453-4455, �10.1109/IGARSS.2017.8127987�.
�hal-02615286�
MULTIFREQUENCY ANALYSIS OF RADAR SEA CLUTTER DIRECTIONNAL
ASYMMETRIES
Zaynab Guerraou*, Sébastien Angelliaume* and Charles-Antoine Guérin**
ABSTRACT
This paper reports the first results inferred from the investigation of sea clutter azimuthal variations and their dependence on the radar electromagnetic frequency. We summarize the results derived from the study of SAR data acquired simultaneously at X- and L-band by ONERA (The French aerospace laboratory) and compare them to results stemming from other experiments in the literature. The conclusions drawn suggest that the azimuthal asymmetry is more pronounced at X than L band, potentially indicating that the directional asymmetry of the NRCS is gradually diminished as the frequency decreases. This seems to entail that the asymmetry is likely associated to the small scales of roughness whose electromagnetic returns are measured at X band and not at L band.
Index Terms— Sea surface, NRCS, directional
asymmetry, electromagnetic frequency, polarization 1. INTRODUCTION
The study and modeling of directional asymmetries can give more insight into ways of improving theories on wind and surface wave coupling in the context of the recovery of geophysical parameters (e.g. for wind vector retrieval applications). More Analyses of these asymmetries are being documented based on measurements acquired using the ever increasing capabilities of airborne and space-borne instruments. The numerous data sets described in the literature show evidence of azimuthal variation of the NRCS at medium grazing angles with different empirical relationships derived to relate the angular variations to the wind and/or wave directions. However, the mechanisms at the origin of these upwind/downwind (UDA) and upwind/crosswind (UCA) observations are far from being fully understood and taken into account by scattering models. One major difficulty in this prospect is deciphering the contributions from short and long scale surface waves to these directional asymmetries. Performing a frequency analysis can provide an indication of the surface roughness scales and features that are likely to drive the azimuthal modulation, depending on wind/wave conditions and geometrical properties. The aim of the work presented
herein is to investigate this frequency dependence as derived from ONERA data. The present paper is organized as follows: section 2 provides a brief overview of data having served as a basis for this study. Section 3 then exhibits results of azimuthal variations obtained from the previously described data. Section 4 establishes a comparative study by referring to results drawn from other data in the literature. Section 5 gives conclusions of the work presented herein and opens up perspectives to paired and complementary studies.
2. ONERA DATA
SETHI is an airborne remote sensing imaging system maintained and operated within ONERA. It integrates a new generation of radar and optronic payloads and can operate over a wide range of frequency bands from UHF-VHF to X-band, including L-X-band, with long range, very high resolution, polarimetric and interferometric capabilities and spans a wide range of acquisition geometries. SETHI is a pod-based system operating onboard a Falcon 20 Dassault aircraft, which is owned by AvDEF.
Data under analysis for this study have been collected within the framework of the POLLUPROOF campaign during which quad-pol SAR data were acquired at X- and L-band, with a range (across-track) resolution of 0.5 m (bandwidth from 9.6 to 9.9 GHz) and 1.0 m (bandwidth from 1.25 to 1.4 GHz), respectively. Images are processed with an azimuth (along-track) resolution equal to the range resolution at both X- and L-band, which implies an integration time equal to 1.1 s at X-band and 4.1 s at L-band. The instrument noise floor has been estimated using the method proposed in [1] and the results are shown in fig.1. The estimated Noise Equivalent Sigma0 (NESZ) is very low, ranging from around -37 to -50 dB at X-band and from around -51 to -53 dB at L-band, providing a good signal to noise ratio (SNR) over the imaged areas for efficient analysis. Figure 1 illustrates the noise levels and table 1 provides the ground truth data for this campaign.
**
MIO (UM 110, UTLN/AMU/CNRS/IRD)
F-83957 La Garde, France
*ONERA (The French Aerospace Lab),
3. RESULTS
To have a complete azimuth scan in the purpose of studying the directional dependency, a circular flight has been performed at a nearly constant incidence angle of 45° at X and L band. This scan corresponds to wind and wave conditions indicated in the first row of table 1. Figure 2 illustrates the variations of the resulting co-polarized and cross-polarized NRCS for this scan with respect to the azimuth angle relative to the wind direction. We recover the commonly observed pattern of a sinusoidal variation with respect to the wind direction: a maximum in the upwind direction, a secondary maximum in the downwind direction and two minima in the crosswind directions. This pattern can be accurately modeled by a truncated Fourier series expansion.
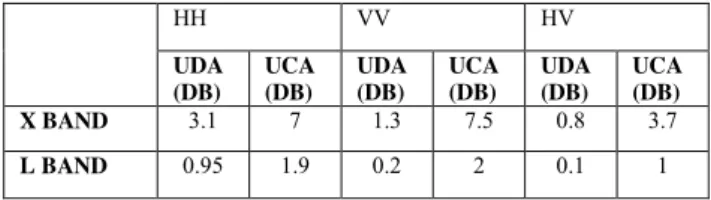
Table 2 summarizes the values of upwind/downwind and upwind/crosswind asymmetries. At X band, the UDA is found to be more pronounced for HH than VV polarization and the trend is slightly reversed for the UCA. The cross-polarized data present a less important azimuthal modulation compared to the co-polarized data. These conclusions are in accordance with the ones drawn from the study of the X band polarimetric dataset in [2]. These qualitative trends remain the same at L band and we tend to generalize them irrespective of the underlying frequency band. Nevertheless, the discrepancy in the orders of magnitudes of the asymmetries between the two frequency bands is noticeable. Figure 2 and table 2 clearly show that the asymmetries are significantly less important at L band, the difference reaching 2.15 dB (respectively 1.1 dB) in UDA at HH (respectively at VV) and about 5.5 dB in UCA at both HH and VV polarizations. In the upwind and downwind directions, the NRCS at X band is higher than the one at L band, which matches with the experimentally observed and physically modeled trend in the plateau region. However, due to the low azimuthal modulation at L band in contrast to the X band, the crosswind NRCS at X band becomes lower than the one at L band.
4. DISCUSSION
The previously inferred L band results are consistent with the study carried out by Isoguchi et al. [3], in which they examine the L band NRCS dependence on ocean surface wind and show that L band measurements present relatively slight azimuthal modulation (1 to 2 dB) at comparable wind speeds of 8 to 10 m/s. Consistent results are deduced from the study undertaken in [4], where it is shown that, at a fixed incidence angle and for mild to moderate wind speeds, the UDA increases with radar frequency. In the same perspective, the results reported by Masuko et al. [5] exhibit a more pronounced UDA at Ka band compared to X band (1 dB discrepancy) in the vicinity of 50° incidence angle at 9.5m/s wind speed. This seems to corroborate the assumption that short waves that are instantaneously interacting with local winds are apparently the most associated to directional asymmetries. It is also noteworthy that this assumption aligns with Cox and Munk's sun glitter measurements [6] confirming that, for a slick surface where Date (UTC) Time
Wind speed (m/s) Wind direction (from-deg) Wave height (m) Wave direction (from-deg) 18 may, 2015 17:00 8 255 0.5 240 22 may, 2015 13:00 7 315 2 270 22 may, 2015 16:00 7 315 1.75 270
Table 1: ground truth data for the experiment.
HH VV HV UDA (DB) UCA (DB) UDA (DB) UCA (DB) UDA (DB) UCA (DB) X BAND 3.1 7 1.3 7.5 0.8 3.7 L BAND 0.95 1.9 0.2 2 0.1 1
Table 2: UCA and UDA asymmetries at X and L band as derived from ONERA data at 45° incidence angle. Figure 1: Estimations of the NESZ at L (left panel) and X (right
panel) bands
Figure 2: Azimuthal variations at (left) X and (right) L band for HH (red), VV (blue) and HV (green) polarizations at a nominal incidence angle of 45°. Superimposed (Black) are the curves obtained from least-squares fitting of a 4th order Fourier expansion.
short-scale surface waves have been damped, the surface azimuthal asymmetry was significantly diminished, thus pointing out the role of small-scale ripples in generating directional asymmetries.
5. CONCLUSION AND PERSPECTIVES The first results derived from ONERA data indicate that the directional asymmetries are enhanced as the radar frequency increases. However, a more thorough analysis is needed to confirm this frequency dependence and investigate its behavior with respect to incidence angle and wind speed. For this purpose the study of other data acquired by ONERA at X and L band at different incidence angles and sea states is underway. Moreover, in parallel to the work on experimental data, attempts to improve the modeling of the asymmetries and better characterize and model their behavior with respect to the frequency are carried out based on NRCS simulations using the GO-SSA scattering model [7]. This latter study is beyond the scope of this paper.
6. REFERENCES
[1] I. Hajnsek, E. Pottier and S. R. Cloude, "Inversion of surface parameters from polarimetric SAR," in IEEE Transactions on Geoscience and Remote Sensing, vol. 41, no. 4, pp. 727-744, April 2003.
[2] Z. Guerraou, S. Angelliaume, L. Rosenberg and C. A. Guérin, "Investigation of Azimuthal Variations From X-Band Medium Grazing-Angle Sea Clutter," in IEEE Transactions on Geoscience and Remote Sensing, vol. 54, no. 10, pp. 6110-6118, Oct. 2016. [3] O. Isoguchi and M. Shimada, "An L-Band Ocean Geophysical Model Function Derived From PALSAR," in IEEE Transactions on Geoscience and Remote Sensing, vol. 47, no. 7, pp. 1925-1936, July 2009.
[4] C. M. H. Unal, P. Snoeij and P. J. F. Swart, "The polarization-dependent relation between radar backscatter from the ocean surface and surface wind vector at frequencies between 1 and 18 GHz," in IEEE Transactions on Geoscience and Remote Sensing, vol. 29, no. 4, pp. 621-626, Jul 1991.
[5] Masuko, H., K. Okamoto, M. Shimada, and S. Niwa, Measurement of microwave backscattering signatures of the ocean surface using X band and Ka band airborne scatterometers, J. Geophys. Res., 91(C11), 13065–13083, 1986.
[6] Cox,C.S., and W.H Munk, "Measurement of the Roughness of the Sea Surface from Photographs of the Sun’s Glitter," J. Opt. Soc. Am. 44, 838-850 (1954)
[7] G. Soriano and C. A. Guérin, “A cutoff invariant two-scale model in electromagnetic scattering from sea surfaces,” IEEE Geosci. Remote Sens.Lett. , vol. 5, no. 2, pp. 199–203, Feb. 2008.